

Key Insights
The global database market, valued at $131.67 billion in 2025, is poised for robust growth, exhibiting a Compound Annual Growth Rate (CAGR) of 14.21% from 2025 to 2033. This expansion is fueled by several key drivers. The increasing adoption of cloud computing and big data analytics necessitates sophisticated database solutions capable of handling massive datasets and complex queries. Furthermore, the growing demand for real-time data processing across various industries, including finance, healthcare, and e-commerce, is significantly boosting market growth. The rise of NoSQL databases, offering flexibility and scalability compared to traditional relational databases, is another significant factor contributing to this expansion. Competitive pressures are driving innovation, with major players like MongoDB, Amazon, and Google continuously enhancing their offerings and expanding into new segments. While data security concerns and the complexity of managing large database systems pose potential restraints, the overall market outlook remains highly positive. The market is segmented by type (relational, NoSQL, NewSQL, graph, etc.), deployment mode (cloud, on-premises), organization size, and industry vertical. The cloud deployment segment is experiencing the fastest growth, driven by the scalability, cost-effectiveness, and accessibility of cloud-based solutions.
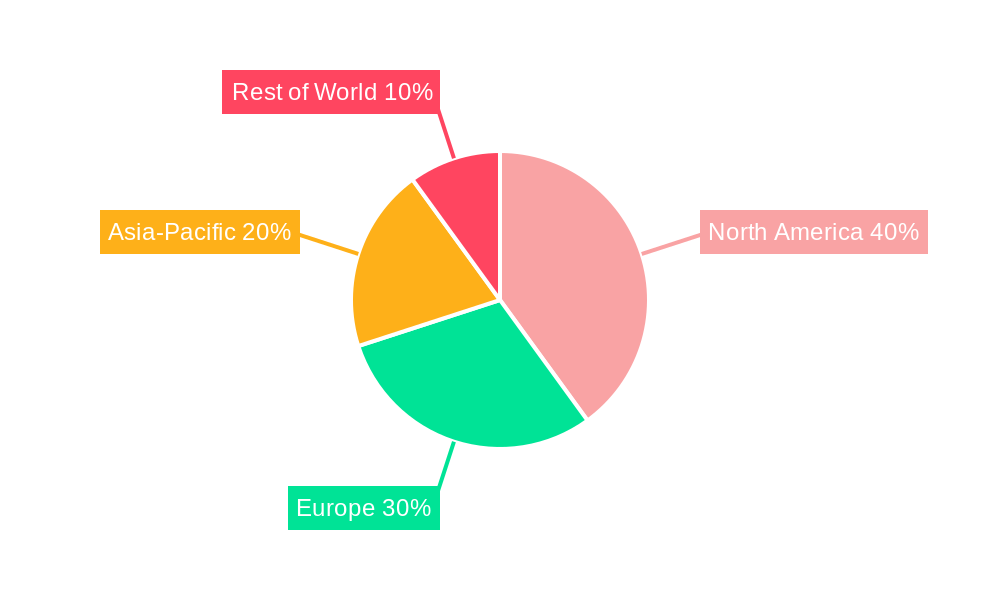
Looking ahead to 2033, the market is expected to surpass significantly higher figures, reflecting sustained growth across various segments and regions. North America and Europe currently hold significant market share, but emerging economies in Asia-Pacific and Latin America are expected to witness substantial growth driven by increasing digitalization and infrastructure development. The competitive landscape is characterized by both established players and emerging startups, leading to continuous innovation and product diversification. Strategic partnerships, mergers and acquisitions, and the development of advanced features like AI-powered database management are further shaping the market landscape. The long-term outlook for the database market is optimistic, with substantial potential for growth driven by technological advancements and increasing data volumes across industries.
This in-depth report provides a comprehensive analysis of the Database Market, projecting robust growth from 2025 to 2033. The study covers market size, segmentation, competitive landscape, key drivers, challenges, and future outlook, providing invaluable insights for businesses operating in this dynamic sector. The report incorporates data from the historical period (2019-2024), with 2025 serving as the base year and the forecast period extending to 2033. The market is valued at xx Million in 2025 and is expected to reach xx Million by 2033, showcasing significant growth potential.

Database Market Market Structure & Competitive Landscape
The Database Market exhibits a moderately concentrated structure, with several major players holding significant market share. However, the market is also characterized by continuous innovation, with new entrants and evolving technologies impacting the competitive landscape. Regulatory compliance, particularly concerning data privacy and security, is a critical factor influencing market dynamics. Product substitution, driven by the emergence of cloud-based solutions and NoSQL databases, presents both opportunities and challenges for established vendors. The market is segmented by deployment type (cloud, on-premises), database type (relational, NoSQL), and end-user industry (BFSI, healthcare, retail, etc.). M&A activity has been moderate in recent years, with xx Million in total deal value recorded between 2019-2024. This trend is expected to continue, driven by the need for companies to expand their product portfolios and geographic reach. The Herfindahl-Hirschman Index (HHI) for the market is estimated at xx, indicating a moderately concentrated market.
- Market Concentration: Moderately concentrated, with a few dominant players.
- Innovation Drivers: Cloud computing, AI/ML integration, NoSQL databases.
- Regulatory Impacts: GDPR, CCPA, and other data privacy regulations.
- Product Substitutes: Cloud-based databases, NoSQL databases, alternative data management solutions.
- End-User Segmentation: BFSI, Healthcare, Retail, Manufacturing, and more.
- M&A Trends: Moderate activity, driven by expansion and technological integration, with a total estimated value of xx Million between 2019 and 2024.
Database Market Market Trends & Opportunities
The Database Market is experiencing significant growth, driven by the increasing adoption of cloud computing, the rise of big data analytics, and the growing need for real-time data processing across various industries. The market size is projected to expand at a Compound Annual Growth Rate (CAGR) of xx% from 2025 to 2033, reaching xx Million by 2033. Technological advancements like serverless databases, in-memory computing, and distributed databases are transforming the market. Consumer preferences are shifting towards cloud-based solutions due to their scalability, cost-effectiveness, and ease of management. The competitive dynamics are intensifying, with established vendors facing challenges from agile startups offering innovative solutions. Market penetration rates vary considerably across segments, with cloud-based solutions exhibiting faster adoption rates compared to traditional on-premises deployments.

Dominant Markets & Segments in Database Market
The North American region currently holds the largest market share in the Database Market, driven by the presence of major technology companies and high adoption rates across various industries. Growth is also expected in the Asia-Pacific region, fueled by increasing digitalization and economic growth. The cloud-based segment is expected to dominate the market throughout the forecast period, owing to its scalability, flexibility, and cost-effectiveness.
- Key Growth Drivers (North America): Robust IT infrastructure, high levels of digital adoption, presence of major technology companies.
- Key Growth Drivers (Asia-Pacific): Increasing digitalization, growing economies, government initiatives promoting technology adoption.
- Cloud-Based Segment Dominance: Scalability, flexibility, cost-effectiveness, and ease of management compared to on-premises solutions.
Database Market Product Analysis
The Database Market encompasses a wide range of products, including relational databases, NoSQL databases, cloud-based databases, and in-memory databases. Recent innovations focus on enhanced scalability, performance, security, and integration with other technologies like AI/ML. The competitive advantages lie in offering superior performance, ease of use, and integration capabilities, catering to specific industry needs and technological preferences.
Key Drivers, Barriers & Challenges in Database Market
Key Drivers: The proliferation of big data, the need for real-time analytics, increasing cloud adoption, and government initiatives promoting digital transformation. Examples include the expansion of 5G networks, boosting data generation, and growing investment in AI/ML, driving demand for advanced database solutions.
Challenges: Data security concerns, the complexity of managing and integrating diverse data sources, vendor lock-in, and the high cost of implementing and maintaining sophisticated database systems. Regulatory changes also present compliance challenges for organizations. Supply chain disruptions related to semiconductor manufacturing can impact product availability and pricing.
Growth Drivers in the Database Market Market
The rising adoption of cloud computing, the expanding need for real-time analytics, and the growth of big data are significant growth drivers. Furthermore, government initiatives supporting digital transformation and investments in AI/ML are further accelerating market expansion.
Challenges Impacting Database Market Growth
Data security and privacy concerns are major challenges. Also, the complexity of managing diverse data sources and the high costs associated with advanced database implementation and maintenance pose considerable hurdles. Supply chain vulnerabilities, impacting hardware availability and pricing, are also a significant impediment to growth.
Key Players Shaping the Database Market Market
- MongoDB Atlas
- Mark Logic
- Redis Labs Inc
- Altibase Corp
- Datastax Inc
- InterSystems Corporation
- MariaDB
- McObject LLC
- Aerospike Inc
- Teradata Corporation
- Microsoft Corporation
- Amazon Inc
- Google LLC
- *List Not Exhaustive
Significant Database Market Industry Milestones
- November 2023: VMware, Inc. and Google Cloud announced an expanded partnership to deliver Google Cloud’s AlloyDB Omni database on VMware Cloud Foundation, enhancing hybrid cloud database solutions.
- January 2024: Microsoft and Oracle announced the general availability of Oracle Database@Azure, expanding the reach and accessibility of Oracle databases.
Future Outlook for Database Market Market
The Database Market is poised for continued strong growth, driven by technological advancements, increasing data volumes, and the rising demand for real-time analytics across diverse industries. Strategic opportunities exist for companies focusing on innovative solutions such as serverless databases, AI-powered database management, and improved data security measures. The market’s potential is substantial, with a projected xx Million value by 2033, offering promising prospects for established players and new entrants alike.
Database Market Segmentation
-
1. Deployment
- 1.1. Cloud
- 1.2. On-Premsies
-
2. Enterprise
- 2.1. SMEs
- 2.2. Large Enterprises
-
3. End-user Vertical
- 3.1. BFSI
- 3.2. Retail and E-commerce
- 3.3. Logistics and Transportation
- 3.4. Media and Entertainment
- 3.5. Healthcare
- 3.6. IT and Telecom
- 3.7. Other End-user Verticals
Database Market Segmentation By Geography
-
1. North America
- 1.1. United States
- 1.2. Canada
-
2. Europe
- 2.1. United Kingdom
- 2.2. Germany
- 2.3. France
-
3. Asia
- 3.1. China
- 3.2. Japan
- 3.3. India
- 3.4. South Korea
- 4. Australia and New Zealand
-
5. Latin America
- 5.1. Brazil
- 5.2. Mexico
- 5.3. Argentina
-
6. Middle East and Africa
- 6.1. United Arab Emirates
- 6.2. Saudi Arabia
- 6.3. South Africa
Database Market REPORT HIGHLIGHTS
| Aspects | Details |
|---|---|
| Study Period | 2019-2033 |
| Base Year | 2024 |
| Estimated Year | 2025 |
| Forecast Period | 2025-2033 |
| Historical Period | 2019-2024 |
| Growth Rate | CAGR of 14.21% from 2019-2033 |
| Segmentation |
|
Table of Contents
- 1. Introduction
- 1.1. Research Scope
- 1.2. Market Segmentation
- 1.3. Research Methodology
- 1.4. Definitions and Assumptions
- 2. Executive Summary
- 2.1. Introduction
- 3. Market Dynamics
- 3.1. Introduction
- 3.2. Market Drivers
- 3.2.1. Increasing Penetration Of Trends Like Big Data And IoT; Increase In The Volume Of Data Generated And Shift Of Enterprise Operations
- 3.3. Market Restrains
- 3.3.1. Increasing Penetration Of Trends Like Big Data And IoT; Increase In The Volume Of Data Generated And Shift Of Enterprise Operations
- 3.4. Market Trends
- 3.4.1. Retail and E-commerce to Hold Significant Share
- 4. Market Factor Analysis
- 4.1. Porters Five Forces
- 4.2. Supply/Value Chain
- 4.3. PESTEL analysis
- 4.4. Market Entropy
- 4.5. Patent/Trademark Analysis
- 5. Global Database Market Analysis, Insights and Forecast, 2019-2031
- 5.1. Market Analysis, Insights and Forecast - by Deployment
- 5.1.1. Cloud
- 5.1.2. On-Premsies
- 5.2. Market Analysis, Insights and Forecast - by Enterprise
- 5.2.1. SMEs
- 5.2.2. Large Enterprises
- 5.3. Market Analysis, Insights and Forecast - by End-user Vertical
- 5.3.1. BFSI
- 5.3.2. Retail and E-commerce
- 5.3.3. Logistics and Transportation
- 5.3.4. Media and Entertainment
- 5.3.5. Healthcare
- 5.3.6. IT and Telecom
- 5.3.7. Other End-user Verticals
- 5.4. Market Analysis, Insights and Forecast - by Region
- 5.4.1. North America
- 5.4.2. Europe
- 5.4.3. Asia
- 5.4.4. Australia and New Zealand
- 5.4.5. Latin America
- 5.4.6. Middle East and Africa
- 5.1. Market Analysis, Insights and Forecast - by Deployment
- 6. North America Database Market Analysis, Insights and Forecast, 2019-2031
- 6.1. Market Analysis, Insights and Forecast - by Deployment
- 6.1.1. Cloud
- 6.1.2. On-Premsies
- 6.2. Market Analysis, Insights and Forecast - by Enterprise
- 6.2.1. SMEs
- 6.2.2. Large Enterprises
- 6.3. Market Analysis, Insights and Forecast - by End-user Vertical
- 6.3.1. BFSI
- 6.3.2. Retail and E-commerce
- 6.3.3. Logistics and Transportation
- 6.3.4. Media and Entertainment
- 6.3.5. Healthcare
- 6.3.6. IT and Telecom
- 6.3.7. Other End-user Verticals
- 6.1. Market Analysis, Insights and Forecast - by Deployment
- 7. Europe Database Market Analysis, Insights and Forecast, 2019-2031
- 7.1. Market Analysis, Insights and Forecast - by Deployment
- 7.1.1. Cloud
- 7.1.2. On-Premsies
- 7.2. Market Analysis, Insights and Forecast - by Enterprise
- 7.2.1. SMEs
- 7.2.2. Large Enterprises
- 7.3. Market Analysis, Insights and Forecast - by End-user Vertical
- 7.3.1. BFSI
- 7.3.2. Retail and E-commerce
- 7.3.3. Logistics and Transportation
- 7.3.4. Media and Entertainment
- 7.3.5. Healthcare
- 7.3.6. IT and Telecom
- 7.3.7. Other End-user Verticals
- 7.1. Market Analysis, Insights and Forecast - by Deployment
- 8. Asia Database Market Analysis, Insights and Forecast, 2019-2031
- 8.1. Market Analysis, Insights and Forecast - by Deployment
- 8.1.1. Cloud
- 8.1.2. On-Premsies
- 8.2. Market Analysis, Insights and Forecast - by Enterprise
- 8.2.1. SMEs
- 8.2.2. Large Enterprises
- 8.3. Market Analysis, Insights and Forecast - by End-user Vertical
- 8.3.1. BFSI
- 8.3.2. Retail and E-commerce
- 8.3.3. Logistics and Transportation
- 8.3.4. Media and Entertainment
- 8.3.5. Healthcare
- 8.3.6. IT and Telecom
- 8.3.7. Other End-user Verticals
- 8.1. Market Analysis, Insights and Forecast - by Deployment
- 9. Australia and New Zealand Database Market Analysis, Insights and Forecast, 2019-2031
- 9.1. Market Analysis, Insights and Forecast - by Deployment
- 9.1.1. Cloud
- 9.1.2. On-Premsies
- 9.2. Market Analysis, Insights and Forecast - by Enterprise
- 9.2.1. SMEs
- 9.2.2. Large Enterprises
- 9.3. Market Analysis, Insights and Forecast - by End-user Vertical
- 9.3.1. BFSI
- 9.3.2. Retail and E-commerce
- 9.3.3. Logistics and Transportation
- 9.3.4. Media and Entertainment
- 9.3.5. Healthcare
- 9.3.6. IT and Telecom
- 9.3.7. Other End-user Verticals
- 9.1. Market Analysis, Insights and Forecast - by Deployment
- 10. Latin America Database Market Analysis, Insights and Forecast, 2019-2031
- 10.1. Market Analysis, Insights and Forecast - by Deployment
- 10.1.1. Cloud
- 10.1.2. On-Premsies
- 10.2. Market Analysis, Insights and Forecast - by Enterprise
- 10.2.1. SMEs
- 10.2.2. Large Enterprises
- 10.3. Market Analysis, Insights and Forecast - by End-user Vertical
- 10.3.1. BFSI
- 10.3.2. Retail and E-commerce
- 10.3.3. Logistics and Transportation
- 10.3.4. Media and Entertainment
- 10.3.5. Healthcare
- 10.3.6. IT and Telecom
- 10.3.7. Other End-user Verticals
- 10.1. Market Analysis, Insights and Forecast - by Deployment
- 11. Middle East and Africa Database Market Analysis, Insights and Forecast, 2019-2031
- 11.1. Market Analysis, Insights and Forecast - by Deployment
- 11.1.1. Cloud
- 11.1.2. On-Premsies
- 11.2. Market Analysis, Insights and Forecast - by Enterprise
- 11.2.1. SMEs
- 11.2.2. Large Enterprises
- 11.3. Market Analysis, Insights and Forecast - by End-user Vertical
- 11.3.1. BFSI
- 11.3.2. Retail and E-commerce
- 11.3.3. Logistics and Transportation
- 11.3.4. Media and Entertainment
- 11.3.5. Healthcare
- 11.3.6. IT and Telecom
- 11.3.7. Other End-user Verticals
- 11.1. Market Analysis, Insights and Forecast - by Deployment
- 12. Competitive Analysis
- 12.1. Global Market Share Analysis 2024
- 12.2. Company Profiles
- 12.2.1 MongoDB Atlas
- 12.2.1.1. Overview
- 12.2.1.2. Products
- 12.2.1.3. SWOT Analysis
- 12.2.1.4. Recent Developments
- 12.2.1.5. Financials (Based on Availability)
- 12.2.2 Mark Logic
- 12.2.2.1. Overview
- 12.2.2.2. Products
- 12.2.2.3. SWOT Analysis
- 12.2.2.4. Recent Developments
- 12.2.2.5. Financials (Based on Availability)
- 12.2.3 Redis Labs Inc
- 12.2.3.1. Overview
- 12.2.3.2. Products
- 12.2.3.3. SWOT Analysis
- 12.2.3.4. Recent Developments
- 12.2.3.5. Financials (Based on Availability)
- 12.2.4 Altibase Corp
- 12.2.4.1. Overview
- 12.2.4.2. Products
- 12.2.4.3. SWOT Analysis
- 12.2.4.4. Recent Developments
- 12.2.4.5. Financials (Based on Availability)
- 12.2.5 Datastax Inc
- 12.2.5.1. Overview
- 12.2.5.2. Products
- 12.2.5.3. SWOT Analysis
- 12.2.5.4. Recent Developments
- 12.2.5.5. Financials (Based on Availability)
- 12.2.6 InterSystems Corporation
- 12.2.6.1. Overview
- 12.2.6.2. Products
- 12.2.6.3. SWOT Analysis
- 12.2.6.4. Recent Developments
- 12.2.6.5. Financials (Based on Availability)
- 12.2.7 MariaDB
- 12.2.7.1. Overview
- 12.2.7.2. Products
- 12.2.7.3. SWOT Analysis
- 12.2.7.4. Recent Developments
- 12.2.7.5. Financials (Based on Availability)
- 12.2.8 McObject LLC
- 12.2.8.1. Overview
- 12.2.8.2. Products
- 12.2.8.3. SWOT Analysis
- 12.2.8.4. Recent Developments
- 12.2.8.5. Financials (Based on Availability)
- 12.2.9 Aerospike Inc
- 12.2.9.1. Overview
- 12.2.9.2. Products
- 12.2.9.3. SWOT Analysis
- 12.2.9.4. Recent Developments
- 12.2.9.5. Financials (Based on Availability)
- 12.2.10 Teradata Corporation
- 12.2.10.1. Overview
- 12.2.10.2. Products
- 12.2.10.3. SWOT Analysis
- 12.2.10.4. Recent Developments
- 12.2.10.5. Financials (Based on Availability)
- 12.2.11 Microsoft Corporation
- 12.2.11.1. Overview
- 12.2.11.2. Products
- 12.2.11.3. SWOT Analysis
- 12.2.11.4. Recent Developments
- 12.2.11.5. Financials (Based on Availability)
- 12.2.12 Amazon Inc
- 12.2.12.1. Overview
- 12.2.12.2. Products
- 12.2.12.3. SWOT Analysis
- 12.2.12.4. Recent Developments
- 12.2.12.5. Financials (Based on Availability)
- 12.2.13 Google LLC*List Not Exhaustive
- 12.2.13.1. Overview
- 12.2.13.2. Products
- 12.2.13.3. SWOT Analysis
- 12.2.13.4. Recent Developments
- 12.2.13.5. Financials (Based on Availability)
- 12.2.1 MongoDB Atlas
List of Figures
- Figure 1: Global Database Market Revenue Breakdown (Million, %) by Region 2024 & 2032
- Figure 2: Global Database Market Volume Breakdown (Billion, %) by Region 2024 & 2032
- Figure 3: North America Database Market Revenue (Million), by Deployment 2024 & 2032
- Figure 4: North America Database Market Volume (Billion), by Deployment 2024 & 2032
- Figure 5: North America Database Market Revenue Share (%), by Deployment 2024 & 2032
- Figure 6: North America Database Market Volume Share (%), by Deployment 2024 & 2032
- Figure 7: North America Database Market Revenue (Million), by Enterprise 2024 & 2032
- Figure 8: North America Database Market Volume (Billion), by Enterprise 2024 & 2032
- Figure 9: North America Database Market Revenue Share (%), by Enterprise 2024 & 2032
- Figure 10: North America Database Market Volume Share (%), by Enterprise 2024 & 2032
- Figure 11: North America Database Market Revenue (Million), by End-user Vertical 2024 & 2032
- Figure 12: North America Database Market Volume (Billion), by End-user Vertical 2024 & 2032
- Figure 13: North America Database Market Revenue Share (%), by End-user Vertical 2024 & 2032
- Figure 14: North America Database Market Volume Share (%), by End-user Vertical 2024 & 2032
- Figure 15: North America Database Market Revenue (Million), by Country 2024 & 2032
- Figure 16: North America Database Market Volume (Billion), by Country 2024 & 2032
- Figure 17: North America Database Market Revenue Share (%), by Country 2024 & 2032
- Figure 18: North America Database Market Volume Share (%), by Country 2024 & 2032
- Figure 19: Europe Database Market Revenue (Million), by Deployment 2024 & 2032
- Figure 20: Europe Database Market Volume (Billion), by Deployment 2024 & 2032
- Figure 21: Europe Database Market Revenue Share (%), by Deployment 2024 & 2032
- Figure 22: Europe Database Market Volume Share (%), by Deployment 2024 & 2032
- Figure 23: Europe Database Market Revenue (Million), by Enterprise 2024 & 2032
- Figure 24: Europe Database Market Volume (Billion), by Enterprise 2024 & 2032
- Figure 25: Europe Database Market Revenue Share (%), by Enterprise 2024 & 2032
- Figure 26: Europe Database Market Volume Share (%), by Enterprise 2024 & 2032
- Figure 27: Europe Database Market Revenue (Million), by End-user Vertical 2024 & 2032
- Figure 28: Europe Database Market Volume (Billion), by End-user Vertical 2024 & 2032
- Figure 29: Europe Database Market Revenue Share (%), by End-user Vertical 2024 & 2032
- Figure 30: Europe Database Market Volume Share (%), by End-user Vertical 2024 & 2032
- Figure 31: Europe Database Market Revenue (Million), by Country 2024 & 2032
- Figure 32: Europe Database Market Volume (Billion), by Country 2024 & 2032
- Figure 33: Europe Database Market Revenue Share (%), by Country 2024 & 2032
- Figure 34: Europe Database Market Volume Share (%), by Country 2024 & 2032
- Figure 35: Asia Database Market Revenue (Million), by Deployment 2024 & 2032
- Figure 36: Asia Database Market Volume (Billion), by Deployment 2024 & 2032
- Figure 37: Asia Database Market Revenue Share (%), by Deployment 2024 & 2032
- Figure 38: Asia Database Market Volume Share (%), by Deployment 2024 & 2032
- Figure 39: Asia Database Market Revenue (Million), by Enterprise 2024 & 2032
- Figure 40: Asia Database Market Volume (Billion), by Enterprise 2024 & 2032
- Figure 41: Asia Database Market Revenue Share (%), by Enterprise 2024 & 2032
- Figure 42: Asia Database Market Volume Share (%), by Enterprise 2024 & 2032
- Figure 43: Asia Database Market Revenue (Million), by End-user Vertical 2024 & 2032
- Figure 44: Asia Database Market Volume (Billion), by End-user Vertical 2024 & 2032
- Figure 45: Asia Database Market Revenue Share (%), by End-user Vertical 2024 & 2032
- Figure 46: Asia Database Market Volume Share (%), by End-user Vertical 2024 & 2032
- Figure 47: Asia Database Market Revenue (Million), by Country 2024 & 2032
- Figure 48: Asia Database Market Volume (Billion), by Country 2024 & 2032
- Figure 49: Asia Database Market Revenue Share (%), by Country 2024 & 2032
- Figure 50: Asia Database Market Volume Share (%), by Country 2024 & 2032
- Figure 51: Australia and New Zealand Database Market Revenue (Million), by Deployment 2024 & 2032
- Figure 52: Australia and New Zealand Database Market Volume (Billion), by Deployment 2024 & 2032
- Figure 53: Australia and New Zealand Database Market Revenue Share (%), by Deployment 2024 & 2032
- Figure 54: Australia and New Zealand Database Market Volume Share (%), by Deployment 2024 & 2032
- Figure 55: Australia and New Zealand Database Market Revenue (Million), by Enterprise 2024 & 2032
- Figure 56: Australia and New Zealand Database Market Volume (Billion), by Enterprise 2024 & 2032
- Figure 57: Australia and New Zealand Database Market Revenue Share (%), by Enterprise 2024 & 2032
- Figure 58: Australia and New Zealand Database Market Volume Share (%), by Enterprise 2024 & 2032
- Figure 59: Australia and New Zealand Database Market Revenue (Million), by End-user Vertical 2024 & 2032
- Figure 60: Australia and New Zealand Database Market Volume (Billion), by End-user Vertical 2024 & 2032
- Figure 61: Australia and New Zealand Database Market Revenue Share (%), by End-user Vertical 2024 & 2032
- Figure 62: Australia and New Zealand Database Market Volume Share (%), by End-user Vertical 2024 & 2032
- Figure 63: Australia and New Zealand Database Market Revenue (Million), by Country 2024 & 2032
- Figure 64: Australia and New Zealand Database Market Volume (Billion), by Country 2024 & 2032
- Figure 65: Australia and New Zealand Database Market Revenue Share (%), by Country 2024 & 2032
- Figure 66: Australia and New Zealand Database Market Volume Share (%), by Country 2024 & 2032
- Figure 67: Latin America Database Market Revenue (Million), by Deployment 2024 & 2032
- Figure 68: Latin America Database Market Volume (Billion), by Deployment 2024 & 2032
- Figure 69: Latin America Database Market Revenue Share (%), by Deployment 2024 & 2032
- Figure 70: Latin America Database Market Volume Share (%), by Deployment 2024 & 2032
- Figure 71: Latin America Database Market Revenue (Million), by Enterprise 2024 & 2032
- Figure 72: Latin America Database Market Volume (Billion), by Enterprise 2024 & 2032
- Figure 73: Latin America Database Market Revenue Share (%), by Enterprise 2024 & 2032
- Figure 74: Latin America Database Market Volume Share (%), by Enterprise 2024 & 2032
- Figure 75: Latin America Database Market Revenue (Million), by End-user Vertical 2024 & 2032
- Figure 76: Latin America Database Market Volume (Billion), by End-user Vertical 2024 & 2032
- Figure 77: Latin America Database Market Revenue Share (%), by End-user Vertical 2024 & 2032
- Figure 78: Latin America Database Market Volume Share (%), by End-user Vertical 2024 & 2032
- Figure 79: Latin America Database Market Revenue (Million), by Country 2024 & 2032
- Figure 80: Latin America Database Market Volume (Billion), by Country 2024 & 2032
- Figure 81: Latin America Database Market Revenue Share (%), by Country 2024 & 2032
- Figure 82: Latin America Database Market Volume Share (%), by Country 2024 & 2032
- Figure 83: Middle East and Africa Database Market Revenue (Million), by Deployment 2024 & 2032
- Figure 84: Middle East and Africa Database Market Volume (Billion), by Deployment 2024 & 2032
- Figure 85: Middle East and Africa Database Market Revenue Share (%), by Deployment 2024 & 2032
- Figure 86: Middle East and Africa Database Market Volume Share (%), by Deployment 2024 & 2032
- Figure 87: Middle East and Africa Database Market Revenue (Million), by Enterprise 2024 & 2032
- Figure 88: Middle East and Africa Database Market Volume (Billion), by Enterprise 2024 & 2032
- Figure 89: Middle East and Africa Database Market Revenue Share (%), by Enterprise 2024 & 2032
- Figure 90: Middle East and Africa Database Market Volume Share (%), by Enterprise 2024 & 2032
- Figure 91: Middle East and Africa Database Market Revenue (Million), by End-user Vertical 2024 & 2032
- Figure 92: Middle East and Africa Database Market Volume (Billion), by End-user Vertical 2024 & 2032
- Figure 93: Middle East and Africa Database Market Revenue Share (%), by End-user Vertical 2024 & 2032
- Figure 94: Middle East and Africa Database Market Volume Share (%), by End-user Vertical 2024 & 2032
- Figure 95: Middle East and Africa Database Market Revenue (Million), by Country 2024 & 2032
- Figure 96: Middle East and Africa Database Market Volume (Billion), by Country 2024 & 2032
- Figure 97: Middle East and Africa Database Market Revenue Share (%), by Country 2024 & 2032
- Figure 98: Middle East and Africa Database Market Volume Share (%), by Country 2024 & 2032
List of Tables
- Table 1: Global Database Market Revenue Million Forecast, by Region 2019 & 2032
- Table 2: Global Database Market Volume Billion Forecast, by Region 2019 & 2032
- Table 3: Global Database Market Revenue Million Forecast, by Deployment 2019 & 2032
- Table 4: Global Database Market Volume Billion Forecast, by Deployment 2019 & 2032
- Table 5: Global Database Market Revenue Million Forecast, by Enterprise 2019 & 2032
- Table 6: Global Database Market Volume Billion Forecast, by Enterprise 2019 & 2032
- Table 7: Global Database Market Revenue Million Forecast, by End-user Vertical 2019 & 2032
- Table 8: Global Database Market Volume Billion Forecast, by End-user Vertical 2019 & 2032
- Table 9: Global Database Market Revenue Million Forecast, by Region 2019 & 2032
- Table 10: Global Database Market Volume Billion Forecast, by Region 2019 & 2032
- Table 11: Global Database Market Revenue Million Forecast, by Deployment 2019 & 2032
- Table 12: Global Database Market Volume Billion Forecast, by Deployment 2019 & 2032
- Table 13: Global Database Market Revenue Million Forecast, by Enterprise 2019 & 2032
- Table 14: Global Database Market Volume Billion Forecast, by Enterprise 2019 & 2032
- Table 15: Global Database Market Revenue Million Forecast, by End-user Vertical 2019 & 2032
- Table 16: Global Database Market Volume Billion Forecast, by End-user Vertical 2019 & 2032
- Table 17: Global Database Market Revenue Million Forecast, by Country 2019 & 2032
- Table 18: Global Database Market Volume Billion Forecast, by Country 2019 & 2032
- Table 19: United States Database Market Revenue (Million) Forecast, by Application 2019 & 2032
- Table 20: United States Database Market Volume (Billion) Forecast, by Application 2019 & 2032
- Table 21: Canada Database Market Revenue (Million) Forecast, by Application 2019 & 2032
- Table 22: Canada Database Market Volume (Billion) Forecast, by Application 2019 & 2032
- Table 23: Global Database Market Revenue Million Forecast, by Deployment 2019 & 2032
- Table 24: Global Database Market Volume Billion Forecast, by Deployment 2019 & 2032
- Table 25: Global Database Market Revenue Million Forecast, by Enterprise 2019 & 2032
- Table 26: Global Database Market Volume Billion Forecast, by Enterprise 2019 & 2032
- Table 27: Global Database Market Revenue Million Forecast, by End-user Vertical 2019 & 2032
- Table 28: Global Database Market Volume Billion Forecast, by End-user Vertical 2019 & 2032
- Table 29: Global Database Market Revenue Million Forecast, by Country 2019 & 2032
- Table 30: Global Database Market Volume Billion Forecast, by Country 2019 & 2032
- Table 31: United Kingdom Database Market Revenue (Million) Forecast, by Application 2019 & 2032
- Table 32: United Kingdom Database Market Volume (Billion) Forecast, by Application 2019 & 2032
- Table 33: Germany Database Market Revenue (Million) Forecast, by Application 2019 & 2032
- Table 34: Germany Database Market Volume (Billion) Forecast, by Application 2019 & 2032
- Table 35: France Database Market Revenue (Million) Forecast, by Application 2019 & 2032
- Table 36: France Database Market Volume (Billion) Forecast, by Application 2019 & 2032
- Table 37: Global Database Market Revenue Million Forecast, by Deployment 2019 & 2032
- Table 38: Global Database Market Volume Billion Forecast, by Deployment 2019 & 2032
- Table 39: Global Database Market Revenue Million Forecast, by Enterprise 2019 & 2032
- Table 40: Global Database Market Volume Billion Forecast, by Enterprise 2019 & 2032
- Table 41: Global Database Market Revenue Million Forecast, by End-user Vertical 2019 & 2032
- Table 42: Global Database Market Volume Billion Forecast, by End-user Vertical 2019 & 2032
- Table 43: Global Database Market Revenue Million Forecast, by Country 2019 & 2032
- Table 44: Global Database Market Volume Billion Forecast, by Country 2019 & 2032
- Table 45: China Database Market Revenue (Million) Forecast, by Application 2019 & 2032
- Table 46: China Database Market Volume (Billion) Forecast, by Application 2019 & 2032
- Table 47: Japan Database Market Revenue (Million) Forecast, by Application 2019 & 2032
- Table 48: Japan Database Market Volume (Billion) Forecast, by Application 2019 & 2032
- Table 49: India Database Market Revenue (Million) Forecast, by Application 2019 & 2032
- Table 50: India Database Market Volume (Billion) Forecast, by Application 2019 & 2032
- Table 51: South Korea Database Market Revenue (Million) Forecast, by Application 2019 & 2032
- Table 52: South Korea Database Market Volume (Billion) Forecast, by Application 2019 & 2032
- Table 53: Global Database Market Revenue Million Forecast, by Deployment 2019 & 2032
- Table 54: Global Database Market Volume Billion Forecast, by Deployment 2019 & 2032
- Table 55: Global Database Market Revenue Million Forecast, by Enterprise 2019 & 2032
- Table 56: Global Database Market Volume Billion Forecast, by Enterprise 2019 & 2032
- Table 57: Global Database Market Revenue Million Forecast, by End-user Vertical 2019 & 2032
- Table 58: Global Database Market Volume Billion Forecast, by End-user Vertical 2019 & 2032
- Table 59: Global Database Market Revenue Million Forecast, by Country 2019 & 2032
- Table 60: Global Database Market Volume Billion Forecast, by Country 2019 & 2032
- Table 61: Global Database Market Revenue Million Forecast, by Deployment 2019 & 2032
- Table 62: Global Database Market Volume Billion Forecast, by Deployment 2019 & 2032
- Table 63: Global Database Market Revenue Million Forecast, by Enterprise 2019 & 2032
- Table 64: Global Database Market Volume Billion Forecast, by Enterprise 2019 & 2032
- Table 65: Global Database Market Revenue Million Forecast, by End-user Vertical 2019 & 2032
- Table 66: Global Database Market Volume Billion Forecast, by End-user Vertical 2019 & 2032
- Table 67: Global Database Market Revenue Million Forecast, by Country 2019 & 2032
- Table 68: Global Database Market Volume Billion Forecast, by Country 2019 & 2032
- Table 69: Brazil Database Market Revenue (Million) Forecast, by Application 2019 & 2032
- Table 70: Brazil Database Market Volume (Billion) Forecast, by Application 2019 & 2032
- Table 71: Mexico Database Market Revenue (Million) Forecast, by Application 2019 & 2032
- Table 72: Mexico Database Market Volume (Billion) Forecast, by Application 2019 & 2032
- Table 73: Argentina Database Market Revenue (Million) Forecast, by Application 2019 & 2032
- Table 74: Argentina Database Market Volume (Billion) Forecast, by Application 2019 & 2032
- Table 75: Global Database Market Revenue Million Forecast, by Deployment 2019 & 2032
- Table 76: Global Database Market Volume Billion Forecast, by Deployment 2019 & 2032
- Table 77: Global Database Market Revenue Million Forecast, by Enterprise 2019 & 2032
- Table 78: Global Database Market Volume Billion Forecast, by Enterprise 2019 & 2032
- Table 79: Global Database Market Revenue Million Forecast, by End-user Vertical 2019 & 2032
- Table 80: Global Database Market Volume Billion Forecast, by End-user Vertical 2019 & 2032
- Table 81: Global Database Market Revenue Million Forecast, by Country 2019 & 2032
- Table 82: Global Database Market Volume Billion Forecast, by Country 2019 & 2032
- Table 83: United Arab Emirates Database Market Revenue (Million) Forecast, by Application 2019 & 2032
- Table 84: United Arab Emirates Database Market Volume (Billion) Forecast, by Application 2019 & 2032
- Table 85: Saudi Arabia Database Market Revenue (Million) Forecast, by Application 2019 & 2032
- Table 86: Saudi Arabia Database Market Volume (Billion) Forecast, by Application 2019 & 2032
- Table 87: South Africa Database Market Revenue (Million) Forecast, by Application 2019 & 2032
- Table 88: South Africa Database Market Volume (Billion) Forecast, by Application 2019 & 2032
Frequently Asked Questions
1. What is the projected Compound Annual Growth Rate (CAGR) of the Database Market?
The projected CAGR is approximately 14.21%.
2. Which companies are prominent players in the Database Market?
Key companies in the market include MongoDB Atlas, Mark Logic, Redis Labs Inc, Altibase Corp, Datastax Inc, InterSystems Corporation, MariaDB, McObject LLC, Aerospike Inc, Teradata Corporation, Microsoft Corporation, Amazon Inc, Google LLC*List Not Exhaustive.
3. What are the main segments of the Database Market?
The market segments include Deployment, Enterprise, End-user Vertical.
4. Can you provide details about the market size?
The market size is estimated to be USD 131.67 Million as of 2022.
5. What are some drivers contributing to market growth?
Increasing Penetration Of Trends Like Big Data And IoT; Increase In The Volume Of Data Generated And Shift Of Enterprise Operations.
6. What are the notable trends driving market growth?
Retail and E-commerce to Hold Significant Share.
7. Are there any restraints impacting market growth?
Increasing Penetration Of Trends Like Big Data And IoT; Increase In The Volume Of Data Generated And Shift Of Enterprise Operations.
8. Can you provide examples of recent developments in the market?
January 2024: Microsoft and Oracle recently announced the general availability of Oracle Database@Azure, allowing Azure customers to procure, deploy, and use Oracle Database@Azure with the Azure portal and APIs.November 2023: VMware, Inc. and Google Cloud announced an expanded partnership to deliver Google Cloud’s AlloyDB Omni database on VMware Cloud Foundation, starting with on-premises private clouds.
9. What pricing options are available for accessing the report?
Pricing options include single-user, multi-user, and enterprise licenses priced at USD 4750, USD 5250, and USD 8750 respectively.
10. Is the market size provided in terms of value or volume?
The market size is provided in terms of value, measured in Million and volume, measured in Billion.
11. Are there any specific market keywords associated with the report?
Yes, the market keyword associated with the report is "Database Market," which aids in identifying and referencing the specific market segment covered.
12. How do I determine which pricing option suits my needs best?
The pricing options vary based on user requirements and access needs. Individual users may opt for single-user licenses, while businesses requiring broader access may choose multi-user or enterprise licenses for cost-effective access to the report.
13. Are there any additional resources or data provided in the Database Market report?
While the report offers comprehensive insights, it's advisable to review the specific contents or supplementary materials provided to ascertain if additional resources or data are available.
14. How can I stay updated on further developments or reports in the Database Market?
To stay informed about further developments, trends, and reports in the Database Market, consider subscribing to industry newsletters, following relevant companies and organizations, or regularly checking reputable industry news sources and publications.
Methodology
Step 1 - Identification of Relevant Samples Size from Population Database


Step 2 - Approaches for Defining Global Market Size (Value, Volume* & Price*)

Note*: In applicable scenarios
Step 3 - Data Sources
Primary Research
- Web Analytics
- Survey Reports
- Research Institute
- Latest Research Reports
- Opinion Leaders
Secondary Research
- Annual Reports
- White Paper
- Latest Press Release
- Industry Association
- Paid Database
- Investor Presentations

Step 4 - Data Triangulation
Involves using different sources of information in order to increase the validity of a study
These sources are likely to be stakeholders in a program - participants, other researchers, program staff, other community members, and so on.
Then we put all data in single framework & apply various statistical tools to find out the dynamic on the market.
During the analysis stage, feedback from the stakeholder groups would be compared to determine areas of agreement as well as areas of divergence
