

Key Insights
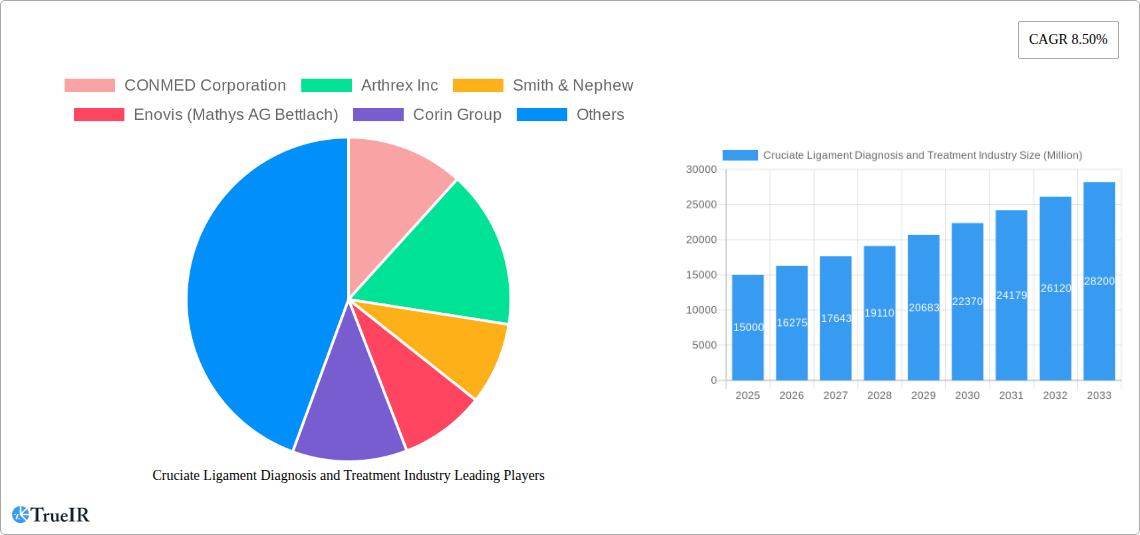
The global cruciate ligament diagnosis and treatment market is experiencing robust growth, projected to reach a significant size driven by several key factors. The rising incidence of sports injuries, particularly among young adults and athletes, is a primary driver. Advances in surgical techniques, including minimally invasive procedures like arthroscopic ACL and PCL repairs, are enhancing treatment outcomes and patient recovery times. This, coupled with the increasing adoption of advanced imaging technologies for accurate diagnosis (MRI, CT scans), fuels market expansion. The aging global population also contributes, as age-related ligament degeneration increases the need for treatment. Growth is further propelled by a growing awareness of the long-term consequences of untreated cruciate ligament injuries, leading to increased patient demand for timely interventions. The market is segmented by procedure type (ACL and PCL repair being dominant) and end-user (hospitals and ambulatory surgical centers holding significant shares). Competition among established players like Arthrex, Smith & Nephew, and Zimmer Biomet is intense, driving innovation in implants, surgical instruments, and rehabilitation solutions. While the market faces restraints such as high treatment costs and potential complications associated with surgery, the overall outlook remains optimistic due to the aforementioned growth drivers.
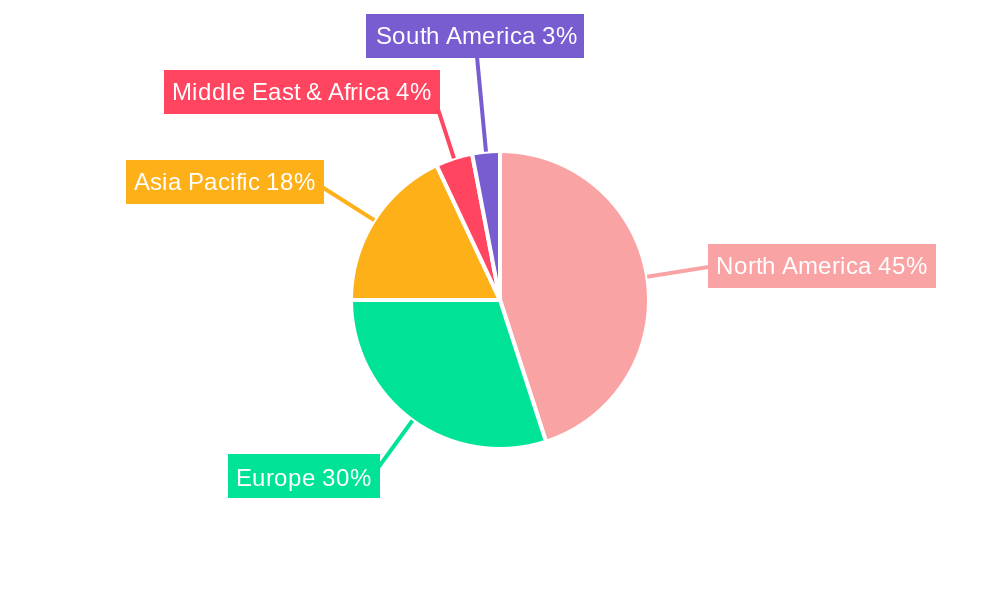
The geographical distribution of the market reflects the concentration of advanced medical facilities and higher healthcare expenditure. North America currently holds a substantial market share, followed by Europe, due to the prevalence of sports-related injuries and the availability of sophisticated medical infrastructure. The Asia-Pacific region shows strong growth potential, driven by increasing healthcare spending and a rising middle class with greater access to advanced medical care. Future market growth will depend on further technological advancements, the development of less invasive and more effective treatments, and expanding access to healthcare services in developing economies. Continued research and development focusing on regenerative medicine and tissue engineering also holds the potential to significantly impact the market landscape over the forecast period.
Cruciate Ligament Diagnosis and Treatment Industry Market Report: 2019-2033
This comprehensive report provides a detailed analysis of the Cruciate Ligament Diagnosis and Treatment industry, projecting a market valuation exceeding $XX Billion by 2033. The study period covers 2019-2033, with 2025 serving as the base and estimated year. The forecast period spans 2025-2033, and the historical period encompasses 2019-2024. This in-depth analysis covers market size, segmentation, competitive landscape, key players, and future growth prospects.
Cruciate Ligament Diagnosis and Treatment Industry Market Structure & Competitive Landscape
The cruciate ligament diagnosis and treatment market exhibits a moderately concentrated structure, with several major players holding significant market share. The Herfindahl-Hirschman Index (HHI) for 2025 is estimated at xx, indicating moderate concentration. Innovation is a key driver, with companies continuously developing improved surgical techniques, implants, and rehabilitation methods. Regulatory approvals, particularly for new medical devices, significantly influence market dynamics. The market faces competition from alternative treatments, including conservative management and physiotherapy.
End-user segmentation is primarily driven by:
- Hospitals: The largest segment, accounting for approximately 60% of the market.
- Ambulatory Surgical Centers: Growing at a faster rate than hospitals due to rising preference for cost-effective procedures.
- Other End Users: Includes clinics and rehabilitation centers.
M&A activity: The past five years have witnessed a moderate level of mergers and acquisitions, primarily focused on expanding product portfolios and geographical reach. The total value of M&A transactions between 2019 and 2024 is estimated at $XX Billion. Strategic partnerships and collaborations also contribute to shaping the competitive landscape. Key factors driving M&A activity include access to new technologies, improved distribution networks, and expansion into underserved markets.
Cruciate Ligament Diagnosis and Treatment Industry Market Trends & Opportunities
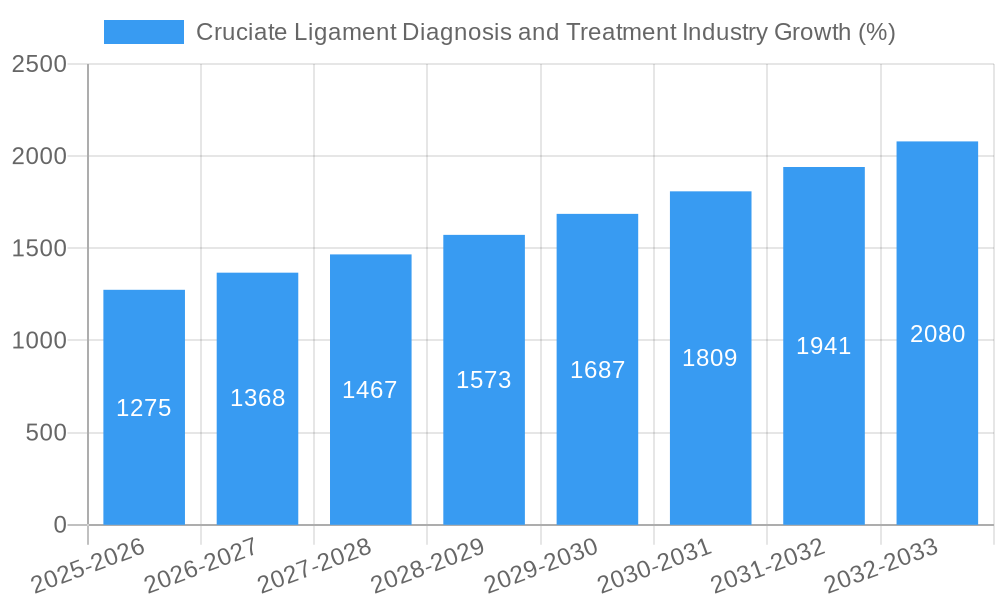
The global cruciate ligament diagnosis and treatment market is experiencing robust growth, driven by an aging population, rising incidence of sports injuries, and advancements in surgical techniques and implants. The market is projected to register a Compound Annual Growth Rate (CAGR) of xx% during the forecast period (2025-2033). Market penetration rates for minimally invasive procedures are steadily increasing. Technological advancements such as robotic surgery, improved imaging techniques, and the development of biocompatible implants are further propelling market growth. Consumer preferences are shifting toward less invasive procedures with faster recovery times, influencing product development and market competition. The increasing focus on personalized medicine is also shaping market trends, with customized treatment plans based on individual patient needs becoming more common.
Dominant Markets & Segments in Cruciate Ligament Diagnosis and Treatment Industry
The North American region currently holds the largest market share, followed by Europe and Asia-Pacific. Within the procedure segment, Anterior Cruciate Ligament (ACL) repair commands the largest share owing to higher incidence rates of ACL injuries compared to PCL injuries. Hospitals currently dominate the end-user segment, although ambulatory surgical centers are experiencing rapid growth due to increasing affordability and shorter hospital stays.
Key Growth Drivers:
- Increased prevalence of sports injuries: Rising participation in athletic activities is contributing to a higher incidence of cruciate ligament injuries.
- Technological advancements: Innovations in surgical techniques, implants, and rehabilitation protocols are improving treatment outcomes and patient satisfaction.
- Favorable reimbursement policies: Government initiatives and insurance coverage for cruciate ligament treatments enhance accessibility.
- Growing awareness and early diagnosis: Increased public awareness about the condition and advancements in diagnostic imaging technologies are facilitating early detection and timely intervention.
Cruciate Ligament Diagnosis and Treatment Industry Product Analysis
The market offers a diverse range of products, including surgical instruments, implants (e.g., ACL and PCL grafts, fixation devices), and rehabilitation aids. Technological advancements focus on minimally invasive techniques, improved biocompatibility of implants, and personalized treatment approaches. The competitive landscape is characterized by a focus on product differentiation through enhanced efficacy, reduced recovery times, and improved patient outcomes. The market also sees increasing demand for innovative technologies such as regenerative medicine and 3D-printed implants.
Key Drivers, Barriers & Challenges in Cruciate Ligament Diagnosis and Treatment Industry
Key Drivers:
The market is propelled by factors such as rising prevalence of sports injuries, an aging population susceptible to ligament degeneration, technological advancements driving improved treatment outcomes, and increasing healthcare spending globally.
Challenges:
High treatment costs, stringent regulatory requirements for new devices, and competition from alternative therapies such as conservative management and physiotherapy pose significant challenges. Supply chain disruptions can also impact the availability of implants and surgical instruments. These challenges can potentially slow down market growth, but the positive outlook driven by the drivers is expected to mitigate these impacts.
Growth Drivers in the Cruciate Ligament Diagnosis and Treatment Industry Market
Technological advancements in surgical techniques (minimally invasive), improved implant designs (biocompatibility, strength), and advanced imaging capabilities are major drivers. An increasing aging population and a rise in sports-related injuries are fueling demand. Favorable reimbursement policies in various regions further stimulate market growth.
Challenges Impacting Cruciate Ligament Diagnosis and Treatment Industry Growth
Regulatory hurdles for new medical device approvals, potential supply chain disruptions (affecting implant availability and costs), and intense competition among established players and new entrants are key obstacles. The high cost of treatment and the potential for complications also limit market penetration to some extent.
Key Players Shaping the Cruciate Ligament Diagnosis and Treatment Industry Market
- CONMED Corporation
- Arthrex Inc
- Smith & Nephew
- Enovis (Mathys AG Bettlach)
- Corin Group
- Exactech Inc
- Medtronic
- Miach Orthopaedics
- Bauerfeind
- Stryker
- Tissue Regenix
- Integra LifeSciences
- Zimmer Biomet
- RTI Surgical
- Johnson & Johnson Services Inc (DePuy Synthes)
Significant Cruciate Ligament Diagnosis and Treatment Industry Industry Milestones
- October 2022: Oregon Health & Science University Health utilizes the Bridge-Enhanced ACL Restoration (BEAR) implant, showcasing advancements in ACL repair techniques and highlighting the market's receptiveness to innovative solutions.
- January 2022: Symbios launches the ORIGIN CR Total Knee System, demonstrating progress in PCL-preserving knee replacement procedures and indicating a growing market for customized solutions.
Future Outlook for Cruciate Ligament Diagnosis and Treatment Industry Market
The market is poised for continued growth, fueled by technological innovation, increasing prevalence of cruciate ligament injuries, and expanding healthcare infrastructure globally. Strategic opportunities lie in developing minimally invasive procedures, personalized treatment approaches, and innovative implants with improved biocompatibility. The market's potential for expansion is significant, driven by ongoing advancements and increasing demand for effective cruciate ligament diagnosis and treatment solutions.
Cruciate Ligament Diagnosis and Treatment Industry Segmentation
-
1. Procedure
- 1.1. Anterior Cruciate Ligament (ACL) Repair
- 1.2. Posterior Cruciate Ligament (PCL) Repair
-
2. End User
- 2.1. Hospitals
- 2.2. Ambulatory Surgical Centers
- 2.3. Other End Users
Cruciate Ligament Diagnosis and Treatment Industry Segmentation By Geography
-
1. North America
- 1.1. United States
- 1.2. Canada
- 1.3. Mexico
-
2. Europe
- 2.1. Germany
- 2.2. United Kingdom
- 2.3. France
- 2.4. Italy
- 2.5. Spain
- 2.6. Rest of Europe
-
3. Asia acific
- 3.1. China
- 3.2. Japan
- 3.3. India
- 3.4. Australia
- 3.5. South Korea
- 3.6. Rest of Asia Pacific
-
4. Middle East and Africa
- 4.1. GCC
- 4.2. South Africa
- 4.3. Rest of Middle East and Africa
-
5. South America
- 5.1. Brazil
- 5.2. Argentina
- 5.3. Rest of South America
Cruciate Ligament Diagnosis and Treatment Industry REPORT HIGHLIGHTS
| Aspects | Details |
|---|---|
| Study Period | 2019-2033 |
| Base Year | 2024 |
| Estimated Year | 2025 |
| Forecast Period | 2025-2033 |
| Historical Period | 2019-2024 |
| Growth Rate | CAGR of 8.50% from 2019-2033 |
| Segmentation |
|
Table of Contents
- 1. Introduction
- 1.1. Research Scope
- 1.2. Market Segmentation
- 1.3. Research Methodology
- 1.4. Definitions and Assumptions
- 2. Executive Summary
- 2.1. Introduction
- 3. Market Dynamics
- 3.1. Introduction
- 3.2. Market Drivers
- 3.2.1. Increasing Demand for Minimally Invasive Procedures; Rising Incidence of Sports-related Injuries
- 3.3. Market Restrains
- 3.3.1. High Cost of Procedures
- 3.4. Market Trends
- 3.4.1. Anterior Cruciate Ligament (ACL) Repair Segment Expected to Grow Over the Forecast Period
- 4. Market Factor Analysis
- 4.1. Porters Five Forces
- 4.2. Supply/Value Chain
- 4.3. PESTEL analysis
- 4.4. Market Entropy
- 4.5. Patent/Trademark Analysis
- 5. Global Cruciate Ligament Diagnosis and Treatment Industry Analysis, Insights and Forecast, 2019-2031
- 5.1. Market Analysis, Insights and Forecast - by Procedure
- 5.1.1. Anterior Cruciate Ligament (ACL) Repair
- 5.1.2. Posterior Cruciate Ligament (PCL) Repair
- 5.2. Market Analysis, Insights and Forecast - by End User
- 5.2.1. Hospitals
- 5.2.2. Ambulatory Surgical Centers
- 5.2.3. Other End Users
- 5.3. Market Analysis, Insights and Forecast - by Region
- 5.3.1. North America
- 5.3.2. Europe
- 5.3.3. Asia acific
- 5.3.4. Middle East and Africa
- 5.3.5. South America
- 5.1. Market Analysis, Insights and Forecast - by Procedure
- 6. North America Cruciate Ligament Diagnosis and Treatment Industry Analysis, Insights and Forecast, 2019-2031
- 6.1. Market Analysis, Insights and Forecast - by Procedure
- 6.1.1. Anterior Cruciate Ligament (ACL) Repair
- 6.1.2. Posterior Cruciate Ligament (PCL) Repair
- 6.2. Market Analysis, Insights and Forecast - by End User
- 6.2.1. Hospitals
- 6.2.2. Ambulatory Surgical Centers
- 6.2.3. Other End Users
- 6.1. Market Analysis, Insights and Forecast - by Procedure
- 7. Europe Cruciate Ligament Diagnosis and Treatment Industry Analysis, Insights and Forecast, 2019-2031
- 7.1. Market Analysis, Insights and Forecast - by Procedure
- 7.1.1. Anterior Cruciate Ligament (ACL) Repair
- 7.1.2. Posterior Cruciate Ligament (PCL) Repair
- 7.2. Market Analysis, Insights and Forecast - by End User
- 7.2.1. Hospitals
- 7.2.2. Ambulatory Surgical Centers
- 7.2.3. Other End Users
- 7.1. Market Analysis, Insights and Forecast - by Procedure
- 8. Asia acific Cruciate Ligament Diagnosis and Treatment Industry Analysis, Insights and Forecast, 2019-2031
- 8.1. Market Analysis, Insights and Forecast - by Procedure
- 8.1.1. Anterior Cruciate Ligament (ACL) Repair
- 8.1.2. Posterior Cruciate Ligament (PCL) Repair
- 8.2. Market Analysis, Insights and Forecast - by End User
- 8.2.1. Hospitals
- 8.2.2. Ambulatory Surgical Centers
- 8.2.3. Other End Users
- 8.1. Market Analysis, Insights and Forecast - by Procedure
- 9. Middle East and Africa Cruciate Ligament Diagnosis and Treatment Industry Analysis, Insights and Forecast, 2019-2031
- 9.1. Market Analysis, Insights and Forecast - by Procedure
- 9.1.1. Anterior Cruciate Ligament (ACL) Repair
- 9.1.2. Posterior Cruciate Ligament (PCL) Repair
- 9.2. Market Analysis, Insights and Forecast - by End User
- 9.2.1. Hospitals
- 9.2.2. Ambulatory Surgical Centers
- 9.2.3. Other End Users
- 9.1. Market Analysis, Insights and Forecast - by Procedure
- 10. South America Cruciate Ligament Diagnosis and Treatment Industry Analysis, Insights and Forecast, 2019-2031
- 10.1. Market Analysis, Insights and Forecast - by Procedure
- 10.1.1. Anterior Cruciate Ligament (ACL) Repair
- 10.1.2. Posterior Cruciate Ligament (PCL) Repair
- 10.2. Market Analysis, Insights and Forecast - by End User
- 10.2.1. Hospitals
- 10.2.2. Ambulatory Surgical Centers
- 10.2.3. Other End Users
- 10.1. Market Analysis, Insights and Forecast - by Procedure
- 11. North America Cruciate Ligament Diagnosis and Treatment Industry Analysis, Insights and Forecast, 2019-2031
- 11.1. Market Analysis, Insights and Forecast - By Country/Sub-region
- 11.1.1 United States
- 11.1.2 Canada
- 11.1.3 Mexico
- 12. Europe Cruciate Ligament Diagnosis and Treatment Industry Analysis, Insights and Forecast, 2019-2031
- 12.1. Market Analysis, Insights and Forecast - By Country/Sub-region
- 12.1.1 Germany
- 12.1.2 United Kingdom
- 12.1.3 France
- 12.1.4 Italy
- 12.1.5 Spain
- 12.1.6 Rest of Europe
- 13. Asia acific Cruciate Ligament Diagnosis and Treatment Industry Analysis, Insights and Forecast, 2019-2031
- 13.1. Market Analysis, Insights and Forecast - By Country/Sub-region
- 13.1.1 China
- 13.1.2 Japan
- 13.1.3 India
- 13.1.4 Australia
- 13.1.5 South Korea
- 13.1.6 Rest of Asia Pacific
- 14. Middle East and Africa Cruciate Ligament Diagnosis and Treatment Industry Analysis, Insights and Forecast, 2019-2031
- 14.1. Market Analysis, Insights and Forecast - By Country/Sub-region
- 14.1.1 GCC
- 14.1.2 South Africa
- 14.1.3 Rest of Middle East and Africa
- 15. South America Cruciate Ligament Diagnosis and Treatment Industry Analysis, Insights and Forecast, 2019-2031
- 15.1. Market Analysis, Insights and Forecast - By Country/Sub-region
- 15.1.1 Brazil
- 15.1.2 Argentina
- 15.1.3 Rest of South America
- 16. Competitive Analysis
- 16.1. Global Market Share Analysis 2024
- 16.2. Company Profiles
- 16.2.1 CONMED Corporation
- 16.2.1.1. Overview
- 16.2.1.2. Products
- 16.2.1.3. SWOT Analysis
- 16.2.1.4. Recent Developments
- 16.2.1.5. Financials (Based on Availability)
- 16.2.2 Arthrex Inc
- 16.2.2.1. Overview
- 16.2.2.2. Products
- 16.2.2.3. SWOT Analysis
- 16.2.2.4. Recent Developments
- 16.2.2.5. Financials (Based on Availability)
- 16.2.3 Smith & Nephew
- 16.2.3.1. Overview
- 16.2.3.2. Products
- 16.2.3.3. SWOT Analysis
- 16.2.3.4. Recent Developments
- 16.2.3.5. Financials (Based on Availability)
- 16.2.4 Enovis (Mathys AG Bettlach)
- 16.2.4.1. Overview
- 16.2.4.2. Products
- 16.2.4.3. SWOT Analysis
- 16.2.4.4. Recent Developments
- 16.2.4.5. Financials (Based on Availability)
- 16.2.5 Corin Group
- 16.2.5.1. Overview
- 16.2.5.2. Products
- 16.2.5.3. SWOT Analysis
- 16.2.5.4. Recent Developments
- 16.2.5.5. Financials (Based on Availability)
- 16.2.6 Exactech Inc
- 16.2.6.1. Overview
- 16.2.6.2. Products
- 16.2.6.3. SWOT Analysis
- 16.2.6.4. Recent Developments
- 16.2.6.5. Financials (Based on Availability)
- 16.2.7 Medtronic
- 16.2.7.1. Overview
- 16.2.7.2. Products
- 16.2.7.3. SWOT Analysis
- 16.2.7.4. Recent Developments
- 16.2.7.5. Financials (Based on Availability)
- 16.2.8 Miach Orthopaedics
- 16.2.8.1. Overview
- 16.2.8.2. Products
- 16.2.8.3. SWOT Analysis
- 16.2.8.4. Recent Developments
- 16.2.8.5. Financials (Based on Availability)
- 16.2.9 Bauerfeind
- 16.2.9.1. Overview
- 16.2.9.2. Products
- 16.2.9.3. SWOT Analysis
- 16.2.9.4. Recent Developments
- 16.2.9.5. Financials (Based on Availability)
- 16.2.10 Stryker
- 16.2.10.1. Overview
- 16.2.10.2. Products
- 16.2.10.3. SWOT Analysis
- 16.2.10.4. Recent Developments
- 16.2.10.5. Financials (Based on Availability)
- 16.2.11 Tissue Regenix
- 16.2.11.1. Overview
- 16.2.11.2. Products
- 16.2.11.3. SWOT Analysis
- 16.2.11.4. Recent Developments
- 16.2.11.5. Financials (Based on Availability)
- 16.2.12 Integra LifeSciences
- 16.2.12.1. Overview
- 16.2.12.2. Products
- 16.2.12.3. SWOT Analysis
- 16.2.12.4. Recent Developments
- 16.2.12.5. Financials (Based on Availability)
- 16.2.13 Zimmer Biomet
- 16.2.13.1. Overview
- 16.2.13.2. Products
- 16.2.13.3. SWOT Analysis
- 16.2.13.4. Recent Developments
- 16.2.13.5. Financials (Based on Availability)
- 16.2.14 RTI Surgical
- 16.2.14.1. Overview
- 16.2.14.2. Products
- 16.2.14.3. SWOT Analysis
- 16.2.14.4. Recent Developments
- 16.2.14.5. Financials (Based on Availability)
- 16.2.15 Johnson & Johnson Services Inc (DePuy Synthes)
- 16.2.15.1. Overview
- 16.2.15.2. Products
- 16.2.15.3. SWOT Analysis
- 16.2.15.4. Recent Developments
- 16.2.15.5. Financials (Based on Availability)
- 16.2.1 CONMED Corporation
List of Figures
- Figure 1: Global Cruciate Ligament Diagnosis and Treatment Industry Revenue Breakdown (Million, %) by Region 2024 & 2032
- Figure 2: Global Cruciate Ligament Diagnosis and Treatment Industry Volume Breakdown (K Unit, %) by Region 2024 & 2032
- Figure 3: North America Cruciate Ligament Diagnosis and Treatment Industry Revenue (Million), by Country 2024 & 2032
- Figure 4: North America Cruciate Ligament Diagnosis and Treatment Industry Volume (K Unit), by Country 2024 & 2032
- Figure 5: North America Cruciate Ligament Diagnosis and Treatment Industry Revenue Share (%), by Country 2024 & 2032
- Figure 6: North America Cruciate Ligament Diagnosis and Treatment Industry Volume Share (%), by Country 2024 & 2032
- Figure 7: Europe Cruciate Ligament Diagnosis and Treatment Industry Revenue (Million), by Country 2024 & 2032
- Figure 8: Europe Cruciate Ligament Diagnosis and Treatment Industry Volume (K Unit), by Country 2024 & 2032
- Figure 9: Europe Cruciate Ligament Diagnosis and Treatment Industry Revenue Share (%), by Country 2024 & 2032
- Figure 10: Europe Cruciate Ligament Diagnosis and Treatment Industry Volume Share (%), by Country 2024 & 2032
- Figure 11: Asia acific Cruciate Ligament Diagnosis and Treatment Industry Revenue (Million), by Country 2024 & 2032
- Figure 12: Asia acific Cruciate Ligament Diagnosis and Treatment Industry Volume (K Unit), by Country 2024 & 2032
- Figure 13: Asia acific Cruciate Ligament Diagnosis and Treatment Industry Revenue Share (%), by Country 2024 & 2032
- Figure 14: Asia acific Cruciate Ligament Diagnosis and Treatment Industry Volume Share (%), by Country 2024 & 2032
- Figure 15: Middle East and Africa Cruciate Ligament Diagnosis and Treatment Industry Revenue (Million), by Country 2024 & 2032
- Figure 16: Middle East and Africa Cruciate Ligament Diagnosis and Treatment Industry Volume (K Unit), by Country 2024 & 2032
- Figure 17: Middle East and Africa Cruciate Ligament Diagnosis and Treatment Industry Revenue Share (%), by Country 2024 & 2032
- Figure 18: Middle East and Africa Cruciate Ligament Diagnosis and Treatment Industry Volume Share (%), by Country 2024 & 2032
- Figure 19: South America Cruciate Ligament Diagnosis and Treatment Industry Revenue (Million), by Country 2024 & 2032
- Figure 20: South America Cruciate Ligament Diagnosis and Treatment Industry Volume (K Unit), by Country 2024 & 2032
- Figure 21: South America Cruciate Ligament Diagnosis and Treatment Industry Revenue Share (%), by Country 2024 & 2032
- Figure 22: South America Cruciate Ligament Diagnosis and Treatment Industry Volume Share (%), by Country 2024 & 2032
- Figure 23: North America Cruciate Ligament Diagnosis and Treatment Industry Revenue (Million), by Procedure 2024 & 2032
- Figure 24: North America Cruciate Ligament Diagnosis and Treatment Industry Volume (K Unit), by Procedure 2024 & 2032
- Figure 25: North America Cruciate Ligament Diagnosis and Treatment Industry Revenue Share (%), by Procedure 2024 & 2032
- Figure 26: North America Cruciate Ligament Diagnosis and Treatment Industry Volume Share (%), by Procedure 2024 & 2032
- Figure 27: North America Cruciate Ligament Diagnosis and Treatment Industry Revenue (Million), by End User 2024 & 2032
- Figure 28: North America Cruciate Ligament Diagnosis and Treatment Industry Volume (K Unit), by End User 2024 & 2032
- Figure 29: North America Cruciate Ligament Diagnosis and Treatment Industry Revenue Share (%), by End User 2024 & 2032
- Figure 30: North America Cruciate Ligament Diagnosis and Treatment Industry Volume Share (%), by End User 2024 & 2032
- Figure 31: North America Cruciate Ligament Diagnosis and Treatment Industry Revenue (Million), by Country 2024 & 2032
- Figure 32: North America Cruciate Ligament Diagnosis and Treatment Industry Volume (K Unit), by Country 2024 & 2032
- Figure 33: North America Cruciate Ligament Diagnosis and Treatment Industry Revenue Share (%), by Country 2024 & 2032
- Figure 34: North America Cruciate Ligament Diagnosis and Treatment Industry Volume Share (%), by Country 2024 & 2032
- Figure 35: Europe Cruciate Ligament Diagnosis and Treatment Industry Revenue (Million), by Procedure 2024 & 2032
- Figure 36: Europe Cruciate Ligament Diagnosis and Treatment Industry Volume (K Unit), by Procedure 2024 & 2032
- Figure 37: Europe Cruciate Ligament Diagnosis and Treatment Industry Revenue Share (%), by Procedure 2024 & 2032
- Figure 38: Europe Cruciate Ligament Diagnosis and Treatment Industry Volume Share (%), by Procedure 2024 & 2032
- Figure 39: Europe Cruciate Ligament Diagnosis and Treatment Industry Revenue (Million), by End User 2024 & 2032
- Figure 40: Europe Cruciate Ligament Diagnosis and Treatment Industry Volume (K Unit), by End User 2024 & 2032
- Figure 41: Europe Cruciate Ligament Diagnosis and Treatment Industry Revenue Share (%), by End User 2024 & 2032
- Figure 42: Europe Cruciate Ligament Diagnosis and Treatment Industry Volume Share (%), by End User 2024 & 2032
- Figure 43: Europe Cruciate Ligament Diagnosis and Treatment Industry Revenue (Million), by Country 2024 & 2032
- Figure 44: Europe Cruciate Ligament Diagnosis and Treatment Industry Volume (K Unit), by Country 2024 & 2032
- Figure 45: Europe Cruciate Ligament Diagnosis and Treatment Industry Revenue Share (%), by Country 2024 & 2032
- Figure 46: Europe Cruciate Ligament Diagnosis and Treatment Industry Volume Share (%), by Country 2024 & 2032
- Figure 47: Asia acific Cruciate Ligament Diagnosis and Treatment Industry Revenue (Million), by Procedure 2024 & 2032
- Figure 48: Asia acific Cruciate Ligament Diagnosis and Treatment Industry Volume (K Unit), by Procedure 2024 & 2032
- Figure 49: Asia acific Cruciate Ligament Diagnosis and Treatment Industry Revenue Share (%), by Procedure 2024 & 2032
- Figure 50: Asia acific Cruciate Ligament Diagnosis and Treatment Industry Volume Share (%), by Procedure 2024 & 2032
- Figure 51: Asia acific Cruciate Ligament Diagnosis and Treatment Industry Revenue (Million), by End User 2024 & 2032
- Figure 52: Asia acific Cruciate Ligament Diagnosis and Treatment Industry Volume (K Unit), by End User 2024 & 2032
- Figure 53: Asia acific Cruciate Ligament Diagnosis and Treatment Industry Revenue Share (%), by End User 2024 & 2032
- Figure 54: Asia acific Cruciate Ligament Diagnosis and Treatment Industry Volume Share (%), by End User 2024 & 2032
- Figure 55: Asia acific Cruciate Ligament Diagnosis and Treatment Industry Revenue (Million), by Country 2024 & 2032
- Figure 56: Asia acific Cruciate Ligament Diagnosis and Treatment Industry Volume (K Unit), by Country 2024 & 2032
- Figure 57: Asia acific Cruciate Ligament Diagnosis and Treatment Industry Revenue Share (%), by Country 2024 & 2032
- Figure 58: Asia acific Cruciate Ligament Diagnosis and Treatment Industry Volume Share (%), by Country 2024 & 2032
- Figure 59: Middle East and Africa Cruciate Ligament Diagnosis and Treatment Industry Revenue (Million), by Procedure 2024 & 2032
- Figure 60: Middle East and Africa Cruciate Ligament Diagnosis and Treatment Industry Volume (K Unit), by Procedure 2024 & 2032
- Figure 61: Middle East and Africa Cruciate Ligament Diagnosis and Treatment Industry Revenue Share (%), by Procedure 2024 & 2032
- Figure 62: Middle East and Africa Cruciate Ligament Diagnosis and Treatment Industry Volume Share (%), by Procedure 2024 & 2032
- Figure 63: Middle East and Africa Cruciate Ligament Diagnosis and Treatment Industry Revenue (Million), by End User 2024 & 2032
- Figure 64: Middle East and Africa Cruciate Ligament Diagnosis and Treatment Industry Volume (K Unit), by End User 2024 & 2032
- Figure 65: Middle East and Africa Cruciate Ligament Diagnosis and Treatment Industry Revenue Share (%), by End User 2024 & 2032
- Figure 66: Middle East and Africa Cruciate Ligament Diagnosis and Treatment Industry Volume Share (%), by End User 2024 & 2032
- Figure 67: Middle East and Africa Cruciate Ligament Diagnosis and Treatment Industry Revenue (Million), by Country 2024 & 2032
- Figure 68: Middle East and Africa Cruciate Ligament Diagnosis and Treatment Industry Volume (K Unit), by Country 2024 & 2032
- Figure 69: Middle East and Africa Cruciate Ligament Diagnosis and Treatment Industry Revenue Share (%), by Country 2024 & 2032
- Figure 70: Middle East and Africa Cruciate Ligament Diagnosis and Treatment Industry Volume Share (%), by Country 2024 & 2032
- Figure 71: South America Cruciate Ligament Diagnosis and Treatment Industry Revenue (Million), by Procedure 2024 & 2032
- Figure 72: South America Cruciate Ligament Diagnosis and Treatment Industry Volume (K Unit), by Procedure 2024 & 2032
- Figure 73: South America Cruciate Ligament Diagnosis and Treatment Industry Revenue Share (%), by Procedure 2024 & 2032
- Figure 74: South America Cruciate Ligament Diagnosis and Treatment Industry Volume Share (%), by Procedure 2024 & 2032
- Figure 75: South America Cruciate Ligament Diagnosis and Treatment Industry Revenue (Million), by End User 2024 & 2032
- Figure 76: South America Cruciate Ligament Diagnosis and Treatment Industry Volume (K Unit), by End User 2024 & 2032
- Figure 77: South America Cruciate Ligament Diagnosis and Treatment Industry Revenue Share (%), by End User 2024 & 2032
- Figure 78: South America Cruciate Ligament Diagnosis and Treatment Industry Volume Share (%), by End User 2024 & 2032
- Figure 79: South America Cruciate Ligament Diagnosis and Treatment Industry Revenue (Million), by Country 2024 & 2032
- Figure 80: South America Cruciate Ligament Diagnosis and Treatment Industry Volume (K Unit), by Country 2024 & 2032
- Figure 81: South America Cruciate Ligament Diagnosis and Treatment Industry Revenue Share (%), by Country 2024 & 2032
- Figure 82: South America Cruciate Ligament Diagnosis and Treatment Industry Volume Share (%), by Country 2024 & 2032
List of Tables
- Table 1: Global Cruciate Ligament Diagnosis and Treatment Industry Revenue Million Forecast, by Region 2019 & 2032
- Table 2: Global Cruciate Ligament Diagnosis and Treatment Industry Volume K Unit Forecast, by Region 2019 & 2032
- Table 3: Global Cruciate Ligament Diagnosis and Treatment Industry Revenue Million Forecast, by Procedure 2019 & 2032
- Table 4: Global Cruciate Ligament Diagnosis and Treatment Industry Volume K Unit Forecast, by Procedure 2019 & 2032
- Table 5: Global Cruciate Ligament Diagnosis and Treatment Industry Revenue Million Forecast, by End User 2019 & 2032
- Table 6: Global Cruciate Ligament Diagnosis and Treatment Industry Volume K Unit Forecast, by End User 2019 & 2032
- Table 7: Global Cruciate Ligament Diagnosis and Treatment Industry Revenue Million Forecast, by Region 2019 & 2032
- Table 8: Global Cruciate Ligament Diagnosis and Treatment Industry Volume K Unit Forecast, by Region 2019 & 2032
- Table 9: Global Cruciate Ligament Diagnosis and Treatment Industry Revenue Million Forecast, by Country 2019 & 2032
- Table 10: Global Cruciate Ligament Diagnosis and Treatment Industry Volume K Unit Forecast, by Country 2019 & 2032
- Table 11: United States Cruciate Ligament Diagnosis and Treatment Industry Revenue (Million) Forecast, by Application 2019 & 2032
- Table 12: United States Cruciate Ligament Diagnosis and Treatment Industry Volume (K Unit) Forecast, by Application 2019 & 2032
- Table 13: Canada Cruciate Ligament Diagnosis and Treatment Industry Revenue (Million) Forecast, by Application 2019 & 2032
- Table 14: Canada Cruciate Ligament Diagnosis and Treatment Industry Volume (K Unit) Forecast, by Application 2019 & 2032
- Table 15: Mexico Cruciate Ligament Diagnosis and Treatment Industry Revenue (Million) Forecast, by Application 2019 & 2032
- Table 16: Mexico Cruciate Ligament Diagnosis and Treatment Industry Volume (K Unit) Forecast, by Application 2019 & 2032
- Table 17: Global Cruciate Ligament Diagnosis and Treatment Industry Revenue Million Forecast, by Country 2019 & 2032
- Table 18: Global Cruciate Ligament Diagnosis and Treatment Industry Volume K Unit Forecast, by Country 2019 & 2032
- Table 19: Germany Cruciate Ligament Diagnosis and Treatment Industry Revenue (Million) Forecast, by Application 2019 & 2032
- Table 20: Germany Cruciate Ligament Diagnosis and Treatment Industry Volume (K Unit) Forecast, by Application 2019 & 2032
- Table 21: United Kingdom Cruciate Ligament Diagnosis and Treatment Industry Revenue (Million) Forecast, by Application 2019 & 2032
- Table 22: United Kingdom Cruciate Ligament Diagnosis and Treatment Industry Volume (K Unit) Forecast, by Application 2019 & 2032
- Table 23: France Cruciate Ligament Diagnosis and Treatment Industry Revenue (Million) Forecast, by Application 2019 & 2032
- Table 24: France Cruciate Ligament Diagnosis and Treatment Industry Volume (K Unit) Forecast, by Application 2019 & 2032
- Table 25: Italy Cruciate Ligament Diagnosis and Treatment Industry Revenue (Million) Forecast, by Application 2019 & 2032
- Table 26: Italy Cruciate Ligament Diagnosis and Treatment Industry Volume (K Unit) Forecast, by Application 2019 & 2032
- Table 27: Spain Cruciate Ligament Diagnosis and Treatment Industry Revenue (Million) Forecast, by Application 2019 & 2032
- Table 28: Spain Cruciate Ligament Diagnosis and Treatment Industry Volume (K Unit) Forecast, by Application 2019 & 2032
- Table 29: Rest of Europe Cruciate Ligament Diagnosis and Treatment Industry Revenue (Million) Forecast, by Application 2019 & 2032
- Table 30: Rest of Europe Cruciate Ligament Diagnosis and Treatment Industry Volume (K Unit) Forecast, by Application 2019 & 2032
- Table 31: Global Cruciate Ligament Diagnosis and Treatment Industry Revenue Million Forecast, by Country 2019 & 2032
- Table 32: Global Cruciate Ligament Diagnosis and Treatment Industry Volume K Unit Forecast, by Country 2019 & 2032
- Table 33: China Cruciate Ligament Diagnosis and Treatment Industry Revenue (Million) Forecast, by Application 2019 & 2032
- Table 34: China Cruciate Ligament Diagnosis and Treatment Industry Volume (K Unit) Forecast, by Application 2019 & 2032
- Table 35: Japan Cruciate Ligament Diagnosis and Treatment Industry Revenue (Million) Forecast, by Application 2019 & 2032
- Table 36: Japan Cruciate Ligament Diagnosis and Treatment Industry Volume (K Unit) Forecast, by Application 2019 & 2032
- Table 37: India Cruciate Ligament Diagnosis and Treatment Industry Revenue (Million) Forecast, by Application 2019 & 2032
- Table 38: India Cruciate Ligament Diagnosis and Treatment Industry Volume (K Unit) Forecast, by Application 2019 & 2032
- Table 39: Australia Cruciate Ligament Diagnosis and Treatment Industry Revenue (Million) Forecast, by Application 2019 & 2032
- Table 40: Australia Cruciate Ligament Diagnosis and Treatment Industry Volume (K Unit) Forecast, by Application 2019 & 2032
- Table 41: South Korea Cruciate Ligament Diagnosis and Treatment Industry Revenue (Million) Forecast, by Application 2019 & 2032
- Table 42: South Korea Cruciate Ligament Diagnosis and Treatment Industry Volume (K Unit) Forecast, by Application 2019 & 2032
- Table 43: Rest of Asia Pacific Cruciate Ligament Diagnosis and Treatment Industry Revenue (Million) Forecast, by Application 2019 & 2032
- Table 44: Rest of Asia Pacific Cruciate Ligament Diagnosis and Treatment Industry Volume (K Unit) Forecast, by Application 2019 & 2032
- Table 45: Global Cruciate Ligament Diagnosis and Treatment Industry Revenue Million Forecast, by Country 2019 & 2032
- Table 46: Global Cruciate Ligament Diagnosis and Treatment Industry Volume K Unit Forecast, by Country 2019 & 2032
- Table 47: GCC Cruciate Ligament Diagnosis and Treatment Industry Revenue (Million) Forecast, by Application 2019 & 2032
- Table 48: GCC Cruciate Ligament Diagnosis and Treatment Industry Volume (K Unit) Forecast, by Application 2019 & 2032
- Table 49: South Africa Cruciate Ligament Diagnosis and Treatment Industry Revenue (Million) Forecast, by Application 2019 & 2032
- Table 50: South Africa Cruciate Ligament Diagnosis and Treatment Industry Volume (K Unit) Forecast, by Application 2019 & 2032
- Table 51: Rest of Middle East and Africa Cruciate Ligament Diagnosis and Treatment Industry Revenue (Million) Forecast, by Application 2019 & 2032
- Table 52: Rest of Middle East and Africa Cruciate Ligament Diagnosis and Treatment Industry Volume (K Unit) Forecast, by Application 2019 & 2032
- Table 53: Global Cruciate Ligament Diagnosis and Treatment Industry Revenue Million Forecast, by Country 2019 & 2032
- Table 54: Global Cruciate Ligament Diagnosis and Treatment Industry Volume K Unit Forecast, by Country 2019 & 2032
- Table 55: Brazil Cruciate Ligament Diagnosis and Treatment Industry Revenue (Million) Forecast, by Application 2019 & 2032
- Table 56: Brazil Cruciate Ligament Diagnosis and Treatment Industry Volume (K Unit) Forecast, by Application 2019 & 2032
- Table 57: Argentina Cruciate Ligament Diagnosis and Treatment Industry Revenue (Million) Forecast, by Application 2019 & 2032
- Table 58: Argentina Cruciate Ligament Diagnosis and Treatment Industry Volume (K Unit) Forecast, by Application 2019 & 2032
- Table 59: Rest of South America Cruciate Ligament Diagnosis and Treatment Industry Revenue (Million) Forecast, by Application 2019 & 2032
- Table 60: Rest of South America Cruciate Ligament Diagnosis and Treatment Industry Volume (K Unit) Forecast, by Application 2019 & 2032
- Table 61: Global Cruciate Ligament Diagnosis and Treatment Industry Revenue Million Forecast, by Procedure 2019 & 2032
- Table 62: Global Cruciate Ligament Diagnosis and Treatment Industry Volume K Unit Forecast, by Procedure 2019 & 2032
- Table 63: Global Cruciate Ligament Diagnosis and Treatment Industry Revenue Million Forecast, by End User 2019 & 2032
- Table 64: Global Cruciate Ligament Diagnosis and Treatment Industry Volume K Unit Forecast, by End User 2019 & 2032
- Table 65: Global Cruciate Ligament Diagnosis and Treatment Industry Revenue Million Forecast, by Country 2019 & 2032
- Table 66: Global Cruciate Ligament Diagnosis and Treatment Industry Volume K Unit Forecast, by Country 2019 & 2032
- Table 67: United States Cruciate Ligament Diagnosis and Treatment Industry Revenue (Million) Forecast, by Application 2019 & 2032
- Table 68: United States Cruciate Ligament Diagnosis and Treatment Industry Volume (K Unit) Forecast, by Application 2019 & 2032
- Table 69: Canada Cruciate Ligament Diagnosis and Treatment Industry Revenue (Million) Forecast, by Application 2019 & 2032
- Table 70: Canada Cruciate Ligament Diagnosis and Treatment Industry Volume (K Unit) Forecast, by Application 2019 & 2032
- Table 71: Mexico Cruciate Ligament Diagnosis and Treatment Industry Revenue (Million) Forecast, by Application 2019 & 2032
- Table 72: Mexico Cruciate Ligament Diagnosis and Treatment Industry Volume (K Unit) Forecast, by Application 2019 & 2032
- Table 73: Global Cruciate Ligament Diagnosis and Treatment Industry Revenue Million Forecast, by Procedure 2019 & 2032
- Table 74: Global Cruciate Ligament Diagnosis and Treatment Industry Volume K Unit Forecast, by Procedure 2019 & 2032
- Table 75: Global Cruciate Ligament Diagnosis and Treatment Industry Revenue Million Forecast, by End User 2019 & 2032
- Table 76: Global Cruciate Ligament Diagnosis and Treatment Industry Volume K Unit Forecast, by End User 2019 & 2032
- Table 77: Global Cruciate Ligament Diagnosis and Treatment Industry Revenue Million Forecast, by Country 2019 & 2032
- Table 78: Global Cruciate Ligament Diagnosis and Treatment Industry Volume K Unit Forecast, by Country 2019 & 2032
- Table 79: Germany Cruciate Ligament Diagnosis and Treatment Industry Revenue (Million) Forecast, by Application 2019 & 2032
- Table 80: Germany Cruciate Ligament Diagnosis and Treatment Industry Volume (K Unit) Forecast, by Application 2019 & 2032
- Table 81: United Kingdom Cruciate Ligament Diagnosis and Treatment Industry Revenue (Million) Forecast, by Application 2019 & 2032
- Table 82: United Kingdom Cruciate Ligament Diagnosis and Treatment Industry Volume (K Unit) Forecast, by Application 2019 & 2032
- Table 83: France Cruciate Ligament Diagnosis and Treatment Industry Revenue (Million) Forecast, by Application 2019 & 2032
- Table 84: France Cruciate Ligament Diagnosis and Treatment Industry Volume (K Unit) Forecast, by Application 2019 & 2032
- Table 85: Italy Cruciate Ligament Diagnosis and Treatment Industry Revenue (Million) Forecast, by Application 2019 & 2032
- Table 86: Italy Cruciate Ligament Diagnosis and Treatment Industry Volume (K Unit) Forecast, by Application 2019 & 2032
- Table 87: Spain Cruciate Ligament Diagnosis and Treatment Industry Revenue (Million) Forecast, by Application 2019 & 2032
- Table 88: Spain Cruciate Ligament Diagnosis and Treatment Industry Volume (K Unit) Forecast, by Application 2019 & 2032
- Table 89: Rest of Europe Cruciate Ligament Diagnosis and Treatment Industry Revenue (Million) Forecast, by Application 2019 & 2032
- Table 90: Rest of Europe Cruciate Ligament Diagnosis and Treatment Industry Volume (K Unit) Forecast, by Application 2019 & 2032
- Table 91: Global Cruciate Ligament Diagnosis and Treatment Industry Revenue Million Forecast, by Procedure 2019 & 2032
- Table 92: Global Cruciate Ligament Diagnosis and Treatment Industry Volume K Unit Forecast, by Procedure 2019 & 2032
- Table 93: Global Cruciate Ligament Diagnosis and Treatment Industry Revenue Million Forecast, by End User 2019 & 2032
- Table 94: Global Cruciate Ligament Diagnosis and Treatment Industry Volume K Unit Forecast, by End User 2019 & 2032
- Table 95: Global Cruciate Ligament Diagnosis and Treatment Industry Revenue Million Forecast, by Country 2019 & 2032
- Table 96: Global Cruciate Ligament Diagnosis and Treatment Industry Volume K Unit Forecast, by Country 2019 & 2032
- Table 97: China Cruciate Ligament Diagnosis and Treatment Industry Revenue (Million) Forecast, by Application 2019 & 2032
- Table 98: China Cruciate Ligament Diagnosis and Treatment Industry Volume (K Unit) Forecast, by Application 2019 & 2032
- Table 99: Japan Cruciate Ligament Diagnosis and Treatment Industry Revenue (Million) Forecast, by Application 2019 & 2032
- Table 100: Japan Cruciate Ligament Diagnosis and Treatment Industry Volume (K Unit) Forecast, by Application 2019 & 2032
- Table 101: India Cruciate Ligament Diagnosis and Treatment Industry Revenue (Million) Forecast, by Application 2019 & 2032
- Table 102: India Cruciate Ligament Diagnosis and Treatment Industry Volume (K Unit) Forecast, by Application 2019 & 2032
- Table 103: Australia Cruciate Ligament Diagnosis and Treatment Industry Revenue (Million) Forecast, by Application 2019 & 2032
- Table 104: Australia Cruciate Ligament Diagnosis and Treatment Industry Volume (K Unit) Forecast, by Application 2019 & 2032
- Table 105: South Korea Cruciate Ligament Diagnosis and Treatment Industry Revenue (Million) Forecast, by Application 2019 & 2032
- Table 106: South Korea Cruciate Ligament Diagnosis and Treatment Industry Volume (K Unit) Forecast, by Application 2019 & 2032
- Table 107: Rest of Asia Pacific Cruciate Ligament Diagnosis and Treatment Industry Revenue (Million) Forecast, by Application 2019 & 2032
- Table 108: Rest of Asia Pacific Cruciate Ligament Diagnosis and Treatment Industry Volume (K Unit) Forecast, by Application 2019 & 2032
- Table 109: Global Cruciate Ligament Diagnosis and Treatment Industry Revenue Million Forecast, by Procedure 2019 & 2032
- Table 110: Global Cruciate Ligament Diagnosis and Treatment Industry Volume K Unit Forecast, by Procedure 2019 & 2032
- Table 111: Global Cruciate Ligament Diagnosis and Treatment Industry Revenue Million Forecast, by End User 2019 & 2032
- Table 112: Global Cruciate Ligament Diagnosis and Treatment Industry Volume K Unit Forecast, by End User 2019 & 2032
- Table 113: Global Cruciate Ligament Diagnosis and Treatment Industry Revenue Million Forecast, by Country 2019 & 2032
- Table 114: Global Cruciate Ligament Diagnosis and Treatment Industry Volume K Unit Forecast, by Country 2019 & 2032
- Table 115: GCC Cruciate Ligament Diagnosis and Treatment Industry Revenue (Million) Forecast, by Application 2019 & 2032
- Table 116: GCC Cruciate Ligament Diagnosis and Treatment Industry Volume (K Unit) Forecast, by Application 2019 & 2032
- Table 117: South Africa Cruciate Ligament Diagnosis and Treatment Industry Revenue (Million) Forecast, by Application 2019 & 2032
- Table 118: South Africa Cruciate Ligament Diagnosis and Treatment Industry Volume (K Unit) Forecast, by Application 2019 & 2032
- Table 119: Rest of Middle East and Africa Cruciate Ligament Diagnosis and Treatment Industry Revenue (Million) Forecast, by Application 2019 & 2032
- Table 120: Rest of Middle East and Africa Cruciate Ligament Diagnosis and Treatment Industry Volume (K Unit) Forecast, by Application 2019 & 2032
- Table 121: Global Cruciate Ligament Diagnosis and Treatment Industry Revenue Million Forecast, by Procedure 2019 & 2032
- Table 122: Global Cruciate Ligament Diagnosis and Treatment Industry Volume K Unit Forecast, by Procedure 2019 & 2032
- Table 123: Global Cruciate Ligament Diagnosis and Treatment Industry Revenue Million Forecast, by End User 2019 & 2032
- Table 124: Global Cruciate Ligament Diagnosis and Treatment Industry Volume K Unit Forecast, by End User 2019 & 2032
- Table 125: Global Cruciate Ligament Diagnosis and Treatment Industry Revenue Million Forecast, by Country 2019 & 2032
- Table 126: Global Cruciate Ligament Diagnosis and Treatment Industry Volume K Unit Forecast, by Country 2019 & 2032
- Table 127: Brazil Cruciate Ligament Diagnosis and Treatment Industry Revenue (Million) Forecast, by Application 2019 & 2032
- Table 128: Brazil Cruciate Ligament Diagnosis and Treatment Industry Volume (K Unit) Forecast, by Application 2019 & 2032
- Table 129: Argentina Cruciate Ligament Diagnosis and Treatment Industry Revenue (Million) Forecast, by Application 2019 & 2032
- Table 130: Argentina Cruciate Ligament Diagnosis and Treatment Industry Volume (K Unit) Forecast, by Application 2019 & 2032
- Table 131: Rest of South America Cruciate Ligament Diagnosis and Treatment Industry Revenue (Million) Forecast, by Application 2019 & 2032
- Table 132: Rest of South America Cruciate Ligament Diagnosis and Treatment Industry Volume (K Unit) Forecast, by Application 2019 & 2032
Frequently Asked Questions
1. What is the projected Compound Annual Growth Rate (CAGR) of the Cruciate Ligament Diagnosis and Treatment Industry?
The projected CAGR is approximately 8.50%.
2. Which companies are prominent players in the Cruciate Ligament Diagnosis and Treatment Industry?
Key companies in the market include CONMED Corporation, Arthrex Inc, Smith & Nephew, Enovis (Mathys AG Bettlach), Corin Group, Exactech Inc, Medtronic, Miach Orthopaedics, Bauerfeind, Stryker, Tissue Regenix, Integra LifeSciences, Zimmer Biomet, RTI Surgical, Johnson & Johnson Services Inc (DePuy Synthes).
3. What are the main segments of the Cruciate Ligament Diagnosis and Treatment Industry?
The market segments include Procedure, End User.
4. Can you provide details about the market size?
The market size is estimated to be USD XX Million as of 2022.
5. What are some drivers contributing to market growth?
Increasing Demand for Minimally Invasive Procedures; Rising Incidence of Sports-related Injuries.
6. What are the notable trends driving market growth?
Anterior Cruciate Ligament (ACL) Repair Segment Expected to Grow Over the Forecast Period.
7. Are there any restraints impacting market growth?
High Cost of Procedures.
8. Can you provide examples of recent developments in the market?
October 2022: Oregon Health & Science University Health provided a Bridge-Enhanced ACL Restoration implant or BEAR for a common athletic injury involving a torn anterior cruciate ligament (ACL).
9. What pricing options are available for accessing the report?
Pricing options include single-user, multi-user, and enterprise licenses priced at USD 4750, USD 5250, and USD 8750 respectively.
10. Is the market size provided in terms of value or volume?
The market size is provided in terms of value, measured in Million and volume, measured in K Unit.
11. Are there any specific market keywords associated with the report?
Yes, the market keyword associated with the report is "Cruciate Ligament Diagnosis and Treatment Industry," which aids in identifying and referencing the specific market segment covered.
12. How do I determine which pricing option suits my needs best?
The pricing options vary based on user requirements and access needs. Individual users may opt for single-user licenses, while businesses requiring broader access may choose multi-user or enterprise licenses for cost-effective access to the report.
13. Are there any additional resources or data provided in the Cruciate Ligament Diagnosis and Treatment Industry report?
While the report offers comprehensive insights, it's advisable to review the specific contents or supplementary materials provided to ascertain if additional resources or data are available.
14. How can I stay updated on further developments or reports in the Cruciate Ligament Diagnosis and Treatment Industry?
To stay informed about further developments, trends, and reports in the Cruciate Ligament Diagnosis and Treatment Industry, consider subscribing to industry newsletters, following relevant companies and organizations, or regularly checking reputable industry news sources and publications.
Methodology
Step 1 - Identification of Relevant Samples Size from Population Database


Step 2 - Approaches for Defining Global Market Size (Value, Volume* & Price*)

Note*: In applicable scenarios
Step 3 - Data Sources
Primary Research
- Web Analytics
- Survey Reports
- Research Institute
- Latest Research Reports
- Opinion Leaders
Secondary Research
- Annual Reports
- White Paper
- Latest Press Release
- Industry Association
- Paid Database
- Investor Presentations

Step 4 - Data Triangulation
Involves using different sources of information in order to increase the validity of a study
These sources are likely to be stakeholders in a program - participants, other researchers, program staff, other community members, and so on.
Then we put all data in single framework & apply various statistical tools to find out the dynamic on the market.
During the analysis stage, feedback from the stakeholder groups would be compared to determine areas of agreement as well as areas of divergence
