

Key Insights
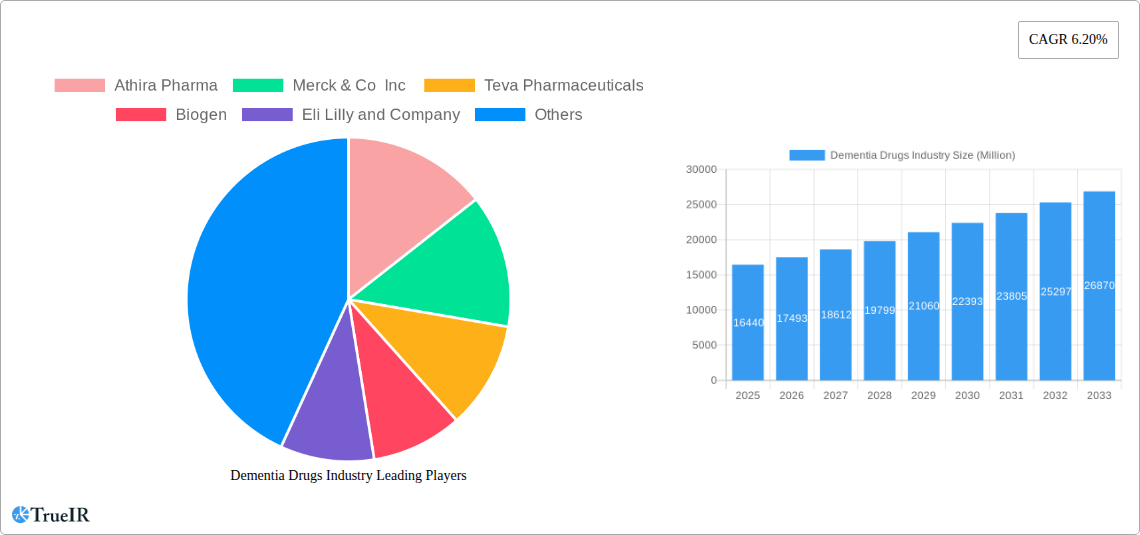
The dementia drugs market, valued at $16.44 billion in 2025, is projected to experience robust growth, driven by an aging global population and increasing prevalence of neurodegenerative diseases like Alzheimer's, Parkinson's disease dementia, and Lewy body dementia. The market's Compound Annual Growth Rate (CAGR) of 6.20% from 2025 to 2033 indicates substantial expansion. Key growth drivers include advancements in drug development, focusing on novel therapeutic approaches to address the underlying pathology of these diseases. This includes research into disease-modifying therapies, beyond symptomatic relief offered by current cholinesterase inhibitors and memantine (an NMDA receptor antagonist). The market segmentation reveals a significant share held by Alzheimer's disease drugs, followed by other dementias. North America and Europe currently dominate the market due to higher healthcare expenditure and prevalence rates, but the Asia-Pacific region is anticipated to witness significant growth driven by rising awareness and improved healthcare infrastructure. However, market restraints include the high cost of drugs, lengthy and complex clinical trials, and the challenges associated with developing effective disease-modifying treatments. The competitive landscape is intensely active with major pharmaceutical companies like Biogen, Eli Lilly, and AstraZeneca engaged in research and development alongside emerging biotech companies focusing on innovative treatment modalities.
The competitive landscape is marked by both established pharmaceutical giants and emerging biotech companies, underscoring the intense interest and investment in this therapeutic area. Successful development of disease-modifying therapies could significantly reshape the market. The ongoing research into various drug classes such as MAO inhibitors, glutamate inhibitors, and cholinesterase inhibitors shows a diversified approach, though breakthroughs are crucial to improve treatment effectiveness and patient outcomes. Regional variations in healthcare access and affordability will continue to influence market dynamics, creating both opportunities and challenges for market players. The forecast period (2025-2033) promises significant growth, particularly in regions with rapidly aging populations and increasing healthcare spending. Strategic collaborations and mergers & acquisitions are likely to play a significant role in shaping the market landscape in the coming years.
Dementia Drugs Industry: A Comprehensive Market Report (2019-2033)
This dynamic report provides a detailed analysis of the Dementia Drugs industry, projecting robust growth from 2025 to 2033. Leveraging extensive market research and data analysis covering the historical period (2019-2024), base year (2025), and estimated year (2025), this report offers invaluable insights for industry stakeholders, investors, and researchers. The market is segmented by indications (Alzheimer's Disease, Lewy Body Dementia, Parkinson's Disease Dementia, Vascular Dementia, Other Indications) and drug class (MAO Inhibitors, Glutamate Inhibitors, Cholinesterase Inhibitors). Key players like Biogen, Eli Lilly, and Eisai are analyzed, alongside emerging companies driving innovation. The report forecasts a market size exceeding xx Million by 2033, presenting significant opportunities and challenges within this rapidly evolving therapeutic landscape.
Dementia Drugs Industry Market Structure & Competitive Landscape
The Dementia Drugs market exhibits a moderately concentrated structure, with a few large pharmaceutical companies holding significant market share. The Herfindahl-Hirschman Index (HHI) for 2025 is estimated at xx, indicating a moderately competitive environment. However, the landscape is dynamic due to continuous innovation, regulatory changes, and strategic mergers and acquisitions (M&A).
- Market Concentration: The top 5 players account for approximately xx% of the global market share in 2025.
- Innovation Drivers: Significant R&D investments focus on developing novel therapies targeting various dementia subtypes, driving market expansion.
- Regulatory Impacts: Stringent regulatory approvals and post-market surveillance significantly influence market entry and product lifecycle.
- Product Substitutes: Limited effective substitutes exist, but ongoing research into alternative therapeutic approaches presents potential competition.
- End-User Segmentation: The market primarily serves healthcare providers (hospitals, clinics, nursing homes) and patients with dementia and their caregivers.
- M&A Trends: The past five years have witnessed xx M&A transactions in the dementia drugs sector, with a total value of approximately xx Million, indicating strategic consolidation within the industry. This reflects the high cost of research and development and the desire to expand product portfolios.
Dementia Drugs Industry Market Trends & Opportunities
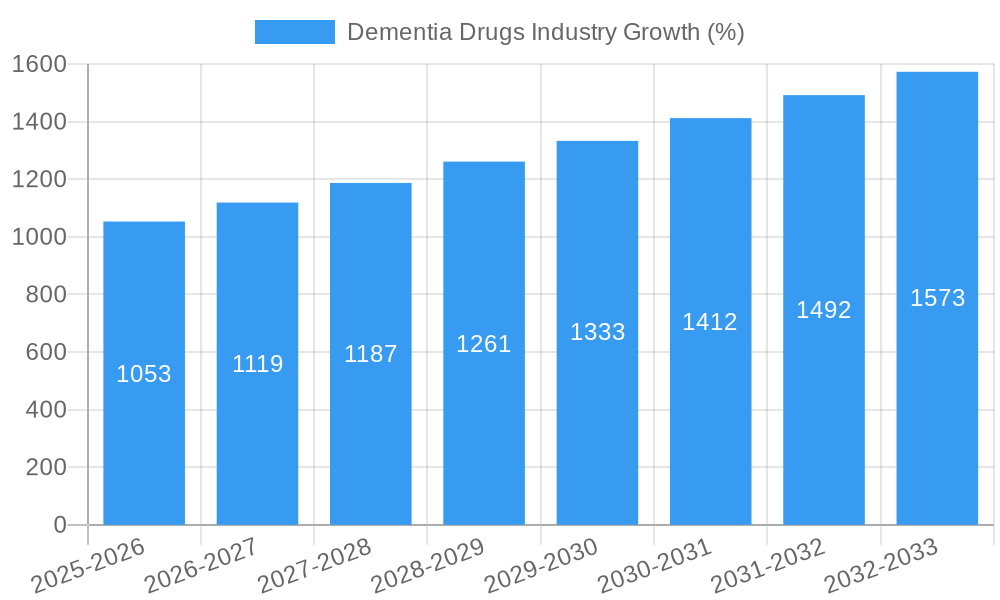
The global dementia drugs market is experiencing substantial growth, driven by the increasing prevalence of dementia worldwide, particularly Alzheimer's disease. The market is expected to register a Compound Annual Growth Rate (CAGR) of xx% during the forecast period (2025-2033), reaching a projected value of xx Million by 2033. This growth is fueled by several factors:
- Rising Prevalence of Dementia: The aging global population is the primary driver, leading to a significant increase in the number of individuals diagnosed with dementia.
- Technological Advancements: Innovations in drug delivery systems (e.g., transdermal patches) and diagnostic tools are improving treatment outcomes and market accessibility.
- Shifting Consumer Preferences: Increased awareness among patients and their families regarding available treatment options is driving higher demand.
- Competitive Dynamics: The competitive landscape fosters innovation, leading to the development of improved therapies with better efficacy and safety profiles. Market penetration rates for newer drugs are expected to increase steadily over the forecast period, driven by their improved effectiveness and reduced side effects compared to existing treatments.
Dominant Markets & Segments in Dementia Drugs Industry
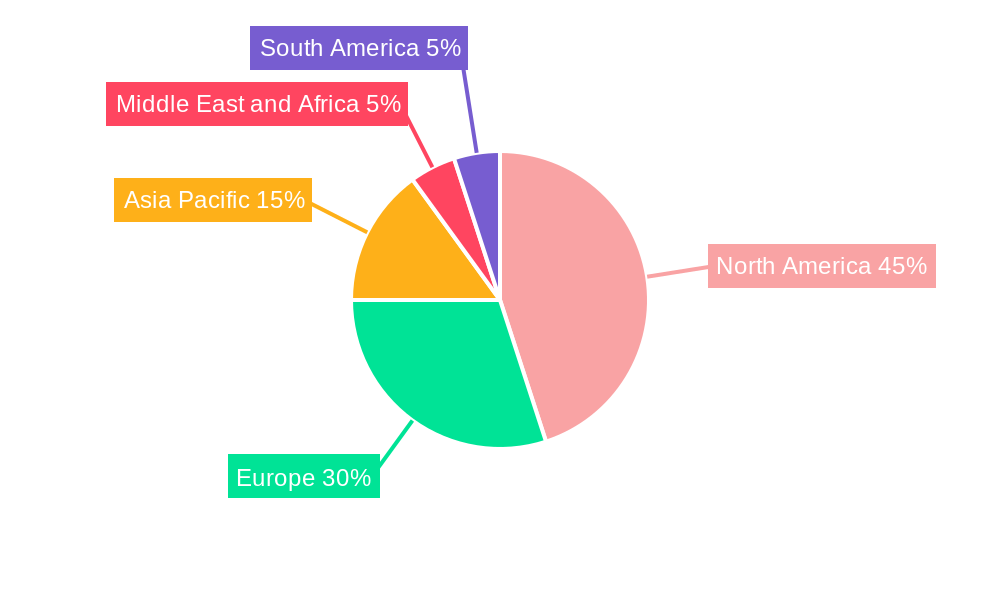
The North American region currently holds the largest market share for dementia drugs, followed by Europe. However, the Asia-Pacific region is projected to exhibit the highest CAGR during the forecast period due to rising geriatric populations and increased healthcare spending.
By Indications:
- Alzheimer's Disease: This segment dominates the market, accounting for the largest share due to its high prevalence and substantial research focus.
- Other Indications: This segment is expected to show significant growth due to increased awareness and research into treatment options for other forms of dementia.
By Drug Class:
- Cholinesterase Inhibitors: This segment currently holds a significant market share, but the emergence of newer drug classes may challenge its dominance. Growth drivers include established treatment protocols and readily available formulations.
- Glutamate Inhibitors: This class shows potential for future growth due to the ongoing research on its efficacy and selectivity in addressing specific dementia pathways.
Key Growth Drivers:
- Investment in R&D for new therapies.
- Improved diagnostic tools leading to early intervention and diagnosis.
- Government initiatives and healthcare policies focused on dementia management.
Dementia Drugs Industry Product Analysis
The dementia drugs market offers a range of products, including cholinesterase inhibitors (donepezil, rivastigmine, galantamine), memantine (an NMDA receptor antagonist), and combinations thereof. Recent innovations focus on improving drug delivery systems (e.g., transdermal patches like Corium's ADLARITY) to enhance patient compliance and reduce side effects. Further research into novel drug targets and mechanisms of action aims to improve efficacy and address unmet medical needs. This includes research into disease-modifying therapies that can slow down or halt the progression of dementia.
Key Drivers, Barriers & Challenges in Dementia Drugs Industry
Key Drivers:
The aging global population, increased awareness of dementia, advancements in research and development, and supportive government policies are key drivers of market growth.
Challenges and Restraints:
High drug costs, limited treatment efficacy in late-stage dementia, stringent regulatory approvals, and the complexity of dementia pathophysiology pose significant challenges. Supply chain disruptions can also impact availability and affordability. Furthermore, the high cost of clinical trials and the long lead times associated with drug development represent substantial barriers to entry for smaller companies.
Growth Drivers in the Dementia Drugs Industry Market
Technological advancements in drug discovery and development, coupled with increased investments in research and development, are primary drivers. Government initiatives focused on improving dementia care and rising public awareness are also significant contributing factors. The growing prevalence of dementia due to the aging population constitutes a substantial long-term driver.
Challenges Impacting Dementia Drugs Industry Growth
High research and development costs, lengthy regulatory approval processes, and the complex pathophysiology of dementia create challenges for drug development and market entry. Furthermore, limited treatment efficacy in late-stage dementia and the potential for adverse effects represent obstacles to widespread adoption. Supply chain disruptions can also lead to shortages and price fluctuations.
Key Players Shaping the Dementia Drugs Industry Market
- Athira Pharma
- Merck & Co Inc
- Teva Pharmaceuticals
- Biogen
- Eli Lilly and Company
- AstraZeneca
- Johnson and Johnson
- SK Capital (Apotex Pharmaceutical Holdings Inc)
- Aurobindo Pharma
- Eisai Co Ltd
- Annovis Bio
- Zydus Cadila
- GlaxoSmithKline PLC
- Pfizer Inc
Significant Dementia Drugs Industry Industry Milestones
- March 2022: Corium, Inc. received United States FDA approval for ADLARITY (donepezil transdermal system) for Alzheimer's disease.
- April 2022: NovaMedica developed and registered MIOREOL, a Donepezil and Memantine combination drug, in Russia and the Eurasian Economic Union.
Future Outlook for Dementia Drugs Industry Market
The dementia drugs market is poised for continued growth, driven by the escalating prevalence of dementia globally and ongoing research efforts to develop more effective and disease-modifying therapies. Strategic partnerships, increased R&D investment, and the emergence of novel treatment approaches will further shape the market landscape. The focus on improving patient outcomes and addressing unmet needs will be central to future market growth.
Dementia Drugs Industry Segmentation
-
1. Indications
- 1.1. Lewy Body Dementia
- 1.2. Parkinson's Disease Dementia
- 1.3. Alzheimer's Disease
- 1.4. Vascular Dementia
- 1.5. Other Indications
-
2. Drug Class
- 2.1. MAO Inhibitors
- 2.2. Glutamate Inhibitors
- 2.3. Cholinesterase Inhibitors
Dementia Drugs Industry Segmentation By Geography
-
1. North America
- 1.1. United States
- 1.2. Canada
- 1.3. Mexico
-
2. Europe
- 2.1. Germany
- 2.2. United Kingdom
- 2.3. France
- 2.4. Italy
- 2.5. Spain
- 2.6. Rest of Europe
-
3. Asia Pacific
- 3.1. China
- 3.2. Japan
- 3.3. India
- 3.4. Australia
- 3.5. South Korea
- 3.6. Rest of Asia Pacific
-
4. Middle East and Africa
- 4.1. GCC
- 4.2. South Africa
- 4.3. Rest of Middle East and Africa
-
5. South America
- 5.1. Brazil
- 5.2. Argentina
- 5.3. Rest of South America
Dementia Drugs Industry REPORT HIGHLIGHTS
| Aspects | Details |
|---|---|
| Study Period | 2019-2033 |
| Base Year | 2024 |
| Estimated Year | 2025 |
| Forecast Period | 2025-2033 |
| Historical Period | 2019-2024 |
| Growth Rate | CAGR of 6.20% from 2019-2033 |
| Segmentation |
|
Table of Contents
- 1. Introduction
- 1.1. Research Scope
- 1.2. Market Segmentation
- 1.3. Research Methodology
- 1.4. Definitions and Assumptions
- 2. Executive Summary
- 2.1. Introduction
- 3. Market Dynamics
- 3.1. Introduction
- 3.2. Market Drivers
- 3.2.1. Increasing Prevalence of Target Diseases; Introduction of New and Innovative Technologies and Drugs; Increased Government Funding and Awareness Programs
- 3.3. Market Restrains
- 3.3.1. High Failure Rates of Drugs at Approval Stages
- 3.4. Market Trends
- 3.4.1. The Alzheimer’s Disease Segment Hold a Significant Market Share and is Expected to Continue the Same Over the Forecast Period
- 4. Market Factor Analysis
- 4.1. Porters Five Forces
- 4.2. Supply/Value Chain
- 4.3. PESTEL analysis
- 4.4. Market Entropy
- 4.5. Patent/Trademark Analysis
- 5. Global Dementia Drugs Industry Analysis, Insights and Forecast, 2019-2031
- 5.1. Market Analysis, Insights and Forecast - by Indications
- 5.1.1. Lewy Body Dementia
- 5.1.2. Parkinson's Disease Dementia
- 5.1.3. Alzheimer's Disease
- 5.1.4. Vascular Dementia
- 5.1.5. Other Indications
- 5.2. Market Analysis, Insights and Forecast - by Drug Class
- 5.2.1. MAO Inhibitors
- 5.2.2. Glutamate Inhibitors
- 5.2.3. Cholinesterase Inhibitors
- 5.3. Market Analysis, Insights and Forecast - by Region
- 5.3.1. North America
- 5.3.2. Europe
- 5.3.3. Asia Pacific
- 5.3.4. Middle East and Africa
- 5.3.5. South America
- 5.1. Market Analysis, Insights and Forecast - by Indications
- 6. North America Dementia Drugs Industry Analysis, Insights and Forecast, 2019-2031
- 6.1. Market Analysis, Insights and Forecast - by Indications
- 6.1.1. Lewy Body Dementia
- 6.1.2. Parkinson's Disease Dementia
- 6.1.3. Alzheimer's Disease
- 6.1.4. Vascular Dementia
- 6.1.5. Other Indications
- 6.2. Market Analysis, Insights and Forecast - by Drug Class
- 6.2.1. MAO Inhibitors
- 6.2.2. Glutamate Inhibitors
- 6.2.3. Cholinesterase Inhibitors
- 6.1. Market Analysis, Insights and Forecast - by Indications
- 7. Europe Dementia Drugs Industry Analysis, Insights and Forecast, 2019-2031
- 7.1. Market Analysis, Insights and Forecast - by Indications
- 7.1.1. Lewy Body Dementia
- 7.1.2. Parkinson's Disease Dementia
- 7.1.3. Alzheimer's Disease
- 7.1.4. Vascular Dementia
- 7.1.5. Other Indications
- 7.2. Market Analysis, Insights and Forecast - by Drug Class
- 7.2.1. MAO Inhibitors
- 7.2.2. Glutamate Inhibitors
- 7.2.3. Cholinesterase Inhibitors
- 7.1. Market Analysis, Insights and Forecast - by Indications
- 8. Asia Pacific Dementia Drugs Industry Analysis, Insights and Forecast, 2019-2031
- 8.1. Market Analysis, Insights and Forecast - by Indications
- 8.1.1. Lewy Body Dementia
- 8.1.2. Parkinson's Disease Dementia
- 8.1.3. Alzheimer's Disease
- 8.1.4. Vascular Dementia
- 8.1.5. Other Indications
- 8.2. Market Analysis, Insights and Forecast - by Drug Class
- 8.2.1. MAO Inhibitors
- 8.2.2. Glutamate Inhibitors
- 8.2.3. Cholinesterase Inhibitors
- 8.1. Market Analysis, Insights and Forecast - by Indications
- 9. Middle East and Africa Dementia Drugs Industry Analysis, Insights and Forecast, 2019-2031
- 9.1. Market Analysis, Insights and Forecast - by Indications
- 9.1.1. Lewy Body Dementia
- 9.1.2. Parkinson's Disease Dementia
- 9.1.3. Alzheimer's Disease
- 9.1.4. Vascular Dementia
- 9.1.5. Other Indications
- 9.2. Market Analysis, Insights and Forecast - by Drug Class
- 9.2.1. MAO Inhibitors
- 9.2.2. Glutamate Inhibitors
- 9.2.3. Cholinesterase Inhibitors
- 9.1. Market Analysis, Insights and Forecast - by Indications
- 10. South America Dementia Drugs Industry Analysis, Insights and Forecast, 2019-2031
- 10.1. Market Analysis, Insights and Forecast - by Indications
- 10.1.1. Lewy Body Dementia
- 10.1.2. Parkinson's Disease Dementia
- 10.1.3. Alzheimer's Disease
- 10.1.4. Vascular Dementia
- 10.1.5. Other Indications
- 10.2. Market Analysis, Insights and Forecast - by Drug Class
- 10.2.1. MAO Inhibitors
- 10.2.2. Glutamate Inhibitors
- 10.2.3. Cholinesterase Inhibitors
- 10.1. Market Analysis, Insights and Forecast - by Indications
- 11. North America Dementia Drugs Industry Analysis, Insights and Forecast, 2019-2031
- 11.1. Market Analysis, Insights and Forecast - By Country/Sub-region
- 11.1.1 United States
- 11.1.2 Canada
- 11.1.3 Mexico
- 12. Europe Dementia Drugs Industry Analysis, Insights and Forecast, 2019-2031
- 12.1. Market Analysis, Insights and Forecast - By Country/Sub-region
- 12.1.1 Germany
- 12.1.2 United Kingdom
- 12.1.3 France
- 12.1.4 Italy
- 12.1.5 Spain
- 12.1.6 Rest of Europe
- 13. Asia Pacific Dementia Drugs Industry Analysis, Insights and Forecast, 2019-2031
- 13.1. Market Analysis, Insights and Forecast - By Country/Sub-region
- 13.1.1 China
- 13.1.2 Japan
- 13.1.3 India
- 13.1.4 Australia
- 13.1.5 South Korea
- 13.1.6 Rest of Asia Pacific
- 14. Middle East and Africa Dementia Drugs Industry Analysis, Insights and Forecast, 2019-2031
- 14.1. Market Analysis, Insights and Forecast - By Country/Sub-region
- 14.1.1 GCC
- 14.1.2 South Africa
- 14.1.3 Rest of Middle East and Africa
- 15. South America Dementia Drugs Industry Analysis, Insights and Forecast, 2019-2031
- 15.1. Market Analysis, Insights and Forecast - By Country/Sub-region
- 15.1.1 Brazil
- 15.1.2 Argentina
- 15.1.3 Rest of South America
- 16. Competitive Analysis
- 16.1. Global Market Share Analysis 2024
- 16.2. Company Profiles
- 16.2.1 Athira Pharma
- 16.2.1.1. Overview
- 16.2.1.2. Products
- 16.2.1.3. SWOT Analysis
- 16.2.1.4. Recent Developments
- 16.2.1.5. Financials (Based on Availability)
- 16.2.2 Merck & Co Inc
- 16.2.2.1. Overview
- 16.2.2.2. Products
- 16.2.2.3. SWOT Analysis
- 16.2.2.4. Recent Developments
- 16.2.2.5. Financials (Based on Availability)
- 16.2.3 Teva Pharmaceuticals
- 16.2.3.1. Overview
- 16.2.3.2. Products
- 16.2.3.3. SWOT Analysis
- 16.2.3.4. Recent Developments
- 16.2.3.5. Financials (Based on Availability)
- 16.2.4 Biogen
- 16.2.4.1. Overview
- 16.2.4.2. Products
- 16.2.4.3. SWOT Analysis
- 16.2.4.4. Recent Developments
- 16.2.4.5. Financials (Based on Availability)
- 16.2.5 Eli Lilly and Company
- 16.2.5.1. Overview
- 16.2.5.2. Products
- 16.2.5.3. SWOT Analysis
- 16.2.5.4. Recent Developments
- 16.2.5.5. Financials (Based on Availability)
- 16.2.6 AstraZeneca
- 16.2.6.1. Overview
- 16.2.6.2. Products
- 16.2.6.3. SWOT Analysis
- 16.2.6.4. Recent Developments
- 16.2.6.5. Financials (Based on Availability)
- 16.2.7 Johnson and Johnson
- 16.2.7.1. Overview
- 16.2.7.2. Products
- 16.2.7.3. SWOT Analysis
- 16.2.7.4. Recent Developments
- 16.2.7.5. Financials (Based on Availability)
- 16.2.8 SK Capital (Apotex Pharmaceutical Holdings Inc )
- 16.2.8.1. Overview
- 16.2.8.2. Products
- 16.2.8.3. SWOT Analysis
- 16.2.8.4. Recent Developments
- 16.2.8.5. Financials (Based on Availability)
- 16.2.9 Aurobindo Pharma
- 16.2.9.1. Overview
- 16.2.9.2. Products
- 16.2.9.3. SWOT Analysis
- 16.2.9.4. Recent Developments
- 16.2.9.5. Financials (Based on Availability)
- 16.2.10 Eisai Co Ltd
- 16.2.10.1. Overview
- 16.2.10.2. Products
- 16.2.10.3. SWOT Analysis
- 16.2.10.4. Recent Developments
- 16.2.10.5. Financials (Based on Availability)
- 16.2.11 Annovis Bio
- 16.2.11.1. Overview
- 16.2.11.2. Products
- 16.2.11.3. SWOT Analysis
- 16.2.11.4. Recent Developments
- 16.2.11.5. Financials (Based on Availability)
- 16.2.12 Zydus Cadila
- 16.2.12.1. Overview
- 16.2.12.2. Products
- 16.2.12.3. SWOT Analysis
- 16.2.12.4. Recent Developments
- 16.2.12.5. Financials (Based on Availability)
- 16.2.13 GlaxoSmithKline PLC
- 16.2.13.1. Overview
- 16.2.13.2. Products
- 16.2.13.3. SWOT Analysis
- 16.2.13.4. Recent Developments
- 16.2.13.5. Financials (Based on Availability)
- 16.2.14 Pfizer Inc
- 16.2.14.1. Overview
- 16.2.14.2. Products
- 16.2.14.3. SWOT Analysis
- 16.2.14.4. Recent Developments
- 16.2.14.5. Financials (Based on Availability)
- 16.2.1 Athira Pharma
List of Figures
- Figure 1: Global Dementia Drugs Industry Revenue Breakdown (Million, %) by Region 2024 & 2032
- Figure 2: Global Dementia Drugs Industry Volume Breakdown (K Unit, %) by Region 2024 & 2032
- Figure 3: North America Dementia Drugs Industry Revenue (Million), by Country 2024 & 2032
- Figure 4: North America Dementia Drugs Industry Volume (K Unit), by Country 2024 & 2032
- Figure 5: North America Dementia Drugs Industry Revenue Share (%), by Country 2024 & 2032
- Figure 6: North America Dementia Drugs Industry Volume Share (%), by Country 2024 & 2032
- Figure 7: Europe Dementia Drugs Industry Revenue (Million), by Country 2024 & 2032
- Figure 8: Europe Dementia Drugs Industry Volume (K Unit), by Country 2024 & 2032
- Figure 9: Europe Dementia Drugs Industry Revenue Share (%), by Country 2024 & 2032
- Figure 10: Europe Dementia Drugs Industry Volume Share (%), by Country 2024 & 2032
- Figure 11: Asia Pacific Dementia Drugs Industry Revenue (Million), by Country 2024 & 2032
- Figure 12: Asia Pacific Dementia Drugs Industry Volume (K Unit), by Country 2024 & 2032
- Figure 13: Asia Pacific Dementia Drugs Industry Revenue Share (%), by Country 2024 & 2032
- Figure 14: Asia Pacific Dementia Drugs Industry Volume Share (%), by Country 2024 & 2032
- Figure 15: Middle East and Africa Dementia Drugs Industry Revenue (Million), by Country 2024 & 2032
- Figure 16: Middle East and Africa Dementia Drugs Industry Volume (K Unit), by Country 2024 & 2032
- Figure 17: Middle East and Africa Dementia Drugs Industry Revenue Share (%), by Country 2024 & 2032
- Figure 18: Middle East and Africa Dementia Drugs Industry Volume Share (%), by Country 2024 & 2032
- Figure 19: South America Dementia Drugs Industry Revenue (Million), by Country 2024 & 2032
- Figure 20: South America Dementia Drugs Industry Volume (K Unit), by Country 2024 & 2032
- Figure 21: South America Dementia Drugs Industry Revenue Share (%), by Country 2024 & 2032
- Figure 22: South America Dementia Drugs Industry Volume Share (%), by Country 2024 & 2032
- Figure 23: North America Dementia Drugs Industry Revenue (Million), by Indications 2024 & 2032
- Figure 24: North America Dementia Drugs Industry Volume (K Unit), by Indications 2024 & 2032
- Figure 25: North America Dementia Drugs Industry Revenue Share (%), by Indications 2024 & 2032
- Figure 26: North America Dementia Drugs Industry Volume Share (%), by Indications 2024 & 2032
- Figure 27: North America Dementia Drugs Industry Revenue (Million), by Drug Class 2024 & 2032
- Figure 28: North America Dementia Drugs Industry Volume (K Unit), by Drug Class 2024 & 2032
- Figure 29: North America Dementia Drugs Industry Revenue Share (%), by Drug Class 2024 & 2032
- Figure 30: North America Dementia Drugs Industry Volume Share (%), by Drug Class 2024 & 2032
- Figure 31: North America Dementia Drugs Industry Revenue (Million), by Country 2024 & 2032
- Figure 32: North America Dementia Drugs Industry Volume (K Unit), by Country 2024 & 2032
- Figure 33: North America Dementia Drugs Industry Revenue Share (%), by Country 2024 & 2032
- Figure 34: North America Dementia Drugs Industry Volume Share (%), by Country 2024 & 2032
- Figure 35: Europe Dementia Drugs Industry Revenue (Million), by Indications 2024 & 2032
- Figure 36: Europe Dementia Drugs Industry Volume (K Unit), by Indications 2024 & 2032
- Figure 37: Europe Dementia Drugs Industry Revenue Share (%), by Indications 2024 & 2032
- Figure 38: Europe Dementia Drugs Industry Volume Share (%), by Indications 2024 & 2032
- Figure 39: Europe Dementia Drugs Industry Revenue (Million), by Drug Class 2024 & 2032
- Figure 40: Europe Dementia Drugs Industry Volume (K Unit), by Drug Class 2024 & 2032
- Figure 41: Europe Dementia Drugs Industry Revenue Share (%), by Drug Class 2024 & 2032
- Figure 42: Europe Dementia Drugs Industry Volume Share (%), by Drug Class 2024 & 2032
- Figure 43: Europe Dementia Drugs Industry Revenue (Million), by Country 2024 & 2032
- Figure 44: Europe Dementia Drugs Industry Volume (K Unit), by Country 2024 & 2032
- Figure 45: Europe Dementia Drugs Industry Revenue Share (%), by Country 2024 & 2032
- Figure 46: Europe Dementia Drugs Industry Volume Share (%), by Country 2024 & 2032
- Figure 47: Asia Pacific Dementia Drugs Industry Revenue (Million), by Indications 2024 & 2032
- Figure 48: Asia Pacific Dementia Drugs Industry Volume (K Unit), by Indications 2024 & 2032
- Figure 49: Asia Pacific Dementia Drugs Industry Revenue Share (%), by Indications 2024 & 2032
- Figure 50: Asia Pacific Dementia Drugs Industry Volume Share (%), by Indications 2024 & 2032
- Figure 51: Asia Pacific Dementia Drugs Industry Revenue (Million), by Drug Class 2024 & 2032
- Figure 52: Asia Pacific Dementia Drugs Industry Volume (K Unit), by Drug Class 2024 & 2032
- Figure 53: Asia Pacific Dementia Drugs Industry Revenue Share (%), by Drug Class 2024 & 2032
- Figure 54: Asia Pacific Dementia Drugs Industry Volume Share (%), by Drug Class 2024 & 2032
- Figure 55: Asia Pacific Dementia Drugs Industry Revenue (Million), by Country 2024 & 2032
- Figure 56: Asia Pacific Dementia Drugs Industry Volume (K Unit), by Country 2024 & 2032
- Figure 57: Asia Pacific Dementia Drugs Industry Revenue Share (%), by Country 2024 & 2032
- Figure 58: Asia Pacific Dementia Drugs Industry Volume Share (%), by Country 2024 & 2032
- Figure 59: Middle East and Africa Dementia Drugs Industry Revenue (Million), by Indications 2024 & 2032
- Figure 60: Middle East and Africa Dementia Drugs Industry Volume (K Unit), by Indications 2024 & 2032
- Figure 61: Middle East and Africa Dementia Drugs Industry Revenue Share (%), by Indications 2024 & 2032
- Figure 62: Middle East and Africa Dementia Drugs Industry Volume Share (%), by Indications 2024 & 2032
- Figure 63: Middle East and Africa Dementia Drugs Industry Revenue (Million), by Drug Class 2024 & 2032
- Figure 64: Middle East and Africa Dementia Drugs Industry Volume (K Unit), by Drug Class 2024 & 2032
- Figure 65: Middle East and Africa Dementia Drugs Industry Revenue Share (%), by Drug Class 2024 & 2032
- Figure 66: Middle East and Africa Dementia Drugs Industry Volume Share (%), by Drug Class 2024 & 2032
- Figure 67: Middle East and Africa Dementia Drugs Industry Revenue (Million), by Country 2024 & 2032
- Figure 68: Middle East and Africa Dementia Drugs Industry Volume (K Unit), by Country 2024 & 2032
- Figure 69: Middle East and Africa Dementia Drugs Industry Revenue Share (%), by Country 2024 & 2032
- Figure 70: Middle East and Africa Dementia Drugs Industry Volume Share (%), by Country 2024 & 2032
- Figure 71: South America Dementia Drugs Industry Revenue (Million), by Indications 2024 & 2032
- Figure 72: South America Dementia Drugs Industry Volume (K Unit), by Indications 2024 & 2032
- Figure 73: South America Dementia Drugs Industry Revenue Share (%), by Indications 2024 & 2032
- Figure 74: South America Dementia Drugs Industry Volume Share (%), by Indications 2024 & 2032
- Figure 75: South America Dementia Drugs Industry Revenue (Million), by Drug Class 2024 & 2032
- Figure 76: South America Dementia Drugs Industry Volume (K Unit), by Drug Class 2024 & 2032
- Figure 77: South America Dementia Drugs Industry Revenue Share (%), by Drug Class 2024 & 2032
- Figure 78: South America Dementia Drugs Industry Volume Share (%), by Drug Class 2024 & 2032
- Figure 79: South America Dementia Drugs Industry Revenue (Million), by Country 2024 & 2032
- Figure 80: South America Dementia Drugs Industry Volume (K Unit), by Country 2024 & 2032
- Figure 81: South America Dementia Drugs Industry Revenue Share (%), by Country 2024 & 2032
- Figure 82: South America Dementia Drugs Industry Volume Share (%), by Country 2024 & 2032
List of Tables
- Table 1: Global Dementia Drugs Industry Revenue Million Forecast, by Region 2019 & 2032
- Table 2: Global Dementia Drugs Industry Volume K Unit Forecast, by Region 2019 & 2032
- Table 3: Global Dementia Drugs Industry Revenue Million Forecast, by Indications 2019 & 2032
- Table 4: Global Dementia Drugs Industry Volume K Unit Forecast, by Indications 2019 & 2032
- Table 5: Global Dementia Drugs Industry Revenue Million Forecast, by Drug Class 2019 & 2032
- Table 6: Global Dementia Drugs Industry Volume K Unit Forecast, by Drug Class 2019 & 2032
- Table 7: Global Dementia Drugs Industry Revenue Million Forecast, by Region 2019 & 2032
- Table 8: Global Dementia Drugs Industry Volume K Unit Forecast, by Region 2019 & 2032
- Table 9: Global Dementia Drugs Industry Revenue Million Forecast, by Country 2019 & 2032
- Table 10: Global Dementia Drugs Industry Volume K Unit Forecast, by Country 2019 & 2032
- Table 11: United States Dementia Drugs Industry Revenue (Million) Forecast, by Application 2019 & 2032
- Table 12: United States Dementia Drugs Industry Volume (K Unit) Forecast, by Application 2019 & 2032
- Table 13: Canada Dementia Drugs Industry Revenue (Million) Forecast, by Application 2019 & 2032
- Table 14: Canada Dementia Drugs Industry Volume (K Unit) Forecast, by Application 2019 & 2032
- Table 15: Mexico Dementia Drugs Industry Revenue (Million) Forecast, by Application 2019 & 2032
- Table 16: Mexico Dementia Drugs Industry Volume (K Unit) Forecast, by Application 2019 & 2032
- Table 17: Global Dementia Drugs Industry Revenue Million Forecast, by Country 2019 & 2032
- Table 18: Global Dementia Drugs Industry Volume K Unit Forecast, by Country 2019 & 2032
- Table 19: Germany Dementia Drugs Industry Revenue (Million) Forecast, by Application 2019 & 2032
- Table 20: Germany Dementia Drugs Industry Volume (K Unit) Forecast, by Application 2019 & 2032
- Table 21: United Kingdom Dementia Drugs Industry Revenue (Million) Forecast, by Application 2019 & 2032
- Table 22: United Kingdom Dementia Drugs Industry Volume (K Unit) Forecast, by Application 2019 & 2032
- Table 23: France Dementia Drugs Industry Revenue (Million) Forecast, by Application 2019 & 2032
- Table 24: France Dementia Drugs Industry Volume (K Unit) Forecast, by Application 2019 & 2032
- Table 25: Italy Dementia Drugs Industry Revenue (Million) Forecast, by Application 2019 & 2032
- Table 26: Italy Dementia Drugs Industry Volume (K Unit) Forecast, by Application 2019 & 2032
- Table 27: Spain Dementia Drugs Industry Revenue (Million) Forecast, by Application 2019 & 2032
- Table 28: Spain Dementia Drugs Industry Volume (K Unit) Forecast, by Application 2019 & 2032
- Table 29: Rest of Europe Dementia Drugs Industry Revenue (Million) Forecast, by Application 2019 & 2032
- Table 30: Rest of Europe Dementia Drugs Industry Volume (K Unit) Forecast, by Application 2019 & 2032
- Table 31: Global Dementia Drugs Industry Revenue Million Forecast, by Country 2019 & 2032
- Table 32: Global Dementia Drugs Industry Volume K Unit Forecast, by Country 2019 & 2032
- Table 33: China Dementia Drugs Industry Revenue (Million) Forecast, by Application 2019 & 2032
- Table 34: China Dementia Drugs Industry Volume (K Unit) Forecast, by Application 2019 & 2032
- Table 35: Japan Dementia Drugs Industry Revenue (Million) Forecast, by Application 2019 & 2032
- Table 36: Japan Dementia Drugs Industry Volume (K Unit) Forecast, by Application 2019 & 2032
- Table 37: India Dementia Drugs Industry Revenue (Million) Forecast, by Application 2019 & 2032
- Table 38: India Dementia Drugs Industry Volume (K Unit) Forecast, by Application 2019 & 2032
- Table 39: Australia Dementia Drugs Industry Revenue (Million) Forecast, by Application 2019 & 2032
- Table 40: Australia Dementia Drugs Industry Volume (K Unit) Forecast, by Application 2019 & 2032
- Table 41: South Korea Dementia Drugs Industry Revenue (Million) Forecast, by Application 2019 & 2032
- Table 42: South Korea Dementia Drugs Industry Volume (K Unit) Forecast, by Application 2019 & 2032
- Table 43: Rest of Asia Pacific Dementia Drugs Industry Revenue (Million) Forecast, by Application 2019 & 2032
- Table 44: Rest of Asia Pacific Dementia Drugs Industry Volume (K Unit) Forecast, by Application 2019 & 2032
- Table 45: Global Dementia Drugs Industry Revenue Million Forecast, by Country 2019 & 2032
- Table 46: Global Dementia Drugs Industry Volume K Unit Forecast, by Country 2019 & 2032
- Table 47: GCC Dementia Drugs Industry Revenue (Million) Forecast, by Application 2019 & 2032
- Table 48: GCC Dementia Drugs Industry Volume (K Unit) Forecast, by Application 2019 & 2032
- Table 49: South Africa Dementia Drugs Industry Revenue (Million) Forecast, by Application 2019 & 2032
- Table 50: South Africa Dementia Drugs Industry Volume (K Unit) Forecast, by Application 2019 & 2032
- Table 51: Rest of Middle East and Africa Dementia Drugs Industry Revenue (Million) Forecast, by Application 2019 & 2032
- Table 52: Rest of Middle East and Africa Dementia Drugs Industry Volume (K Unit) Forecast, by Application 2019 & 2032
- Table 53: Global Dementia Drugs Industry Revenue Million Forecast, by Country 2019 & 2032
- Table 54: Global Dementia Drugs Industry Volume K Unit Forecast, by Country 2019 & 2032
- Table 55: Brazil Dementia Drugs Industry Revenue (Million) Forecast, by Application 2019 & 2032
- Table 56: Brazil Dementia Drugs Industry Volume (K Unit) Forecast, by Application 2019 & 2032
- Table 57: Argentina Dementia Drugs Industry Revenue (Million) Forecast, by Application 2019 & 2032
- Table 58: Argentina Dementia Drugs Industry Volume (K Unit) Forecast, by Application 2019 & 2032
- Table 59: Rest of South America Dementia Drugs Industry Revenue (Million) Forecast, by Application 2019 & 2032
- Table 60: Rest of South America Dementia Drugs Industry Volume (K Unit) Forecast, by Application 2019 & 2032
- Table 61: Global Dementia Drugs Industry Revenue Million Forecast, by Indications 2019 & 2032
- Table 62: Global Dementia Drugs Industry Volume K Unit Forecast, by Indications 2019 & 2032
- Table 63: Global Dementia Drugs Industry Revenue Million Forecast, by Drug Class 2019 & 2032
- Table 64: Global Dementia Drugs Industry Volume K Unit Forecast, by Drug Class 2019 & 2032
- Table 65: Global Dementia Drugs Industry Revenue Million Forecast, by Country 2019 & 2032
- Table 66: Global Dementia Drugs Industry Volume K Unit Forecast, by Country 2019 & 2032
- Table 67: United States Dementia Drugs Industry Revenue (Million) Forecast, by Application 2019 & 2032
- Table 68: United States Dementia Drugs Industry Volume (K Unit) Forecast, by Application 2019 & 2032
- Table 69: Canada Dementia Drugs Industry Revenue (Million) Forecast, by Application 2019 & 2032
- Table 70: Canada Dementia Drugs Industry Volume (K Unit) Forecast, by Application 2019 & 2032
- Table 71: Mexico Dementia Drugs Industry Revenue (Million) Forecast, by Application 2019 & 2032
- Table 72: Mexico Dementia Drugs Industry Volume (K Unit) Forecast, by Application 2019 & 2032
- Table 73: Global Dementia Drugs Industry Revenue Million Forecast, by Indications 2019 & 2032
- Table 74: Global Dementia Drugs Industry Volume K Unit Forecast, by Indications 2019 & 2032
- Table 75: Global Dementia Drugs Industry Revenue Million Forecast, by Drug Class 2019 & 2032
- Table 76: Global Dementia Drugs Industry Volume K Unit Forecast, by Drug Class 2019 & 2032
- Table 77: Global Dementia Drugs Industry Revenue Million Forecast, by Country 2019 & 2032
- Table 78: Global Dementia Drugs Industry Volume K Unit Forecast, by Country 2019 & 2032
- Table 79: Germany Dementia Drugs Industry Revenue (Million) Forecast, by Application 2019 & 2032
- Table 80: Germany Dementia Drugs Industry Volume (K Unit) Forecast, by Application 2019 & 2032
- Table 81: United Kingdom Dementia Drugs Industry Revenue (Million) Forecast, by Application 2019 & 2032
- Table 82: United Kingdom Dementia Drugs Industry Volume (K Unit) Forecast, by Application 2019 & 2032
- Table 83: France Dementia Drugs Industry Revenue (Million) Forecast, by Application 2019 & 2032
- Table 84: France Dementia Drugs Industry Volume (K Unit) Forecast, by Application 2019 & 2032
- Table 85: Italy Dementia Drugs Industry Revenue (Million) Forecast, by Application 2019 & 2032
- Table 86: Italy Dementia Drugs Industry Volume (K Unit) Forecast, by Application 2019 & 2032
- Table 87: Spain Dementia Drugs Industry Revenue (Million) Forecast, by Application 2019 & 2032
- Table 88: Spain Dementia Drugs Industry Volume (K Unit) Forecast, by Application 2019 & 2032
- Table 89: Rest of Europe Dementia Drugs Industry Revenue (Million) Forecast, by Application 2019 & 2032
- Table 90: Rest of Europe Dementia Drugs Industry Volume (K Unit) Forecast, by Application 2019 & 2032
- Table 91: Global Dementia Drugs Industry Revenue Million Forecast, by Indications 2019 & 2032
- Table 92: Global Dementia Drugs Industry Volume K Unit Forecast, by Indications 2019 & 2032
- Table 93: Global Dementia Drugs Industry Revenue Million Forecast, by Drug Class 2019 & 2032
- Table 94: Global Dementia Drugs Industry Volume K Unit Forecast, by Drug Class 2019 & 2032
- Table 95: Global Dementia Drugs Industry Revenue Million Forecast, by Country 2019 & 2032
- Table 96: Global Dementia Drugs Industry Volume K Unit Forecast, by Country 2019 & 2032
- Table 97: China Dementia Drugs Industry Revenue (Million) Forecast, by Application 2019 & 2032
- Table 98: China Dementia Drugs Industry Volume (K Unit) Forecast, by Application 2019 & 2032
- Table 99: Japan Dementia Drugs Industry Revenue (Million) Forecast, by Application 2019 & 2032
- Table 100: Japan Dementia Drugs Industry Volume (K Unit) Forecast, by Application 2019 & 2032
- Table 101: India Dementia Drugs Industry Revenue (Million) Forecast, by Application 2019 & 2032
- Table 102: India Dementia Drugs Industry Volume (K Unit) Forecast, by Application 2019 & 2032
- Table 103: Australia Dementia Drugs Industry Revenue (Million) Forecast, by Application 2019 & 2032
- Table 104: Australia Dementia Drugs Industry Volume (K Unit) Forecast, by Application 2019 & 2032
- Table 105: South Korea Dementia Drugs Industry Revenue (Million) Forecast, by Application 2019 & 2032
- Table 106: South Korea Dementia Drugs Industry Volume (K Unit) Forecast, by Application 2019 & 2032
- Table 107: Rest of Asia Pacific Dementia Drugs Industry Revenue (Million) Forecast, by Application 2019 & 2032
- Table 108: Rest of Asia Pacific Dementia Drugs Industry Volume (K Unit) Forecast, by Application 2019 & 2032
- Table 109: Global Dementia Drugs Industry Revenue Million Forecast, by Indications 2019 & 2032
- Table 110: Global Dementia Drugs Industry Volume K Unit Forecast, by Indications 2019 & 2032
- Table 111: Global Dementia Drugs Industry Revenue Million Forecast, by Drug Class 2019 & 2032
- Table 112: Global Dementia Drugs Industry Volume K Unit Forecast, by Drug Class 2019 & 2032
- Table 113: Global Dementia Drugs Industry Revenue Million Forecast, by Country 2019 & 2032
- Table 114: Global Dementia Drugs Industry Volume K Unit Forecast, by Country 2019 & 2032
- Table 115: GCC Dementia Drugs Industry Revenue (Million) Forecast, by Application 2019 & 2032
- Table 116: GCC Dementia Drugs Industry Volume (K Unit) Forecast, by Application 2019 & 2032
- Table 117: South Africa Dementia Drugs Industry Revenue (Million) Forecast, by Application 2019 & 2032
- Table 118: South Africa Dementia Drugs Industry Volume (K Unit) Forecast, by Application 2019 & 2032
- Table 119: Rest of Middle East and Africa Dementia Drugs Industry Revenue (Million) Forecast, by Application 2019 & 2032
- Table 120: Rest of Middle East and Africa Dementia Drugs Industry Volume (K Unit) Forecast, by Application 2019 & 2032
- Table 121: Global Dementia Drugs Industry Revenue Million Forecast, by Indications 2019 & 2032
- Table 122: Global Dementia Drugs Industry Volume K Unit Forecast, by Indications 2019 & 2032
- Table 123: Global Dementia Drugs Industry Revenue Million Forecast, by Drug Class 2019 & 2032
- Table 124: Global Dementia Drugs Industry Volume K Unit Forecast, by Drug Class 2019 & 2032
- Table 125: Global Dementia Drugs Industry Revenue Million Forecast, by Country 2019 & 2032
- Table 126: Global Dementia Drugs Industry Volume K Unit Forecast, by Country 2019 & 2032
- Table 127: Brazil Dementia Drugs Industry Revenue (Million) Forecast, by Application 2019 & 2032
- Table 128: Brazil Dementia Drugs Industry Volume (K Unit) Forecast, by Application 2019 & 2032
- Table 129: Argentina Dementia Drugs Industry Revenue (Million) Forecast, by Application 2019 & 2032
- Table 130: Argentina Dementia Drugs Industry Volume (K Unit) Forecast, by Application 2019 & 2032
- Table 131: Rest of South America Dementia Drugs Industry Revenue (Million) Forecast, by Application 2019 & 2032
- Table 132: Rest of South America Dementia Drugs Industry Volume (K Unit) Forecast, by Application 2019 & 2032
Frequently Asked Questions
1. What is the projected Compound Annual Growth Rate (CAGR) of the Dementia Drugs Industry?
The projected CAGR is approximately 6.20%.
2. Which companies are prominent players in the Dementia Drugs Industry?
Key companies in the market include Athira Pharma, Merck & Co Inc , Teva Pharmaceuticals, Biogen, Eli Lilly and Company, AstraZeneca, Johnson and Johnson, SK Capital (Apotex Pharmaceutical Holdings Inc ), Aurobindo Pharma, Eisai Co Ltd, Annovis Bio, Zydus Cadila, GlaxoSmithKline PLC, Pfizer Inc.
3. What are the main segments of the Dementia Drugs Industry?
The market segments include Indications, Drug Class.
4. Can you provide details about the market size?
The market size is estimated to be USD 16.44 Million as of 2022.
5. What are some drivers contributing to market growth?
Increasing Prevalence of Target Diseases; Introduction of New and Innovative Technologies and Drugs; Increased Government Funding and Awareness Programs.
6. What are the notable trends driving market growth?
The Alzheimer’s Disease Segment Hold a Significant Market Share and is Expected to Continue the Same Over the Forecast Period.
7. Are there any restraints impacting market growth?
High Failure Rates of Drugs at Approval Stages.
8. Can you provide examples of recent developments in the market?
April 2022- NovaMedica developed and registered an innovative combination of Donepezil and Memantine molecules, the primary therapies for dementia associated with Alzheimer's disease. The drug is registered under the name MIOREOL. This is one of the combinations in the Russian market and the markets of the Eurasian Economic Union members and Europe.
9. What pricing options are available for accessing the report?
Pricing options include single-user, multi-user, and enterprise licenses priced at USD 4750, USD 5250, and USD 8750 respectively.
10. Is the market size provided in terms of value or volume?
The market size is provided in terms of value, measured in Million and volume, measured in K Unit.
11. Are there any specific market keywords associated with the report?
Yes, the market keyword associated with the report is "Dementia Drugs Industry," which aids in identifying and referencing the specific market segment covered.
12. How do I determine which pricing option suits my needs best?
The pricing options vary based on user requirements and access needs. Individual users may opt for single-user licenses, while businesses requiring broader access may choose multi-user or enterprise licenses for cost-effective access to the report.
13. Are there any additional resources or data provided in the Dementia Drugs Industry report?
While the report offers comprehensive insights, it's advisable to review the specific contents or supplementary materials provided to ascertain if additional resources or data are available.
14. How can I stay updated on further developments or reports in the Dementia Drugs Industry?
To stay informed about further developments, trends, and reports in the Dementia Drugs Industry, consider subscribing to industry newsletters, following relevant companies and organizations, or regularly checking reputable industry news sources and publications.
Methodology
Step 1 - Identification of Relevant Samples Size from Population Database


Step 2 - Approaches for Defining Global Market Size (Value, Volume* & Price*)

Note*: In applicable scenarios
Step 3 - Data Sources
Primary Research
- Web Analytics
- Survey Reports
- Research Institute
- Latest Research Reports
- Opinion Leaders
Secondary Research
- Annual Reports
- White Paper
- Latest Press Release
- Industry Association
- Paid Database
- Investor Presentations

Step 4 - Data Triangulation
Involves using different sources of information in order to increase the validity of a study
These sources are likely to be stakeholders in a program - participants, other researchers, program staff, other community members, and so on.
Then we put all data in single framework & apply various statistical tools to find out the dynamic on the market.
During the analysis stage, feedback from the stakeholder groups would be compared to determine areas of agreement as well as areas of divergence
