

Key Insights
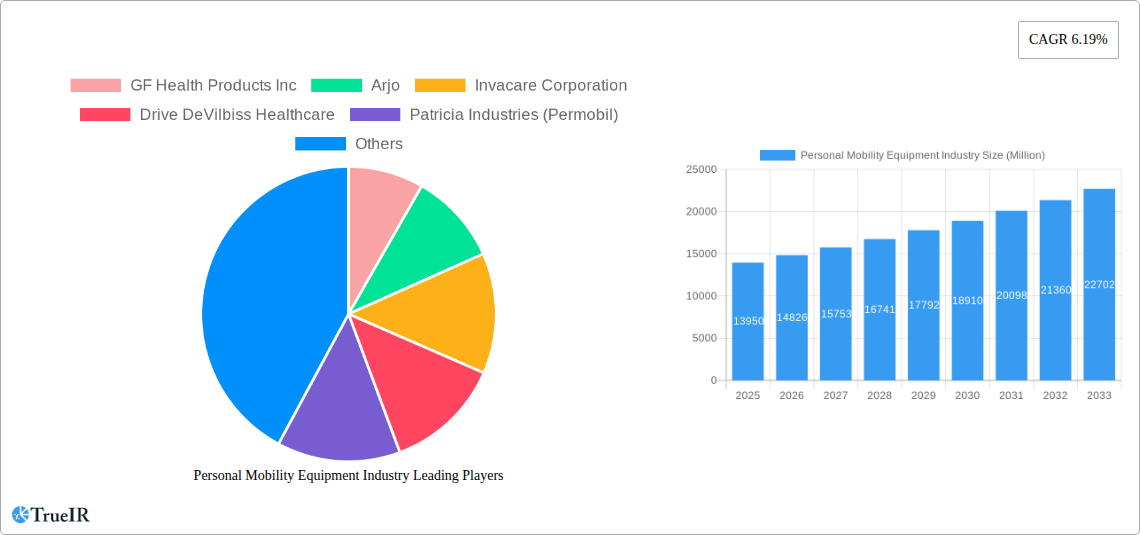
The global Personal Mobility Equipment (PME) market, valued at $13.95 billion in 2025, is projected to experience robust growth, driven by a rising geriatric population, increasing prevalence of chronic diseases like arthritis and stroke leading to mobility impairments, and advancements in PME technology offering enhanced comfort and functionality. The market's Compound Annual Growth Rate (CAGR) of 6.19% from 2019 to 2024 suggests a continued upward trajectory through 2033. Key drivers include the growing demand for lightweight and easily maneuverable wheelchairs, the increasing adoption of power mobility aids like scooters, and a shift towards home-based healthcare, favoring convenient and accessible PME solutions. Market segmentation reveals a significant share held by wheelchairs, followed by walking aids and scooters. Hospitals and clinics represent a substantial end-user segment, alongside the rapidly expanding home care sector, reflecting the preference for assisted living and independent mobility within the comfort of one's home. Leading companies like Invacare, Pride Mobility, and Sunrise Medical are actively shaping the market through innovation and expansion, while smaller players focus on niche product segments or specialized technological advancements.
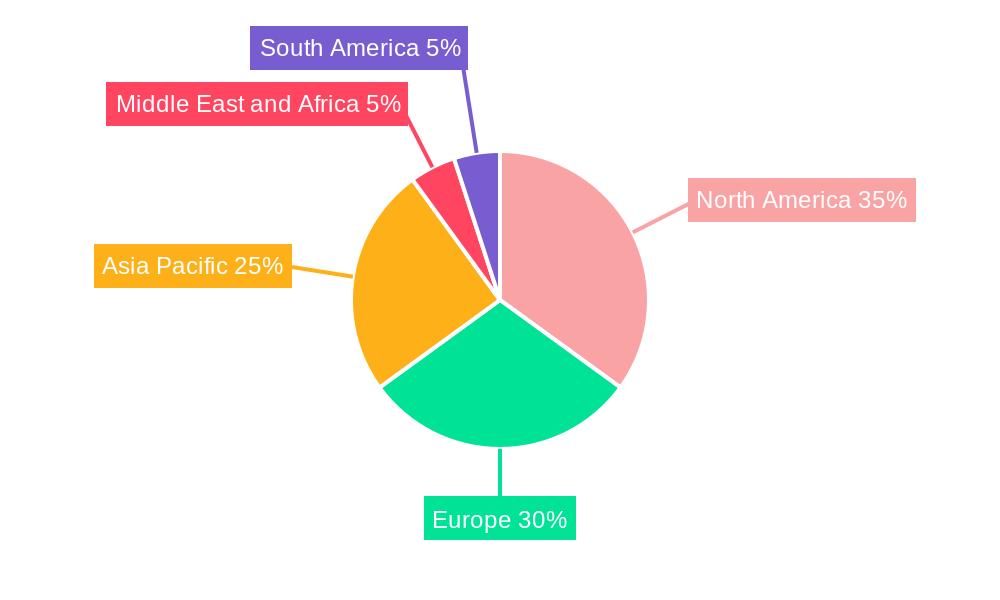
The geographic distribution of the market showcases strong performance in North America and Europe, attributable to higher healthcare expenditure and greater awareness of PME benefits. However, the Asia-Pacific region is expected to witness significant growth, driven by rising disposable incomes, improving healthcare infrastructure, and an expanding elderly population. While regulatory hurdles and high costs associated with advanced PME technologies can pose challenges, continuous technological advancements focusing on improved safety features, lightweight materials, and enhanced user experience are expected to mitigate these constraints, leading to market expansion. The market's future hinges on the successful integration of assistive technologies, incorporating smart features and data analytics, and tailoring products to meet the unique needs of diverse user populations. This combination of technological innovation, demographic trends, and increasing healthcare awareness will propel the PME market to significant heights in the coming years.
Personal Mobility Equipment Industry Report: 2019-2033 Forecast
This comprehensive report provides a detailed analysis of the Personal Mobility Equipment (PME) industry, encompassing market size, trends, competitive landscape, and future outlook. With a focus on key segments like wheelchairs, walking aids, and scooters, this report is essential for investors, manufacturers, healthcare providers, and anyone interested in this rapidly evolving market. The study period covers 2019-2033, with a base year of 2025 and a forecast period of 2025-2033. The report projects a market value exceeding xx Million by 2033.
Personal Mobility Equipment Industry Market Structure & Competitive Landscape
The PME market is characterized by a moderately concentrated landscape, with several major players holding significant market share. The top 10 companies—GF Health Products Inc, Arjo, Invacare Corporation, Drive DeVilbiss Healthcare, Patricia Industries (Permobil), Rollz International, Kaye Products Inc, Ottobock, Stryker Corporation, and Pride Mobility Products Corp—account for approximately xx% of the global market in 2025 (estimated). However, the presence of numerous smaller players and the potential for new entrants indicates a dynamic competitive environment.
Market Concentration: The Herfindahl-Hirschman Index (HHI) for the PME market is estimated at xx in 2025, suggesting a moderately concentrated market.
Innovation Drivers: Technological advancements, including lightweight materials, advanced battery technology, and smart features are driving product innovation. Regulatory changes promoting accessibility and increasing demand from aging populations are further stimulating innovation.
Regulatory Impacts: Government regulations regarding safety, accessibility, and reimbursement policies significantly influence market dynamics. Varying regulations across different countries create both opportunities and challenges for manufacturers.
Product Substitutes: While PME devices are often essential, alternative solutions such as assistive technologies and home modifications exist. The competitive pressure from these substitutes remains moderate.
End-User Segmentation: The market is primarily segmented into Hospitals and Clinics, Home Care Settings, and Other End Users. The growth of the home care sector is expected to significantly impact the overall PME market.
M&A Trends: The PME industry has witnessed a moderate level of mergers and acquisitions in recent years, primarily driven by companies seeking to expand their product portfolios and geographic reach. The total value of M&A transactions in the past five years is estimated at xx Million.
Personal Mobility Equipment Industry Market Trends & Opportunities
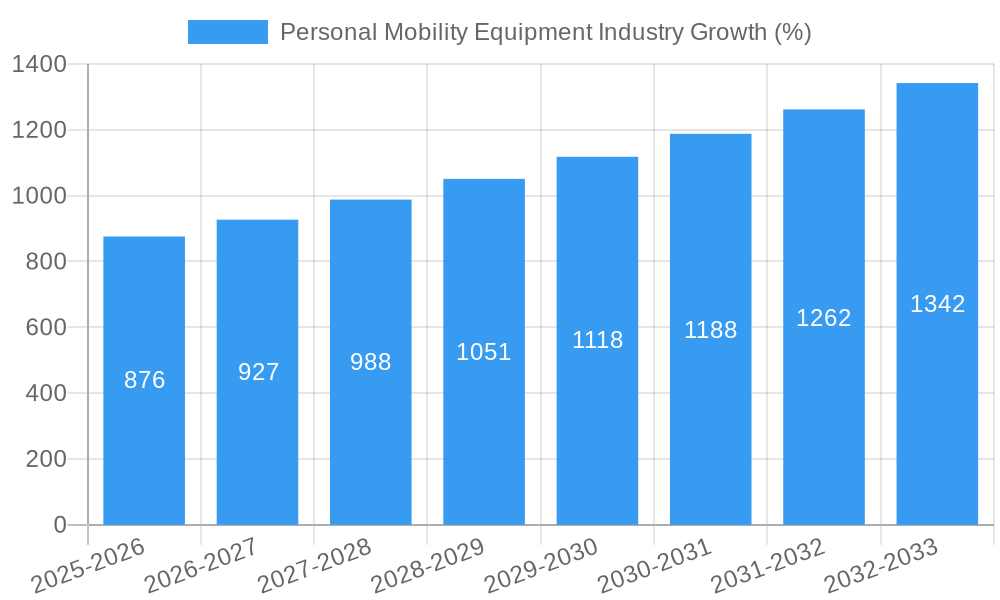
The global PME market is experiencing robust growth, driven by a confluence of factors. The aging global population, rising prevalence of chronic diseases leading to mobility impairments, and increasing healthcare expenditure are major contributors to this growth. The market size is projected to reach xx Million by 2033, exhibiting a Compound Annual Growth Rate (CAGR) of xx% during the forecast period. Technological advancements, such as the integration of smart features and improved battery technologies, are creating new market opportunities. Consumer preferences are shifting toward lightweight, easy-to-use, and aesthetically pleasing products. Increased demand for personalized PME solutions and customized care plans further shapes the market. The competitive landscape is characterized by both established players and emerging companies, leading to increased innovation and product diversification. Market penetration rates for various PME products vary significantly across different regions and end-user segments. For example, wheelchair penetration in developed nations is comparatively higher than in developing regions.
Dominant Markets & Segments in Personal Mobility Equipment Industry
The North American market holds a dominant position in the global PME industry, driven by high healthcare expenditure, a large aging population, and favorable regulatory environments. Within the product segments, the wheelchair market currently commands the largest share, followed by walking aids and scooters.
Key Growth Drivers:
- Aging Population: The rapidly aging population globally, particularly in developed countries, is a primary driver.
- Increased Healthcare Spending: Rising healthcare spending is facilitating greater access to PME devices.
- Technological Advancements: Continuous technological advancements are improving product functionality and ease of use.
- Government Initiatives: Government policies and initiatives aimed at improving accessibility for people with disabilities are boosting market growth.
Market Dominance Analysis: The North American market exhibits robust growth due to factors such as high per capita income, favorable healthcare infrastructure, and a substantial aging population. This segment is projected to maintain its dominance throughout the forecast period. Within the product segment, wheelchairs account for the largest market share due to their extensive applicability across various mobility challenges.
Personal Mobility Equipment Industry Product Analysis
Recent innovations in PME focus on lightweight designs, enhanced maneuverability, and smart features. Electric wheelchairs with improved battery life and intuitive controls are gaining popularity. Walking aids are incorporating advanced materials and ergonomic designs for enhanced comfort and stability. Scooters are becoming more compact and portable, meeting the diverse needs of users. These technological advancements are driving market penetration and expanding the overall market size. The integration of smart technologies, such as GPS tracking and telehealth capabilities, is shaping future product development and market differentiation.
Key Drivers, Barriers & Challenges in Personal Mobility Equipment Industry
Key Drivers:
- Technological advancements leading to lighter, more efficient, and user-friendly devices.
- Growing elderly population and increasing prevalence of chronic diseases necessitating PME.
- Favorable government regulations and initiatives promoting accessibility.
Key Challenges:
- High manufacturing costs impacting affordability and accessibility, particularly in developing markets. This is estimated to reduce market penetration by approximately xx% in certain regions.
- Stringent regulatory approvals and certifications create barriers to entry and increase time-to-market for new products.
- Intense competition from established players and the emergence of new competitors.
Growth Drivers in the Personal Mobility Equipment Industry Market
The PME market is propelled by a combination of factors, including the aging global population, rising healthcare expenditures, and technological advancements. Government initiatives promoting accessibility and inclusive design also play a vital role. These factors collectively contribute to the expanding demand for PME devices.
Challenges Impacting Personal Mobility Equipment Industry Growth
Significant challenges include high manufacturing and distribution costs limiting affordability, stringent regulatory hurdles increasing time-to-market, and intense competition among industry players. Supply chain disruptions and material cost fluctuations also represent considerable hurdles.
Key Players Shaping the Personal Mobility Equipment Industry Market
- GF Health Products Inc
- Arjo
- Invacare Corporation
- Drive DeVilbiss Healthcare
- Patricia Industries (Permobil)
- Rollz International
- Kaye Products Inc
- Ottobock
- Stryker Corporation
- Performance Health
- Pride Mobility Products Corp
- Medline Industries Inc
- Sunrise Medical (US) LLC
Significant Personal Mobility Equipment Industry Milestones
- August 2021: Falcon Mobility unveils the Ultra-Lite 2 electric wheelchair, focusing on affordability and lightweight design. This launch signifies a shift towards more accessible and user-friendly PME.
- July 2021: The International Air Transport Association (IATA) establishes a Global Mobility Aids Action Group to improve the transport of mobility aids. This highlights growing concerns about accessibility and travel for PME users.
Future Outlook for Personal Mobility Equipment Industry Market
The PME market is poised for continued growth, driven by technological innovation, demographic shifts, and evolving healthcare needs. Strategic partnerships, expansion into emerging markets, and focus on personalized solutions will be crucial for success. The market presents significant opportunities for companies that can adapt to evolving consumer preferences and effectively navigate regulatory landscapes.
Personal Mobility Equipment Industry Segmentation
-
1. Product
- 1.1. Wheelchair
- 1.2. Walking Aids
- 1.3. Scooters
- 1.4. Other Products
-
2. End User
- 2.1. Hospitals and Clinics
- 2.2. Home Care Settings
- 2.3. Other End Users
Personal Mobility Equipment Industry Segmentation By Geography
-
1. North America
- 1.1. United States
- 1.2. Canada
- 1.3. Mexico
-
2. Europe
- 2.1. Germany
- 2.2. United Kingdom
- 2.3. France
- 2.4. Italy
- 2.5. Spain
- 2.6. Rest of Europe
-
3. Asia Pacific
- 3.1. China
- 3.2. Japan
- 3.3. India
- 3.4. Australia
- 3.5. South Korea
- 3.6. Rest of Asia Pacific
-
4. Middle East and Africa
- 4.1. GCC
- 4.2. South Africa
- 4.3. Rest of Middle East and Africa
-
5. South America
- 5.1. Brazil
- 5.2. Argentina
- 5.3. Rest of South America
Personal Mobility Equipment Industry REPORT HIGHLIGHTS
| Aspects | Details |
|---|---|
| Study Period | 2019-2033 |
| Base Year | 2024 |
| Estimated Year | 2025 |
| Forecast Period | 2025-2033 |
| Historical Period | 2019-2024 |
| Growth Rate | CAGR of 6.19% from 2019-2033 |
| Segmentation |
|
Table of Contents
- 1. Introduction
- 1.1. Research Scope
- 1.2. Market Segmentation
- 1.3. Research Methodology
- 1.4. Definitions and Assumptions
- 2. Executive Summary
- 2.1. Introduction
- 3. Market Dynamics
- 3.1. Introduction
- 3.2. Market Drivers
- 3.2.1. Increase in Demand for Personal Mobility Devices in Elderly Population; Technological Advancements in the Devices
- 3.3. Market Restrains
- 3.3.1. High Cost of the Devices
- 3.4. Market Trends
- 3.4.1. Wheelchairs Emerged as the Largest Segment in the Personal Mobility Devices Market
- 4. Market Factor Analysis
- 4.1. Porters Five Forces
- 4.2. Supply/Value Chain
- 4.3. PESTEL analysis
- 4.4. Market Entropy
- 4.5. Patent/Trademark Analysis
- 5. Global Personal Mobility Equipment Industry Analysis, Insights and Forecast, 2019-2031
- 5.1. Market Analysis, Insights and Forecast - by Product
- 5.1.1. Wheelchair
- 5.1.2. Walking Aids
- 5.1.3. Scooters
- 5.1.4. Other Products
- 5.2. Market Analysis, Insights and Forecast - by End User
- 5.2.1. Hospitals and Clinics
- 5.2.2. Home Care Settings
- 5.2.3. Other End Users
- 5.3. Market Analysis, Insights and Forecast - by Region
- 5.3.1. North America
- 5.3.2. Europe
- 5.3.3. Asia Pacific
- 5.3.4. Middle East and Africa
- 5.3.5. South America
- 5.1. Market Analysis, Insights and Forecast - by Product
- 6. North America Personal Mobility Equipment Industry Analysis, Insights and Forecast, 2019-2031
- 6.1. Market Analysis, Insights and Forecast - by Product
- 6.1.1. Wheelchair
- 6.1.2. Walking Aids
- 6.1.3. Scooters
- 6.1.4. Other Products
- 6.2. Market Analysis, Insights and Forecast - by End User
- 6.2.1. Hospitals and Clinics
- 6.2.2. Home Care Settings
- 6.2.3. Other End Users
- 6.1. Market Analysis, Insights and Forecast - by Product
- 7. Europe Personal Mobility Equipment Industry Analysis, Insights and Forecast, 2019-2031
- 7.1. Market Analysis, Insights and Forecast - by Product
- 7.1.1. Wheelchair
- 7.1.2. Walking Aids
- 7.1.3. Scooters
- 7.1.4. Other Products
- 7.2. Market Analysis, Insights and Forecast - by End User
- 7.2.1. Hospitals and Clinics
- 7.2.2. Home Care Settings
- 7.2.3. Other End Users
- 7.1. Market Analysis, Insights and Forecast - by Product
- 8. Asia Pacific Personal Mobility Equipment Industry Analysis, Insights and Forecast, 2019-2031
- 8.1. Market Analysis, Insights and Forecast - by Product
- 8.1.1. Wheelchair
- 8.1.2. Walking Aids
- 8.1.3. Scooters
- 8.1.4. Other Products
- 8.2. Market Analysis, Insights and Forecast - by End User
- 8.2.1. Hospitals and Clinics
- 8.2.2. Home Care Settings
- 8.2.3. Other End Users
- 8.1. Market Analysis, Insights and Forecast - by Product
- 9. Middle East and Africa Personal Mobility Equipment Industry Analysis, Insights and Forecast, 2019-2031
- 9.1. Market Analysis, Insights and Forecast - by Product
- 9.1.1. Wheelchair
- 9.1.2. Walking Aids
- 9.1.3. Scooters
- 9.1.4. Other Products
- 9.2. Market Analysis, Insights and Forecast - by End User
- 9.2.1. Hospitals and Clinics
- 9.2.2. Home Care Settings
- 9.2.3. Other End Users
- 9.1. Market Analysis, Insights and Forecast - by Product
- 10. South America Personal Mobility Equipment Industry Analysis, Insights and Forecast, 2019-2031
- 10.1. Market Analysis, Insights and Forecast - by Product
- 10.1.1. Wheelchair
- 10.1.2. Walking Aids
- 10.1.3. Scooters
- 10.1.4. Other Products
- 10.2. Market Analysis, Insights and Forecast - by End User
- 10.2.1. Hospitals and Clinics
- 10.2.2. Home Care Settings
- 10.2.3. Other End Users
- 10.1. Market Analysis, Insights and Forecast - by Product
- 11. North America Personal Mobility Equipment Industry Analysis, Insights and Forecast, 2019-2031
- 11.1. Market Analysis, Insights and Forecast - By Country/Sub-region
- 11.1.1. undefined
- 12. Europe Personal Mobility Equipment Industry Analysis, Insights and Forecast, 2019-2031
- 12.1. Market Analysis, Insights and Forecast - By Country/Sub-region
- 12.1.1. undefined
- 13. Asia Pacific Personal Mobility Equipment Industry Analysis, Insights and Forecast, 2019-2031
- 13.1. Market Analysis, Insights and Forecast - By Country/Sub-region
- 13.1.1. undefined
- 14. Middle East and Africa Personal Mobility Equipment Industry Analysis, Insights and Forecast, 2019-2031
- 14.1. Market Analysis, Insights and Forecast - By Country/Sub-region
- 14.1.1. undefined
- 15. South America Personal Mobility Equipment Industry Analysis, Insights and Forecast, 2019-2031
- 15.1. Market Analysis, Insights and Forecast - By Country/Sub-region
- 15.1.1. undefined
- 16. Competitive Analysis
- 16.1. Global Market Share Analysis 2024
- 16.2. Company Profiles
- 16.2.1 GF Health Products Inc
- 16.2.1.1. Overview
- 16.2.1.2. Products
- 16.2.1.3. SWOT Analysis
- 16.2.1.4. Recent Developments
- 16.2.1.5. Financials (Based on Availability)
- 16.2.2 Arjo
- 16.2.2.1. Overview
- 16.2.2.2. Products
- 16.2.2.3. SWOT Analysis
- 16.2.2.4. Recent Developments
- 16.2.2.5. Financials (Based on Availability)
- 16.2.3 Invacare Corporation
- 16.2.3.1. Overview
- 16.2.3.2. Products
- 16.2.3.3. SWOT Analysis
- 16.2.3.4. Recent Developments
- 16.2.3.5. Financials (Based on Availability)
- 16.2.4 Drive DeVilbiss Healthcare
- 16.2.4.1. Overview
- 16.2.4.2. Products
- 16.2.4.3. SWOT Analysis
- 16.2.4.4. Recent Developments
- 16.2.4.5. Financials (Based on Availability)
- 16.2.5 Patricia Industries (Permobil)
- 16.2.5.1. Overview
- 16.2.5.2. Products
- 16.2.5.3. SWOT Analysis
- 16.2.5.4. Recent Developments
- 16.2.5.5. Financials (Based on Availability)
- 16.2.6 Rollz International
- 16.2.6.1. Overview
- 16.2.6.2. Products
- 16.2.6.3. SWOT Analysis
- 16.2.6.4. Recent Developments
- 16.2.6.5. Financials (Based on Availability)
- 16.2.7 Kaye Products Inc
- 16.2.7.1. Overview
- 16.2.7.2. Products
- 16.2.7.3. SWOT Analysis
- 16.2.7.4. Recent Developments
- 16.2.7.5. Financials (Based on Availability)
- 16.2.8 Ottobock
- 16.2.8.1. Overview
- 16.2.8.2. Products
- 16.2.8.3. SWOT Analysis
- 16.2.8.4. Recent Developments
- 16.2.8.5. Financials (Based on Availability)
- 16.2.9 Stryker Corporation
- 16.2.9.1. Overview
- 16.2.9.2. Products
- 16.2.9.3. SWOT Analysis
- 16.2.9.4. Recent Developments
- 16.2.9.5. Financials (Based on Availability)
- 16.2.10 Performance Health
- 16.2.10.1. Overview
- 16.2.10.2. Products
- 16.2.10.3. SWOT Analysis
- 16.2.10.4. Recent Developments
- 16.2.10.5. Financials (Based on Availability)
- 16.2.11 Pride Mobility Products Corp
- 16.2.11.1. Overview
- 16.2.11.2. Products
- 16.2.11.3. SWOT Analysis
- 16.2.11.4. Recent Developments
- 16.2.11.5. Financials (Based on Availability)
- 16.2.12 Medline Industries Inc
- 16.2.12.1. Overview
- 16.2.12.2. Products
- 16.2.12.3. SWOT Analysis
- 16.2.12.4. Recent Developments
- 16.2.12.5. Financials (Based on Availability)
- 16.2.13 Sunrise Medical (US) LLC
- 16.2.13.1. Overview
- 16.2.13.2. Products
- 16.2.13.3. SWOT Analysis
- 16.2.13.4. Recent Developments
- 16.2.13.5. Financials (Based on Availability)
- 16.2.1 GF Health Products Inc
List of Figures
- Figure 1: Global Personal Mobility Equipment Industry Revenue Breakdown (Million, %) by Region 2024 & 2032
- Figure 2: Global Personal Mobility Equipment Industry Volume Breakdown (K Unit, %) by Region 2024 & 2032
- Figure 3: North America Personal Mobility Equipment Industry Revenue (Million), by Country 2024 & 2032
- Figure 4: North America Personal Mobility Equipment Industry Volume (K Unit), by Country 2024 & 2032
- Figure 5: North America Personal Mobility Equipment Industry Revenue Share (%), by Country 2024 & 2032
- Figure 6: North America Personal Mobility Equipment Industry Volume Share (%), by Country 2024 & 2032
- Figure 7: Europe Personal Mobility Equipment Industry Revenue (Million), by Country 2024 & 2032
- Figure 8: Europe Personal Mobility Equipment Industry Volume (K Unit), by Country 2024 & 2032
- Figure 9: Europe Personal Mobility Equipment Industry Revenue Share (%), by Country 2024 & 2032
- Figure 10: Europe Personal Mobility Equipment Industry Volume Share (%), by Country 2024 & 2032
- Figure 11: Asia Pacific Personal Mobility Equipment Industry Revenue (Million), by Country 2024 & 2032
- Figure 12: Asia Pacific Personal Mobility Equipment Industry Volume (K Unit), by Country 2024 & 2032
- Figure 13: Asia Pacific Personal Mobility Equipment Industry Revenue Share (%), by Country 2024 & 2032
- Figure 14: Asia Pacific Personal Mobility Equipment Industry Volume Share (%), by Country 2024 & 2032
- Figure 15: Middle East and Africa Personal Mobility Equipment Industry Revenue (Million), by Country 2024 & 2032
- Figure 16: Middle East and Africa Personal Mobility Equipment Industry Volume (K Unit), by Country 2024 & 2032
- Figure 17: Middle East and Africa Personal Mobility Equipment Industry Revenue Share (%), by Country 2024 & 2032
- Figure 18: Middle East and Africa Personal Mobility Equipment Industry Volume Share (%), by Country 2024 & 2032
- Figure 19: South America Personal Mobility Equipment Industry Revenue (Million), by Country 2024 & 2032
- Figure 20: South America Personal Mobility Equipment Industry Volume (K Unit), by Country 2024 & 2032
- Figure 21: South America Personal Mobility Equipment Industry Revenue Share (%), by Country 2024 & 2032
- Figure 22: South America Personal Mobility Equipment Industry Volume Share (%), by Country 2024 & 2032
- Figure 23: North America Personal Mobility Equipment Industry Revenue (Million), by Product 2024 & 2032
- Figure 24: North America Personal Mobility Equipment Industry Volume (K Unit), by Product 2024 & 2032
- Figure 25: North America Personal Mobility Equipment Industry Revenue Share (%), by Product 2024 & 2032
- Figure 26: North America Personal Mobility Equipment Industry Volume Share (%), by Product 2024 & 2032
- Figure 27: North America Personal Mobility Equipment Industry Revenue (Million), by End User 2024 & 2032
- Figure 28: North America Personal Mobility Equipment Industry Volume (K Unit), by End User 2024 & 2032
- Figure 29: North America Personal Mobility Equipment Industry Revenue Share (%), by End User 2024 & 2032
- Figure 30: North America Personal Mobility Equipment Industry Volume Share (%), by End User 2024 & 2032
- Figure 31: North America Personal Mobility Equipment Industry Revenue (Million), by Country 2024 & 2032
- Figure 32: North America Personal Mobility Equipment Industry Volume (K Unit), by Country 2024 & 2032
- Figure 33: North America Personal Mobility Equipment Industry Revenue Share (%), by Country 2024 & 2032
- Figure 34: North America Personal Mobility Equipment Industry Volume Share (%), by Country 2024 & 2032
- Figure 35: Europe Personal Mobility Equipment Industry Revenue (Million), by Product 2024 & 2032
- Figure 36: Europe Personal Mobility Equipment Industry Volume (K Unit), by Product 2024 & 2032
- Figure 37: Europe Personal Mobility Equipment Industry Revenue Share (%), by Product 2024 & 2032
- Figure 38: Europe Personal Mobility Equipment Industry Volume Share (%), by Product 2024 & 2032
- Figure 39: Europe Personal Mobility Equipment Industry Revenue (Million), by End User 2024 & 2032
- Figure 40: Europe Personal Mobility Equipment Industry Volume (K Unit), by End User 2024 & 2032
- Figure 41: Europe Personal Mobility Equipment Industry Revenue Share (%), by End User 2024 & 2032
- Figure 42: Europe Personal Mobility Equipment Industry Volume Share (%), by End User 2024 & 2032
- Figure 43: Europe Personal Mobility Equipment Industry Revenue (Million), by Country 2024 & 2032
- Figure 44: Europe Personal Mobility Equipment Industry Volume (K Unit), by Country 2024 & 2032
- Figure 45: Europe Personal Mobility Equipment Industry Revenue Share (%), by Country 2024 & 2032
- Figure 46: Europe Personal Mobility Equipment Industry Volume Share (%), by Country 2024 & 2032
- Figure 47: Asia Pacific Personal Mobility Equipment Industry Revenue (Million), by Product 2024 & 2032
- Figure 48: Asia Pacific Personal Mobility Equipment Industry Volume (K Unit), by Product 2024 & 2032
- Figure 49: Asia Pacific Personal Mobility Equipment Industry Revenue Share (%), by Product 2024 & 2032
- Figure 50: Asia Pacific Personal Mobility Equipment Industry Volume Share (%), by Product 2024 & 2032
- Figure 51: Asia Pacific Personal Mobility Equipment Industry Revenue (Million), by End User 2024 & 2032
- Figure 52: Asia Pacific Personal Mobility Equipment Industry Volume (K Unit), by End User 2024 & 2032
- Figure 53: Asia Pacific Personal Mobility Equipment Industry Revenue Share (%), by End User 2024 & 2032
- Figure 54: Asia Pacific Personal Mobility Equipment Industry Volume Share (%), by End User 2024 & 2032
- Figure 55: Asia Pacific Personal Mobility Equipment Industry Revenue (Million), by Country 2024 & 2032
- Figure 56: Asia Pacific Personal Mobility Equipment Industry Volume (K Unit), by Country 2024 & 2032
- Figure 57: Asia Pacific Personal Mobility Equipment Industry Revenue Share (%), by Country 2024 & 2032
- Figure 58: Asia Pacific Personal Mobility Equipment Industry Volume Share (%), by Country 2024 & 2032
- Figure 59: Middle East and Africa Personal Mobility Equipment Industry Revenue (Million), by Product 2024 & 2032
- Figure 60: Middle East and Africa Personal Mobility Equipment Industry Volume (K Unit), by Product 2024 & 2032
- Figure 61: Middle East and Africa Personal Mobility Equipment Industry Revenue Share (%), by Product 2024 & 2032
- Figure 62: Middle East and Africa Personal Mobility Equipment Industry Volume Share (%), by Product 2024 & 2032
- Figure 63: Middle East and Africa Personal Mobility Equipment Industry Revenue (Million), by End User 2024 & 2032
- Figure 64: Middle East and Africa Personal Mobility Equipment Industry Volume (K Unit), by End User 2024 & 2032
- Figure 65: Middle East and Africa Personal Mobility Equipment Industry Revenue Share (%), by End User 2024 & 2032
- Figure 66: Middle East and Africa Personal Mobility Equipment Industry Volume Share (%), by End User 2024 & 2032
- Figure 67: Middle East and Africa Personal Mobility Equipment Industry Revenue (Million), by Country 2024 & 2032
- Figure 68: Middle East and Africa Personal Mobility Equipment Industry Volume (K Unit), by Country 2024 & 2032
- Figure 69: Middle East and Africa Personal Mobility Equipment Industry Revenue Share (%), by Country 2024 & 2032
- Figure 70: Middle East and Africa Personal Mobility Equipment Industry Volume Share (%), by Country 2024 & 2032
- Figure 71: South America Personal Mobility Equipment Industry Revenue (Million), by Product 2024 & 2032
- Figure 72: South America Personal Mobility Equipment Industry Volume (K Unit), by Product 2024 & 2032
- Figure 73: South America Personal Mobility Equipment Industry Revenue Share (%), by Product 2024 & 2032
- Figure 74: South America Personal Mobility Equipment Industry Volume Share (%), by Product 2024 & 2032
- Figure 75: South America Personal Mobility Equipment Industry Revenue (Million), by End User 2024 & 2032
- Figure 76: South America Personal Mobility Equipment Industry Volume (K Unit), by End User 2024 & 2032
- Figure 77: South America Personal Mobility Equipment Industry Revenue Share (%), by End User 2024 & 2032
- Figure 78: South America Personal Mobility Equipment Industry Volume Share (%), by End User 2024 & 2032
- Figure 79: South America Personal Mobility Equipment Industry Revenue (Million), by Country 2024 & 2032
- Figure 80: South America Personal Mobility Equipment Industry Volume (K Unit), by Country 2024 & 2032
- Figure 81: South America Personal Mobility Equipment Industry Revenue Share (%), by Country 2024 & 2032
- Figure 82: South America Personal Mobility Equipment Industry Volume Share (%), by Country 2024 & 2032
List of Tables
- Table 1: Global Personal Mobility Equipment Industry Revenue Million Forecast, by Region 2019 & 2032
- Table 2: Global Personal Mobility Equipment Industry Volume K Unit Forecast, by Region 2019 & 2032
- Table 3: Global Personal Mobility Equipment Industry Revenue Million Forecast, by Product 2019 & 2032
- Table 4: Global Personal Mobility Equipment Industry Volume K Unit Forecast, by Product 2019 & 2032
- Table 5: Global Personal Mobility Equipment Industry Revenue Million Forecast, by End User 2019 & 2032
- Table 6: Global Personal Mobility Equipment Industry Volume K Unit Forecast, by End User 2019 & 2032
- Table 7: Global Personal Mobility Equipment Industry Revenue Million Forecast, by Region 2019 & 2032
- Table 8: Global Personal Mobility Equipment Industry Volume K Unit Forecast, by Region 2019 & 2032
- Table 9: Global Personal Mobility Equipment Industry Revenue Million Forecast, by Country 2019 & 2032
- Table 10: Global Personal Mobility Equipment Industry Volume K Unit Forecast, by Country 2019 & 2032
- Table 11: Global Personal Mobility Equipment Industry Revenue Million Forecast, by Country 2019 & 2032
- Table 12: Global Personal Mobility Equipment Industry Volume K Unit Forecast, by Country 2019 & 2032
- Table 13: Global Personal Mobility Equipment Industry Revenue Million Forecast, by Country 2019 & 2032
- Table 14: Global Personal Mobility Equipment Industry Volume K Unit Forecast, by Country 2019 & 2032
- Table 15: Global Personal Mobility Equipment Industry Revenue Million Forecast, by Country 2019 & 2032
- Table 16: Global Personal Mobility Equipment Industry Volume K Unit Forecast, by Country 2019 & 2032
- Table 17: Global Personal Mobility Equipment Industry Revenue Million Forecast, by Country 2019 & 2032
- Table 18: Global Personal Mobility Equipment Industry Volume K Unit Forecast, by Country 2019 & 2032
- Table 19: Global Personal Mobility Equipment Industry Revenue Million Forecast, by Product 2019 & 2032
- Table 20: Global Personal Mobility Equipment Industry Volume K Unit Forecast, by Product 2019 & 2032
- Table 21: Global Personal Mobility Equipment Industry Revenue Million Forecast, by End User 2019 & 2032
- Table 22: Global Personal Mobility Equipment Industry Volume K Unit Forecast, by End User 2019 & 2032
- Table 23: Global Personal Mobility Equipment Industry Revenue Million Forecast, by Country 2019 & 2032
- Table 24: Global Personal Mobility Equipment Industry Volume K Unit Forecast, by Country 2019 & 2032
- Table 25: United States Personal Mobility Equipment Industry Revenue (Million) Forecast, by Application 2019 & 2032
- Table 26: United States Personal Mobility Equipment Industry Volume (K Unit) Forecast, by Application 2019 & 2032
- Table 27: Canada Personal Mobility Equipment Industry Revenue (Million) Forecast, by Application 2019 & 2032
- Table 28: Canada Personal Mobility Equipment Industry Volume (K Unit) Forecast, by Application 2019 & 2032
- Table 29: Mexico Personal Mobility Equipment Industry Revenue (Million) Forecast, by Application 2019 & 2032
- Table 30: Mexico Personal Mobility Equipment Industry Volume (K Unit) Forecast, by Application 2019 & 2032
- Table 31: Global Personal Mobility Equipment Industry Revenue Million Forecast, by Product 2019 & 2032
- Table 32: Global Personal Mobility Equipment Industry Volume K Unit Forecast, by Product 2019 & 2032
- Table 33: Global Personal Mobility Equipment Industry Revenue Million Forecast, by End User 2019 & 2032
- Table 34: Global Personal Mobility Equipment Industry Volume K Unit Forecast, by End User 2019 & 2032
- Table 35: Global Personal Mobility Equipment Industry Revenue Million Forecast, by Country 2019 & 2032
- Table 36: Global Personal Mobility Equipment Industry Volume K Unit Forecast, by Country 2019 & 2032
- Table 37: Germany Personal Mobility Equipment Industry Revenue (Million) Forecast, by Application 2019 & 2032
- Table 38: Germany Personal Mobility Equipment Industry Volume (K Unit) Forecast, by Application 2019 & 2032
- Table 39: United Kingdom Personal Mobility Equipment Industry Revenue (Million) Forecast, by Application 2019 & 2032
- Table 40: United Kingdom Personal Mobility Equipment Industry Volume (K Unit) Forecast, by Application 2019 & 2032
- Table 41: France Personal Mobility Equipment Industry Revenue (Million) Forecast, by Application 2019 & 2032
- Table 42: France Personal Mobility Equipment Industry Volume (K Unit) Forecast, by Application 2019 & 2032
- Table 43: Italy Personal Mobility Equipment Industry Revenue (Million) Forecast, by Application 2019 & 2032
- Table 44: Italy Personal Mobility Equipment Industry Volume (K Unit) Forecast, by Application 2019 & 2032
- Table 45: Spain Personal Mobility Equipment Industry Revenue (Million) Forecast, by Application 2019 & 2032
- Table 46: Spain Personal Mobility Equipment Industry Volume (K Unit) Forecast, by Application 2019 & 2032
- Table 47: Rest of Europe Personal Mobility Equipment Industry Revenue (Million) Forecast, by Application 2019 & 2032
- Table 48: Rest of Europe Personal Mobility Equipment Industry Volume (K Unit) Forecast, by Application 2019 & 2032
- Table 49: Global Personal Mobility Equipment Industry Revenue Million Forecast, by Product 2019 & 2032
- Table 50: Global Personal Mobility Equipment Industry Volume K Unit Forecast, by Product 2019 & 2032
- Table 51: Global Personal Mobility Equipment Industry Revenue Million Forecast, by End User 2019 & 2032
- Table 52: Global Personal Mobility Equipment Industry Volume K Unit Forecast, by End User 2019 & 2032
- Table 53: Global Personal Mobility Equipment Industry Revenue Million Forecast, by Country 2019 & 2032
- Table 54: Global Personal Mobility Equipment Industry Volume K Unit Forecast, by Country 2019 & 2032
- Table 55: China Personal Mobility Equipment Industry Revenue (Million) Forecast, by Application 2019 & 2032
- Table 56: China Personal Mobility Equipment Industry Volume (K Unit) Forecast, by Application 2019 & 2032
- Table 57: Japan Personal Mobility Equipment Industry Revenue (Million) Forecast, by Application 2019 & 2032
- Table 58: Japan Personal Mobility Equipment Industry Volume (K Unit) Forecast, by Application 2019 & 2032
- Table 59: India Personal Mobility Equipment Industry Revenue (Million) Forecast, by Application 2019 & 2032
- Table 60: India Personal Mobility Equipment Industry Volume (K Unit) Forecast, by Application 2019 & 2032
- Table 61: Australia Personal Mobility Equipment Industry Revenue (Million) Forecast, by Application 2019 & 2032
- Table 62: Australia Personal Mobility Equipment Industry Volume (K Unit) Forecast, by Application 2019 & 2032
- Table 63: South Korea Personal Mobility Equipment Industry Revenue (Million) Forecast, by Application 2019 & 2032
- Table 64: South Korea Personal Mobility Equipment Industry Volume (K Unit) Forecast, by Application 2019 & 2032
- Table 65: Rest of Asia Pacific Personal Mobility Equipment Industry Revenue (Million) Forecast, by Application 2019 & 2032
- Table 66: Rest of Asia Pacific Personal Mobility Equipment Industry Volume (K Unit) Forecast, by Application 2019 & 2032
- Table 67: Global Personal Mobility Equipment Industry Revenue Million Forecast, by Product 2019 & 2032
- Table 68: Global Personal Mobility Equipment Industry Volume K Unit Forecast, by Product 2019 & 2032
- Table 69: Global Personal Mobility Equipment Industry Revenue Million Forecast, by End User 2019 & 2032
- Table 70: Global Personal Mobility Equipment Industry Volume K Unit Forecast, by End User 2019 & 2032
- Table 71: Global Personal Mobility Equipment Industry Revenue Million Forecast, by Country 2019 & 2032
- Table 72: Global Personal Mobility Equipment Industry Volume K Unit Forecast, by Country 2019 & 2032
- Table 73: GCC Personal Mobility Equipment Industry Revenue (Million) Forecast, by Application 2019 & 2032
- Table 74: GCC Personal Mobility Equipment Industry Volume (K Unit) Forecast, by Application 2019 & 2032
- Table 75: South Africa Personal Mobility Equipment Industry Revenue (Million) Forecast, by Application 2019 & 2032
- Table 76: South Africa Personal Mobility Equipment Industry Volume (K Unit) Forecast, by Application 2019 & 2032
- Table 77: Rest of Middle East and Africa Personal Mobility Equipment Industry Revenue (Million) Forecast, by Application 2019 & 2032
- Table 78: Rest of Middle East and Africa Personal Mobility Equipment Industry Volume (K Unit) Forecast, by Application 2019 & 2032
- Table 79: Global Personal Mobility Equipment Industry Revenue Million Forecast, by Product 2019 & 2032
- Table 80: Global Personal Mobility Equipment Industry Volume K Unit Forecast, by Product 2019 & 2032
- Table 81: Global Personal Mobility Equipment Industry Revenue Million Forecast, by End User 2019 & 2032
- Table 82: Global Personal Mobility Equipment Industry Volume K Unit Forecast, by End User 2019 & 2032
- Table 83: Global Personal Mobility Equipment Industry Revenue Million Forecast, by Country 2019 & 2032
- Table 84: Global Personal Mobility Equipment Industry Volume K Unit Forecast, by Country 2019 & 2032
- Table 85: Brazil Personal Mobility Equipment Industry Revenue (Million) Forecast, by Application 2019 & 2032
- Table 86: Brazil Personal Mobility Equipment Industry Volume (K Unit) Forecast, by Application 2019 & 2032
- Table 87: Argentina Personal Mobility Equipment Industry Revenue (Million) Forecast, by Application 2019 & 2032
- Table 88: Argentina Personal Mobility Equipment Industry Volume (K Unit) Forecast, by Application 2019 & 2032
- Table 89: Rest of South America Personal Mobility Equipment Industry Revenue (Million) Forecast, by Application 2019 & 2032
- Table 90: Rest of South America Personal Mobility Equipment Industry Volume (K Unit) Forecast, by Application 2019 & 2032
Frequently Asked Questions
1. What is the projected Compound Annual Growth Rate (CAGR) of the Personal Mobility Equipment Industry?
The projected CAGR is approximately 6.19%.
2. Which companies are prominent players in the Personal Mobility Equipment Industry?
Key companies in the market include GF Health Products Inc, Arjo, Invacare Corporation, Drive DeVilbiss Healthcare, Patricia Industries (Permobil), Rollz International, Kaye Products Inc, Ottobock, Stryker Corporation, Performance Health, Pride Mobility Products Corp, Medline Industries Inc, Sunrise Medical (US) LLC.
3. What are the main segments of the Personal Mobility Equipment Industry?
The market segments include Product, End User.
4. Can you provide details about the market size?
The market size is estimated to be USD 13.95 Million as of 2022.
5. What are some drivers contributing to market growth?
Increase in Demand for Personal Mobility Devices in Elderly Population; Technological Advancements in the Devices.
6. What are the notable trends driving market growth?
Wheelchairs Emerged as the Largest Segment in the Personal Mobility Devices Market.
7. Are there any restraints impacting market growth?
High Cost of the Devices.
8. Can you provide examples of recent developments in the market?
In August 2021, Falcon Mobility unveiled the Ultra-Lite 2 electric wheelchair, which is designed to be lightweight and easy to maneuver. The company hopes to provide a new affordable and lightweight wheelchair option to the elderly and disabled communities with this launch, making it easier for caregivers to transport their wards' personal mobility aids to and from a vehicle.
9. What pricing options are available for accessing the report?
Pricing options include single-user, multi-user, and enterprise licenses priced at USD 4750, USD 5250, and USD 8750 respectively.
10. Is the market size provided in terms of value or volume?
The market size is provided in terms of value, measured in Million and volume, measured in K Unit.
11. Are there any specific market keywords associated with the report?
Yes, the market keyword associated with the report is "Personal Mobility Equipment Industry," which aids in identifying and referencing the specific market segment covered.
12. How do I determine which pricing option suits my needs best?
The pricing options vary based on user requirements and access needs. Individual users may opt for single-user licenses, while businesses requiring broader access may choose multi-user or enterprise licenses for cost-effective access to the report.
13. Are there any additional resources or data provided in the Personal Mobility Equipment Industry report?
While the report offers comprehensive insights, it's advisable to review the specific contents or supplementary materials provided to ascertain if additional resources or data are available.
14. How can I stay updated on further developments or reports in the Personal Mobility Equipment Industry?
To stay informed about further developments, trends, and reports in the Personal Mobility Equipment Industry, consider subscribing to industry newsletters, following relevant companies and organizations, or regularly checking reputable industry news sources and publications.
Methodology
Step 1 - Identification of Relevant Samples Size from Population Database


Step 2 - Approaches for Defining Global Market Size (Value, Volume* & Price*)

Note*: In applicable scenarios
Step 3 - Data Sources
Primary Research
- Web Analytics
- Survey Reports
- Research Institute
- Latest Research Reports
- Opinion Leaders
Secondary Research
- Annual Reports
- White Paper
- Latest Press Release
- Industry Association
- Paid Database
- Investor Presentations

Step 4 - Data Triangulation
Involves using different sources of information in order to increase the validity of a study
These sources are likely to be stakeholders in a program - participants, other researchers, program staff, other community members, and so on.
Then we put all data in single framework & apply various statistical tools to find out the dynamic on the market.
During the analysis stage, feedback from the stakeholder groups would be compared to determine areas of agreement as well as areas of divergence
