

Key Insights
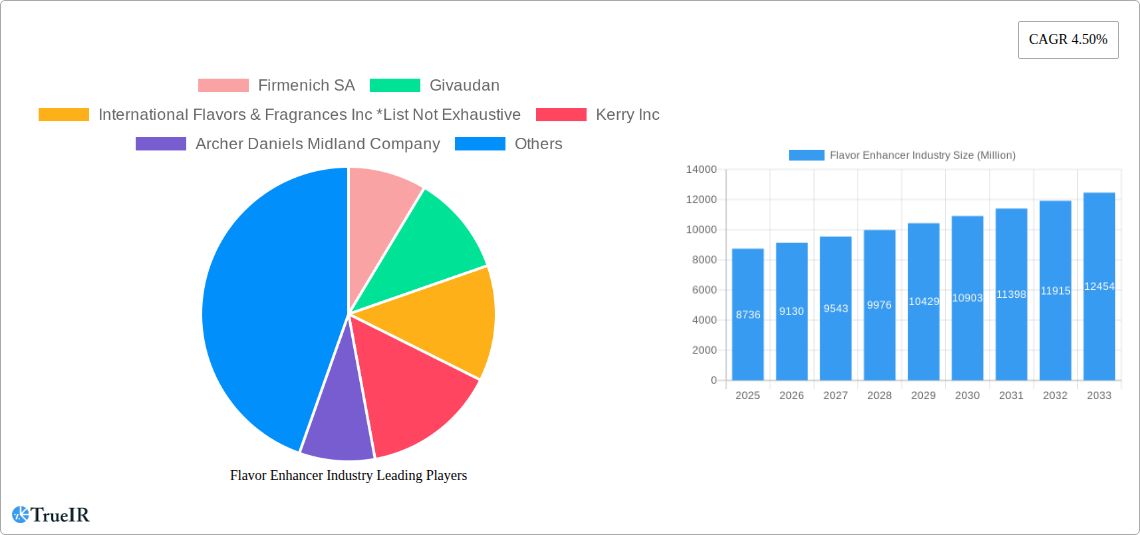
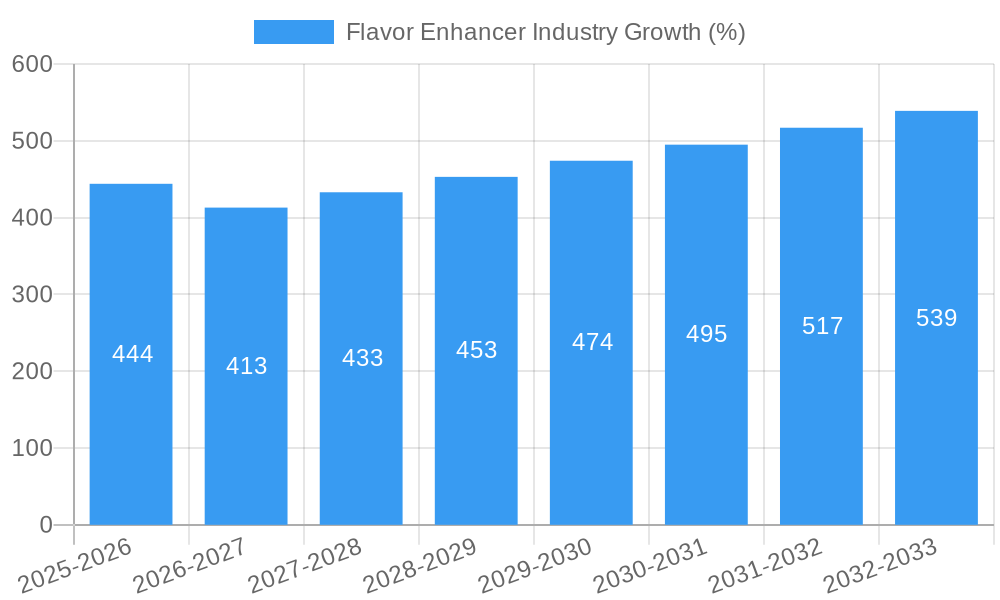
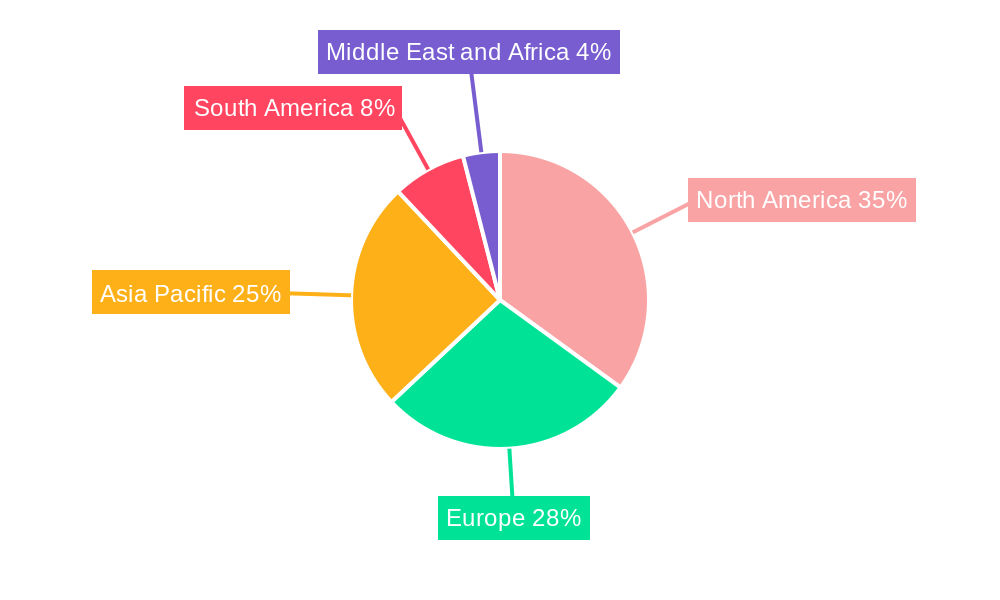
The global flavor enhancer market, valued at $8,736 million in 2025, is projected to experience robust growth, driven by increasing demand for convenient and flavorful food products across diverse applications. The compound annual growth rate (CAGR) of 4.50% from 2025 to 2033 indicates a significant expansion in market size, reaching an estimated $13,000 million by 2033. This growth is fueled by several key factors. The burgeoning food processing industry, coupled with evolving consumer preferences for ready-to-eat meals and snacks, is a significant driver. Health-conscious consumers are increasingly seeking natural and clean-label flavor enhancers, leading to innovation in product formulations and ingredient sourcing. Furthermore, the rising disposable incomes in developing economies are expanding market access and fueling demand for processed foods containing flavor enhancers. However, concerns regarding potential health effects associated with certain flavor enhancers and stringent regulatory requirements in some regions pose challenges to market expansion. The market segmentation reveals that soups and noodles, savory snacks, and seasoning and condiments are the dominant application areas, reflecting the wide-ranging use of flavor enhancers in various food categories. Leading players such as Firmenich SA, Givaudan, and International Flavors & Fragrances Inc. are investing heavily in research and development to create innovative and appealing flavor profiles to meet the evolving consumer preferences. The geographical spread of the market is diverse, with North America and Asia Pacific representing significant revenue contributors, driven by established food processing industries and rising consumer demand in those regions.
The competitive landscape is characterized by the presence of both large multinational corporations and smaller, specialized companies. Strategic partnerships, mergers, and acquisitions are common strategies employed to expand market share and product portfolios. The future growth trajectory depends significantly on the evolution of consumer preferences, the development of novel flavor enhancer technologies, and the adaptation to evolving regulatory landscapes. Sustained innovation in both natural and synthetic flavor enhancer options will remain crucial for maintaining market competitiveness and capturing significant market share. Further research focused on identifying and mitigating potential health risks will also be paramount in ensuring long-term market sustainability and consumer trust.
Flavor Enhancer Industry Market Report: 2019-2033
This comprehensive report provides a detailed analysis of the Flavor Enhancer Industry, offering invaluable insights for businesses, investors, and researchers. With a study period spanning 2019-2033, a base year of 2025, and a forecast period of 2025-2033, this report leverages extensive data from the historical period (2019-2024) to paint a clear picture of current market dynamics and future trends. The global market is estimated to be worth xx Million in 2025 and is expected to experience significant growth in the coming years. Key players like Firmenich SA, Givaudan, International Flavors & Fragrances Inc., Kerry Inc., and others are shaping the industry's trajectory.
Flavor Enhancer Industry Market Structure & Competitive Landscape
The Flavor Enhancer Industry is characterized by a moderately concentrated market structure. The top five players—Firmenich SA, Givaudan, International Flavors & Fragrances Inc., Kerry Inc., and Archer Daniels Midland Company—hold a combined market share of approximately xx%, indicating a degree of oligopoly. This concentration is driven by significant R&D investments, economies of scale, and strong brand recognition. However, smaller, specialized players also thrive by catering to niche demands and focusing on regional markets.
Innovation is a key driver, with companies constantly developing new flavors and technologies to meet evolving consumer preferences. Regulatory landscapes vary across geographies, influencing product formulations and ingredient sourcing. The industry experiences relatively low pressure from direct product substitutes as flavor enhancers often play a crucial role in enhancing the taste and aroma of food products.
End-user segmentation is primarily driven by applications in the food and beverage industries. Major segments include soups and noodles, savory snacks, seasoning and condiments, and other applications like meat products and beverages. The M&A landscape is moderately active, with strategic acquisitions aimed at expanding product portfolios, geographical reach, and technological capabilities. Recent years have seen xx Million in M&A transactions, predominantly focused on smaller, specialized companies.
Flavor Enhancer Industry Market Trends & Opportunities
The Flavor Enhancer Industry is poised for significant growth, with a projected Compound Annual Growth Rate (CAGR) of xx% during the forecast period (2025-2033). This growth is driven by several key factors. The rising global population, coupled with changing consumer preferences toward convenience foods and processed products, is boosting demand for flavor enhancers. Technological advancements in flavor creation and delivery systems are leading to the development of more natural, clean-label products, catering to the growing health-conscious consumer base. Increased disposable incomes in developing economies are also driving market expansion. Moreover, the rising popularity of savory snacks and ready-to-eat meals is further fueling demand. Market penetration rates are particularly high in developed regions but are showing significant growth in emerging markets, particularly in Asia-Pacific and Latin America. Competitive dynamics are intense, with companies focusing on product innovation, cost optimization, and strategic partnerships to maintain their market positions.
Dominant Markets & Segments in Flavor Enhancer Industry
The Flavor Enhancer Industry exhibits strong regional variations in market dominance. Currently, North America holds the largest market share, followed by Europe and Asia-Pacific. However, the fastest-growing regions are projected to be Asia-Pacific and Latin America, driven by robust economic growth and expanding middle classes.
- Key Growth Drivers:
- Expanding food processing industry
- Rising disposable incomes
- Growing consumer preference for convenience foods
- Government support for food processing technologies
Within application segments, Savory Snacks and Seasoning & Condiments represent the most significant portions of the market due to high consumption and diverse applications. The growth of these segments is particularly strong in emerging markets. The Soups and Noodles segment shows steady growth, while the "Other Applications" segment exhibits diverse growth patterns depending on regional trends and product innovation within specific industries.
Flavor Enhancer Industry Product Analysis
The flavor enhancer industry showcases continuous product innovation. Recent developments involve creating more natural and clean-label options, appealing to health-conscious consumers. Companies are exploring plant-based alternatives and sustainable sourcing strategies, alongside advancements in flavor delivery systems to enhance the efficacy and sensory experience of flavor enhancers. This focus on innovation is a critical competitive advantage, enabling companies to meet evolving consumer demands and regulatory requirements. The market is also witnessing a rise in customized flavor solutions tailored to specific regional palates and food applications.
Key Drivers, Barriers & Challenges in Flavor Enhancer Industry
Key Drivers: The Flavor Enhancer Industry is propelled by the growing global demand for convenient and flavorful food products. Technological advancements, such as the development of plant-based alternatives and sustainable sourcing methods, are major catalysts. Favorable regulatory frameworks in certain regions further stimulate market growth. The increasing disposable incomes in emerging markets also contribute to market expansion.
Challenges: The industry faces challenges such as fluctuating raw material prices, stringent regulatory compliance requirements, and intense competition. Supply chain disruptions can significantly impact production and distribution, while meeting constantly evolving consumer preferences demands continuous innovation and adaptation. Moreover, concerns surrounding the health impacts of certain flavor enhancers pose a significant challenge.
Growth Drivers in the Flavor Enhancer Industry Market
Growth is driven by several factors including expanding food processing and manufacturing, increasing demand for convenient foods, and the rising popularity of processed snacks and ready-to-eat meals. Furthermore, technological advancements in flavor creation and delivery, along with shifting consumer preferences toward natural and clean-label products, significantly propel the market.
Challenges Impacting Flavor Enhancer Industry Growth
The industry faces several challenges including stringent regulatory requirements, price volatility of raw materials, intense competition, and concerns over the health implications of certain ingredients. Supply chain disruptions can lead to production delays and increased costs, thereby impacting overall growth.
Key Players Shaping the Flavor Enhancer Industry Market
- Firmenich SA
- Givaudan
- International Flavors & Fragrances Inc.
- Kerry Inc
- Archer Daniels Midland Company
- Koninklijke DSM N V
- Ajinomoto Group
- Bell Flavors & Fragrances
- Symrise AG
- Sensient Technologies Corporation
- Corbion NV
Significant Flavor Enhancer Industry Milestones
- Jun 2021: Kerry Group opens a new taste facility in Irapuato, Mexico, expanding its capacity in Latin America.
- May 2022: Givaudan introduces NaNino+, a plant-based nitrite alternative for processed meat.
- Jan 2023: International Flavors & Fragrances Inc. launches ChoozIt Vintage, aiding cheddar cheese aging processes.
Future Outlook for Flavor Enhancer Industry Market
The Flavor Enhancer Industry is projected to experience continued growth, driven by expanding food processing sectors globally. Strategic investments in research and development, particularly in plant-based and sustainable solutions, will be crucial for maintaining a competitive edge. The market presents significant opportunities for companies that can effectively navigate regulatory complexities and adapt to evolving consumer demands for healthier and more natural products.
Flavor Enhancer Industry Segmentation
-
1. Application
- 1.1. Soups and Noodles
- 1.2. Savory Snacks
- 1.3. Seasoning and Condiments
- 1.4. Other Applications
Flavor Enhancer Industry Segmentation By Geography
-
1. North America
- 1.1. United States
- 1.2. Canada
- 1.3. Mexico
- 1.4. Rest of North America
-
2. Europe
- 2.1. Spain
- 2.2. United Kingdom
- 2.3. Germany
- 2.4. France
- 2.5. Italy
- 2.6. Russia
- 2.7. Rest of Europe
-
3. Asia Pacific
- 3.1. China
- 3.2. Japan
- 3.3. India
- 3.4. Australia
- 3.5. Rest of Asia Pacific
-
4. South America
- 4.1. Brazil
- 4.2. Argentina
- 4.3. Rest of South America
-
5. Middle East and Africa
- 5.1. South Africa
- 5.2. Saudi Arabia
- 5.3. Rest of Middle East and Africa
Flavor Enhancer Industry REPORT HIGHLIGHTS
| Aspects | Details |
|---|---|
| Study Period | 2019-2033 |
| Base Year | 2024 |
| Estimated Year | 2025 |
| Forecast Period | 2025-2033 |
| Historical Period | 2019-2024 |
| Growth Rate | CAGR of 4.50% from 2019-2033 |
| Segmentation |
|
Table of Contents
- 1. Introduction
- 1.1. Research Scope
- 1.2. Market Segmentation
- 1.3. Research Methodology
- 1.4. Definitions and Assumptions
- 2. Executive Summary
- 2.1. Introduction
- 3. Market Dynamics
- 3.1. Introduction
- 3.2. Market Drivers
- 3.2.1. Demand for Convenient Ready-to-Eat Food Products; Growing Affinity Toward Ethnic and Organic Frozen Ready Meals
- 3.3. Market Restrains
- 3.3.1. Rising Concerns Over Food Safety and Quality
- 3.4. Market Trends
- 3.4.1. Consumer Preferences Drive Flavors Enhancers Sectors
- 4. Market Factor Analysis
- 4.1. Porters Five Forces
- 4.2. Supply/Value Chain
- 4.3. PESTEL analysis
- 4.4. Market Entropy
- 4.5. Patent/Trademark Analysis
- 5. Global Flavor Enhancer Industry Analysis, Insights and Forecast, 2019-2031
- 5.1. Market Analysis, Insights and Forecast - by Application
- 5.1.1. Soups and Noodles
- 5.1.2. Savory Snacks
- 5.1.3. Seasoning and Condiments
- 5.1.4. Other Applications
- 5.2. Market Analysis, Insights and Forecast - by Region
- 5.2.1. North America
- 5.2.2. Europe
- 5.2.3. Asia Pacific
- 5.2.4. South America
- 5.2.5. Middle East and Africa
- 5.1. Market Analysis, Insights and Forecast - by Application
- 6. North America Flavor Enhancer Industry Analysis, Insights and Forecast, 2019-2031
- 6.1. Market Analysis, Insights and Forecast - by Application
- 6.1.1. Soups and Noodles
- 6.1.2. Savory Snacks
- 6.1.3. Seasoning and Condiments
- 6.1.4. Other Applications
- 6.1. Market Analysis, Insights and Forecast - by Application
- 7. Europe Flavor Enhancer Industry Analysis, Insights and Forecast, 2019-2031
- 7.1. Market Analysis, Insights and Forecast - by Application
- 7.1.1. Soups and Noodles
- 7.1.2. Savory Snacks
- 7.1.3. Seasoning and Condiments
- 7.1.4. Other Applications
- 7.1. Market Analysis, Insights and Forecast - by Application
- 8. Asia Pacific Flavor Enhancer Industry Analysis, Insights and Forecast, 2019-2031
- 8.1. Market Analysis, Insights and Forecast - by Application
- 8.1.1. Soups and Noodles
- 8.1.2. Savory Snacks
- 8.1.3. Seasoning and Condiments
- 8.1.4. Other Applications
- 8.1. Market Analysis, Insights and Forecast - by Application
- 9. South America Flavor Enhancer Industry Analysis, Insights and Forecast, 2019-2031
- 9.1. Market Analysis, Insights and Forecast - by Application
- 9.1.1. Soups and Noodles
- 9.1.2. Savory Snacks
- 9.1.3. Seasoning and Condiments
- 9.1.4. Other Applications
- 9.1. Market Analysis, Insights and Forecast - by Application
- 10. Middle East and Africa Flavor Enhancer Industry Analysis, Insights and Forecast, 2019-2031
- 10.1. Market Analysis, Insights and Forecast - by Application
- 10.1.1. Soups and Noodles
- 10.1.2. Savory Snacks
- 10.1.3. Seasoning and Condiments
- 10.1.4. Other Applications
- 10.1. Market Analysis, Insights and Forecast - by Application
- 11. North America Flavor Enhancer Industry Analysis, Insights and Forecast, 2019-2031
- 11.1. Market Analysis, Insights and Forecast - By Country/Sub-region
- 11.1.1 United States
- 11.1.2 Canada
- 11.1.3 Mexico
- 11.1.4 Rest of North America
- 12. Europe Flavor Enhancer Industry Analysis, Insights and Forecast, 2019-2031
- 12.1. Market Analysis, Insights and Forecast - By Country/Sub-region
- 12.1.1 Spain
- 12.1.2 United Kingdom
- 12.1.3 Germany
- 12.1.4 France
- 12.1.5 Italy
- 12.1.6 Russia
- 12.1.7 Rest of Europe
- 13. Asia Pacific Flavor Enhancer Industry Analysis, Insights and Forecast, 2019-2031
- 13.1. Market Analysis, Insights and Forecast - By Country/Sub-region
- 13.1.1 China
- 13.1.2 Japan
- 13.1.3 India
- 13.1.4 Australia
- 13.1.5 Rest of Asia Pacific
- 14. South America Flavor Enhancer Industry Analysis, Insights and Forecast, 2019-2031
- 14.1. Market Analysis, Insights and Forecast - By Country/Sub-region
- 14.1.1 Brazil
- 14.1.2 Argentina
- 14.1.3 Rest of South America
- 15. Middle East and Africa Flavor Enhancer Industry Analysis, Insights and Forecast, 2019-2031
- 15.1. Market Analysis, Insights and Forecast - By Country/Sub-region
- 15.1.1 South Africa
- 15.1.2 Saudi Arabia
- 15.1.3 Rest of Middle East and Africa
- 16. Competitive Analysis
- 16.1. Global Market Share Analysis 2024
- 16.2. Company Profiles
- 16.2.1 Firmenich SA
- 16.2.1.1. Overview
- 16.2.1.2. Products
- 16.2.1.3. SWOT Analysis
- 16.2.1.4. Recent Developments
- 16.2.1.5. Financials (Based on Availability)
- 16.2.2 Givaudan
- 16.2.2.1. Overview
- 16.2.2.2. Products
- 16.2.2.3. SWOT Analysis
- 16.2.2.4. Recent Developments
- 16.2.2.5. Financials (Based on Availability)
- 16.2.3 International Flavors & Fragrances Inc *List Not Exhaustive
- 16.2.3.1. Overview
- 16.2.3.2. Products
- 16.2.3.3. SWOT Analysis
- 16.2.3.4. Recent Developments
- 16.2.3.5. Financials (Based on Availability)
- 16.2.4 Kerry Inc
- 16.2.4.1. Overview
- 16.2.4.2. Products
- 16.2.4.3. SWOT Analysis
- 16.2.4.4. Recent Developments
- 16.2.4.5. Financials (Based on Availability)
- 16.2.5 Archer Daniels Midland Company
- 16.2.5.1. Overview
- 16.2.5.2. Products
- 16.2.5.3. SWOT Analysis
- 16.2.5.4. Recent Developments
- 16.2.5.5. Financials (Based on Availability)
- 16.2.6 Koninklijke DSM N V
- 16.2.6.1. Overview
- 16.2.6.2. Products
- 16.2.6.3. SWOT Analysis
- 16.2.6.4. Recent Developments
- 16.2.6.5. Financials (Based on Availability)
- 16.2.7 Ajinomoto Group
- 16.2.7.1. Overview
- 16.2.7.2. Products
- 16.2.7.3. SWOT Analysis
- 16.2.7.4. Recent Developments
- 16.2.7.5. Financials (Based on Availability)
- 16.2.8 Bell Flavors & Fragrances
- 16.2.8.1. Overview
- 16.2.8.2. Products
- 16.2.8.3. SWOT Analysis
- 16.2.8.4. Recent Developments
- 16.2.8.5. Financials (Based on Availability)
- 16.2.9 Symrise AG
- 16.2.9.1. Overview
- 16.2.9.2. Products
- 16.2.9.3. SWOT Analysis
- 16.2.9.4. Recent Developments
- 16.2.9.5. Financials (Based on Availability)
- 16.2.10 Sensient Technologies Corporation
- 16.2.10.1. Overview
- 16.2.10.2. Products
- 16.2.10.3. SWOT Analysis
- 16.2.10.4. Recent Developments
- 16.2.10.5. Financials (Based on Availability)
- 16.2.11 Corbion NV
- 16.2.11.1. Overview
- 16.2.11.2. Products
- 16.2.11.3. SWOT Analysis
- 16.2.11.4. Recent Developments
- 16.2.11.5. Financials (Based on Availability)
- 16.2.1 Firmenich SA
List of Figures
- Figure 1: Global Flavor Enhancer Industry Revenue Breakdown (Million, %) by Region 2024 & 2032
- Figure 2: North America Flavor Enhancer Industry Revenue (Million), by Country 2024 & 2032
- Figure 3: North America Flavor Enhancer Industry Revenue Share (%), by Country 2024 & 2032
- Figure 4: Europe Flavor Enhancer Industry Revenue (Million), by Country 2024 & 2032
- Figure 5: Europe Flavor Enhancer Industry Revenue Share (%), by Country 2024 & 2032
- Figure 6: Asia Pacific Flavor Enhancer Industry Revenue (Million), by Country 2024 & 2032
- Figure 7: Asia Pacific Flavor Enhancer Industry Revenue Share (%), by Country 2024 & 2032
- Figure 8: South America Flavor Enhancer Industry Revenue (Million), by Country 2024 & 2032
- Figure 9: South America Flavor Enhancer Industry Revenue Share (%), by Country 2024 & 2032
- Figure 10: Middle East and Africa Flavor Enhancer Industry Revenue (Million), by Country 2024 & 2032
- Figure 11: Middle East and Africa Flavor Enhancer Industry Revenue Share (%), by Country 2024 & 2032
- Figure 12: North America Flavor Enhancer Industry Revenue (Million), by Application 2024 & 2032
- Figure 13: North America Flavor Enhancer Industry Revenue Share (%), by Application 2024 & 2032
- Figure 14: North America Flavor Enhancer Industry Revenue (Million), by Country 2024 & 2032
- Figure 15: North America Flavor Enhancer Industry Revenue Share (%), by Country 2024 & 2032
- Figure 16: Europe Flavor Enhancer Industry Revenue (Million), by Application 2024 & 2032
- Figure 17: Europe Flavor Enhancer Industry Revenue Share (%), by Application 2024 & 2032
- Figure 18: Europe Flavor Enhancer Industry Revenue (Million), by Country 2024 & 2032
- Figure 19: Europe Flavor Enhancer Industry Revenue Share (%), by Country 2024 & 2032
- Figure 20: Asia Pacific Flavor Enhancer Industry Revenue (Million), by Application 2024 & 2032
- Figure 21: Asia Pacific Flavor Enhancer Industry Revenue Share (%), by Application 2024 & 2032
- Figure 22: Asia Pacific Flavor Enhancer Industry Revenue (Million), by Country 2024 & 2032
- Figure 23: Asia Pacific Flavor Enhancer Industry Revenue Share (%), by Country 2024 & 2032
- Figure 24: South America Flavor Enhancer Industry Revenue (Million), by Application 2024 & 2032
- Figure 25: South America Flavor Enhancer Industry Revenue Share (%), by Application 2024 & 2032
- Figure 26: South America Flavor Enhancer Industry Revenue (Million), by Country 2024 & 2032
- Figure 27: South America Flavor Enhancer Industry Revenue Share (%), by Country 2024 & 2032
- Figure 28: Middle East and Africa Flavor Enhancer Industry Revenue (Million), by Application 2024 & 2032
- Figure 29: Middle East and Africa Flavor Enhancer Industry Revenue Share (%), by Application 2024 & 2032
- Figure 30: Middle East and Africa Flavor Enhancer Industry Revenue (Million), by Country 2024 & 2032
- Figure 31: Middle East and Africa Flavor Enhancer Industry Revenue Share (%), by Country 2024 & 2032
List of Tables
- Table 1: Global Flavor Enhancer Industry Revenue Million Forecast, by Region 2019 & 2032
- Table 2: Global Flavor Enhancer Industry Revenue Million Forecast, by Application 2019 & 2032
- Table 3: Global Flavor Enhancer Industry Revenue Million Forecast, by Region 2019 & 2032
- Table 4: Global Flavor Enhancer Industry Revenue Million Forecast, by Country 2019 & 2032
- Table 5: United States Flavor Enhancer Industry Revenue (Million) Forecast, by Application 2019 & 2032
- Table 6: Canada Flavor Enhancer Industry Revenue (Million) Forecast, by Application 2019 & 2032
- Table 7: Mexico Flavor Enhancer Industry Revenue (Million) Forecast, by Application 2019 & 2032
- Table 8: Rest of North America Flavor Enhancer Industry Revenue (Million) Forecast, by Application 2019 & 2032
- Table 9: Global Flavor Enhancer Industry Revenue Million Forecast, by Country 2019 & 2032
- Table 10: Spain Flavor Enhancer Industry Revenue (Million) Forecast, by Application 2019 & 2032
- Table 11: United Kingdom Flavor Enhancer Industry Revenue (Million) Forecast, by Application 2019 & 2032
- Table 12: Germany Flavor Enhancer Industry Revenue (Million) Forecast, by Application 2019 & 2032
- Table 13: France Flavor Enhancer Industry Revenue (Million) Forecast, by Application 2019 & 2032
- Table 14: Italy Flavor Enhancer Industry Revenue (Million) Forecast, by Application 2019 & 2032
- Table 15: Russia Flavor Enhancer Industry Revenue (Million) Forecast, by Application 2019 & 2032
- Table 16: Rest of Europe Flavor Enhancer Industry Revenue (Million) Forecast, by Application 2019 & 2032
- Table 17: Global Flavor Enhancer Industry Revenue Million Forecast, by Country 2019 & 2032
- Table 18: China Flavor Enhancer Industry Revenue (Million) Forecast, by Application 2019 & 2032
- Table 19: Japan Flavor Enhancer Industry Revenue (Million) Forecast, by Application 2019 & 2032
- Table 20: India Flavor Enhancer Industry Revenue (Million) Forecast, by Application 2019 & 2032
- Table 21: Australia Flavor Enhancer Industry Revenue (Million) Forecast, by Application 2019 & 2032
- Table 22: Rest of Asia Pacific Flavor Enhancer Industry Revenue (Million) Forecast, by Application 2019 & 2032
- Table 23: Global Flavor Enhancer Industry Revenue Million Forecast, by Country 2019 & 2032
- Table 24: Brazil Flavor Enhancer Industry Revenue (Million) Forecast, by Application 2019 & 2032
- Table 25: Argentina Flavor Enhancer Industry Revenue (Million) Forecast, by Application 2019 & 2032
- Table 26: Rest of South America Flavor Enhancer Industry Revenue (Million) Forecast, by Application 2019 & 2032
- Table 27: Global Flavor Enhancer Industry Revenue Million Forecast, by Country 2019 & 2032
- Table 28: South Africa Flavor Enhancer Industry Revenue (Million) Forecast, by Application 2019 & 2032
- Table 29: Saudi Arabia Flavor Enhancer Industry Revenue (Million) Forecast, by Application 2019 & 2032
- Table 30: Rest of Middle East and Africa Flavor Enhancer Industry Revenue (Million) Forecast, by Application 2019 & 2032
- Table 31: Global Flavor Enhancer Industry Revenue Million Forecast, by Application 2019 & 2032
- Table 32: Global Flavor Enhancer Industry Revenue Million Forecast, by Country 2019 & 2032
- Table 33: United States Flavor Enhancer Industry Revenue (Million) Forecast, by Application 2019 & 2032
- Table 34: Canada Flavor Enhancer Industry Revenue (Million) Forecast, by Application 2019 & 2032
- Table 35: Mexico Flavor Enhancer Industry Revenue (Million) Forecast, by Application 2019 & 2032
- Table 36: Rest of North America Flavor Enhancer Industry Revenue (Million) Forecast, by Application 2019 & 2032
- Table 37: Global Flavor Enhancer Industry Revenue Million Forecast, by Application 2019 & 2032
- Table 38: Global Flavor Enhancer Industry Revenue Million Forecast, by Country 2019 & 2032
- Table 39: Spain Flavor Enhancer Industry Revenue (Million) Forecast, by Application 2019 & 2032
- Table 40: United Kingdom Flavor Enhancer Industry Revenue (Million) Forecast, by Application 2019 & 2032
- Table 41: Germany Flavor Enhancer Industry Revenue (Million) Forecast, by Application 2019 & 2032
- Table 42: France Flavor Enhancer Industry Revenue (Million) Forecast, by Application 2019 & 2032
- Table 43: Italy Flavor Enhancer Industry Revenue (Million) Forecast, by Application 2019 & 2032
- Table 44: Russia Flavor Enhancer Industry Revenue (Million) Forecast, by Application 2019 & 2032
- Table 45: Rest of Europe Flavor Enhancer Industry Revenue (Million) Forecast, by Application 2019 & 2032
- Table 46: Global Flavor Enhancer Industry Revenue Million Forecast, by Application 2019 & 2032
- Table 47: Global Flavor Enhancer Industry Revenue Million Forecast, by Country 2019 & 2032
- Table 48: China Flavor Enhancer Industry Revenue (Million) Forecast, by Application 2019 & 2032
- Table 49: Japan Flavor Enhancer Industry Revenue (Million) Forecast, by Application 2019 & 2032
- Table 50: India Flavor Enhancer Industry Revenue (Million) Forecast, by Application 2019 & 2032
- Table 51: Australia Flavor Enhancer Industry Revenue (Million) Forecast, by Application 2019 & 2032
- Table 52: Rest of Asia Pacific Flavor Enhancer Industry Revenue (Million) Forecast, by Application 2019 & 2032
- Table 53: Global Flavor Enhancer Industry Revenue Million Forecast, by Application 2019 & 2032
- Table 54: Global Flavor Enhancer Industry Revenue Million Forecast, by Country 2019 & 2032
- Table 55: Brazil Flavor Enhancer Industry Revenue (Million) Forecast, by Application 2019 & 2032
- Table 56: Argentina Flavor Enhancer Industry Revenue (Million) Forecast, by Application 2019 & 2032
- Table 57: Rest of South America Flavor Enhancer Industry Revenue (Million) Forecast, by Application 2019 & 2032
- Table 58: Global Flavor Enhancer Industry Revenue Million Forecast, by Application 2019 & 2032
- Table 59: Global Flavor Enhancer Industry Revenue Million Forecast, by Country 2019 & 2032
- Table 60: South Africa Flavor Enhancer Industry Revenue (Million) Forecast, by Application 2019 & 2032
- Table 61: Saudi Arabia Flavor Enhancer Industry Revenue (Million) Forecast, by Application 2019 & 2032
- Table 62: Rest of Middle East and Africa Flavor Enhancer Industry Revenue (Million) Forecast, by Application 2019 & 2032
Frequently Asked Questions
1. What is the projected Compound Annual Growth Rate (CAGR) of the Flavor Enhancer Industry?
The projected CAGR is approximately 4.50%.
2. Which companies are prominent players in the Flavor Enhancer Industry?
Key companies in the market include Firmenich SA, Givaudan, International Flavors & Fragrances Inc *List Not Exhaustive, Kerry Inc, Archer Daniels Midland Company, Koninklijke DSM N V, Ajinomoto Group, Bell Flavors & Fragrances, Symrise AG, Sensient Technologies Corporation, Corbion NV.
3. What are the main segments of the Flavor Enhancer Industry?
The market segments include Application.
4. Can you provide details about the market size?
The market size is estimated to be USD 8,736 Million as of 2022.
5. What are some drivers contributing to market growth?
Demand for Convenient Ready-to-Eat Food Products; Growing Affinity Toward Ethnic and Organic Frozen Ready Meals.
6. What are the notable trends driving market growth?
Consumer Preferences Drive Flavors Enhancers Sectors.
7. Are there any restraints impacting market growth?
Rising Concerns Over Food Safety and Quality.
8. Can you provide examples of recent developments in the market?
Jan 2023: International Flavors & Fragrances Inc. launched ChoozIt Vintage in the United States and Canadian markets. ChoozIt Vintage might help cheddar cheese manufacturers in overcoming undesirable flavor development during aging, delivering highly consistent pH and texture results throughout the ripening process.
9. What pricing options are available for accessing the report?
Pricing options include single-user, multi-user, and enterprise licenses priced at USD 4750, USD 5250, and USD 8750 respectively.
10. Is the market size provided in terms of value or volume?
The market size is provided in terms of value, measured in Million.
11. Are there any specific market keywords associated with the report?
Yes, the market keyword associated with the report is "Flavor Enhancer Industry," which aids in identifying and referencing the specific market segment covered.
12. How do I determine which pricing option suits my needs best?
The pricing options vary based on user requirements and access needs. Individual users may opt for single-user licenses, while businesses requiring broader access may choose multi-user or enterprise licenses for cost-effective access to the report.
13. Are there any additional resources or data provided in the Flavor Enhancer Industry report?
While the report offers comprehensive insights, it's advisable to review the specific contents or supplementary materials provided to ascertain if additional resources or data are available.
14. How can I stay updated on further developments or reports in the Flavor Enhancer Industry?
To stay informed about further developments, trends, and reports in the Flavor Enhancer Industry, consider subscribing to industry newsletters, following relevant companies and organizations, or regularly checking reputable industry news sources and publications.
Methodology
Step 1 - Identification of Relevant Samples Size from Population Database


Step 2 - Approaches for Defining Global Market Size (Value, Volume* & Price*)

Note*: In applicable scenarios
Step 3 - Data Sources
Primary Research
- Web Analytics
- Survey Reports
- Research Institute
- Latest Research Reports
- Opinion Leaders
Secondary Research
- Annual Reports
- White Paper
- Latest Press Release
- Industry Association
- Paid Database
- Investor Presentations

Step 4 - Data Triangulation
Involves using different sources of information in order to increase the validity of a study
These sources are likely to be stakeholders in a program - participants, other researchers, program staff, other community members, and so on.
Then we put all data in single framework & apply various statistical tools to find out the dynamic on the market.
During the analysis stage, feedback from the stakeholder groups would be compared to determine areas of agreement as well as areas of divergence
