

Key Insights
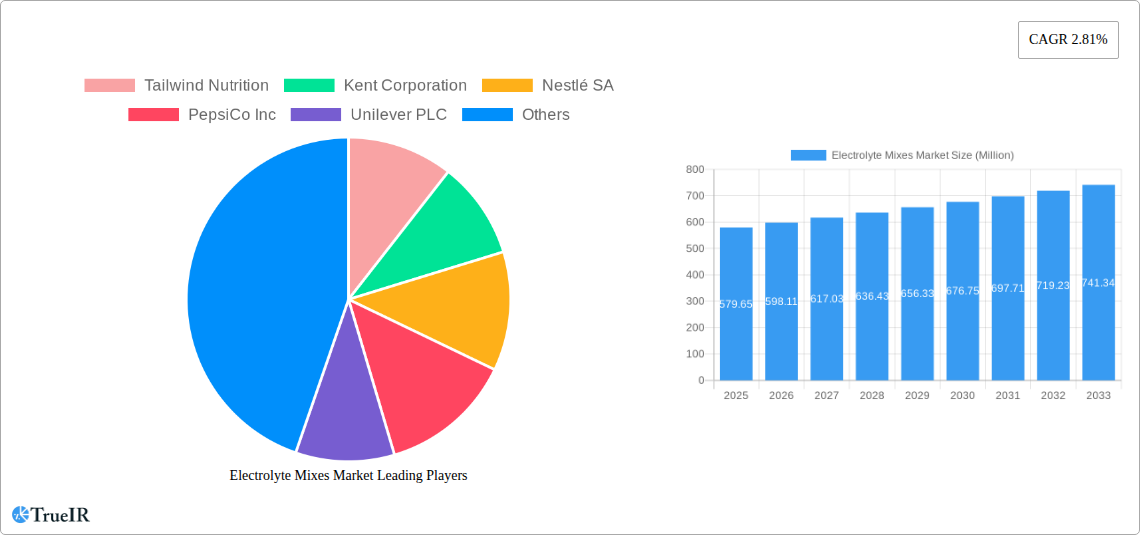
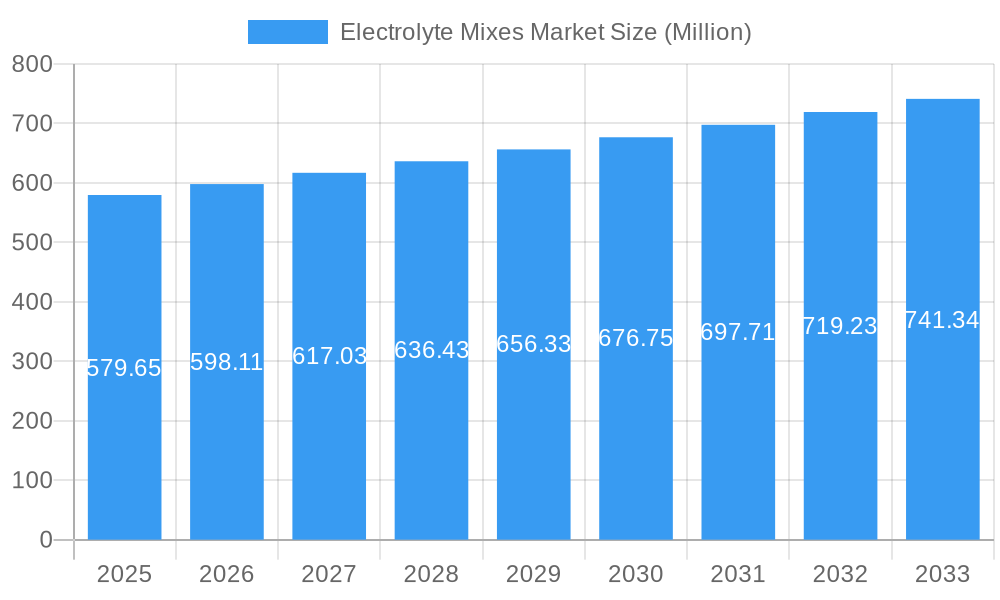
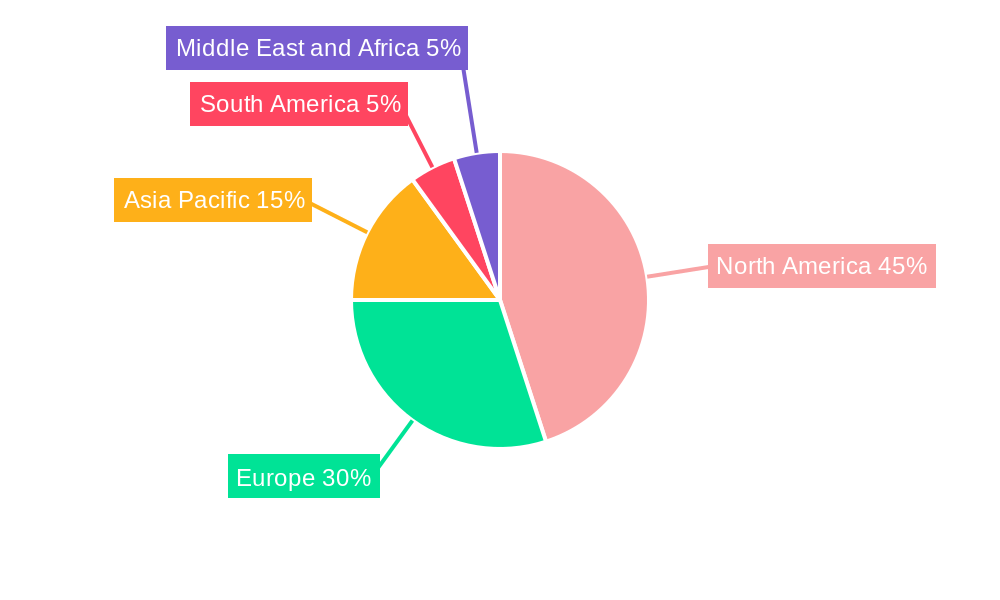
The electrolyte mixes market, valued at $579.65 million in 2025, is projected to experience steady growth, driven by increasing health consciousness, rising participation in sports and fitness activities, and a growing awareness of the importance of hydration and electrolyte balance. The market's compound annual growth rate (CAGR) of 2.81% from 2019-2024 indicates a consistent, albeit moderate, expansion. Key growth drivers include the increasing prevalence of dehydration-related illnesses, particularly among athletes and individuals engaging in strenuous physical activity. The convenience of ready-to-drink (RTD) beverages and the versatility of electrolyte powders and tablets are contributing factors to market expansion across various distribution channels, including supermarkets, convenience stores, pharmacies, and online retailers. The segmentation reveals a significant market share held by flavored electrolyte mixes, reflecting consumer preference for palatable options. Furthermore, the North American market is anticipated to dominate, followed by Europe and the Asia-Pacific region, driven by high disposable incomes and a robust health and wellness sector in these regions. However, factors such as the presence of substitute beverages and potential health concerns related to excessive sugar content in some products could act as market restraints. Competitive dynamics are shaped by a mix of established players like Nestlé and PepsiCo, alongside smaller specialized brands catering to niche consumer segments focused on natural and organic ingredients.
Electrolyte Mixes Market Market Size (In Million)
The forecast period of 2025-2033 suggests continued expansion, with a projected increase in market size driven by product innovation, including the development of electrolyte mixes targeting specific demographic groups and addressing unmet needs. The market's growth is expected to be influenced by evolving consumer preferences for functional beverages, increased focus on personalized nutrition, and the expansion of e-commerce platforms offering convenient access to electrolyte mixes. Companies are likely to focus on strategies such as product diversification, strategic partnerships, and targeted marketing campaigns to capture larger market shares and tap into emerging consumer trends in the health and wellness space. Regional variations in growth rates are anticipated, with regions demonstrating higher economic growth and greater health awareness exhibiting faster expansion.
Electrolyte Mixes Market Company Market Share
Electrolyte Mixes Market: A Comprehensive Market Report (2019-2033)
This dynamic report provides a comprehensive analysis of the Electrolyte Mixes Market, offering invaluable insights for industry stakeholders, investors, and strategic decision-makers. With a detailed examination of market trends, competitive dynamics, and future growth projections, this report is an essential resource for understanding this rapidly evolving sector. The study period covers 2019-2033, with 2025 serving as the base and estimated year. The forecast period spans 2025-2033, and the historical period encompasses 2019-2024. The market size is expected to reach xx Million by 2033.
Electrolyte Mixes Market Structure & Competitive Landscape
The Electrolyte Mixes Market exhibits a moderately concentrated structure, with several key players holding significant market share. The market's competitive landscape is characterized by intense rivalry, driven by innovation in product formulations, distribution strategies, and marketing campaigns. Major players include Tailwind Nutrition, Kent Corporation, Nestlé SA, PepsiCo Inc, Unilever PLC, Abbott Laboratories, LyteLine LLC, Otsuka Holdings Co Ltd, Vitalyte Sports Nutrition Inc, Ultima Health Products Inc, and many others. The concentration ratio (CR4) is estimated at xx%, indicating a moderately competitive market.
Innovation Drivers: The market is driven by continuous innovation in product formulations, focusing on enhanced taste, improved bioavailability, and functional benefits such as added probiotics or vitamins.
Regulatory Impacts: Government regulations concerning food safety and labeling significantly impact the market. Compliance with these regulations adds to production costs and influences product formulation.
Product Substitutes: Other hydration beverages, such as plain water, fruit juices, and sports drinks, pose a competitive threat to electrolyte mixes.
End-User Segmentation: The market caters to a broad range of end-users, including athletes, individuals engaging in strenuous physical activities, individuals suffering from dehydration, and the general health-conscious population.
M&A Trends: The market has witnessed a moderate level of mergers and acquisitions (M&A) activity in recent years, primarily driven by larger companies seeking to expand their product portfolios and market reach. The estimated M&A volume for the period 2019-2024 is xx deals.
Electrolyte Mixes Market Trends & Opportunities
The global Electrolyte Mixes Market is experiencing significant growth, driven by several key factors. The market is witnessing a rising demand for convenient and effective hydration solutions, particularly among health-conscious consumers. Technological advancements in product formulation and packaging enhance product appeal and shelf life. The increasing prevalence of health and wellness trends further fuels market growth. The market exhibits a compound annual growth rate (CAGR) of xx% during the forecast period (2025-2033). Market penetration rates vary across different segments, with online retail experiencing a rapid increase. The rise in disposable incomes and changing lifestyle patterns significantly impact consumer preferences and product choices. Competitive dynamics are characterized by continuous innovation and strategic partnerships to expand market reach and solidify market positions.
Dominant Markets & Segments in Electrolyte Mixes Market
Leading Regions/Countries: The North American market currently holds the largest market share, driven by high consumer awareness of health and wellness, coupled with strong distribution channels. The Asia-Pacific region is expected to witness substantial growth in the coming years due to rising disposable incomes and increasing health consciousness.
Dominant Segments:
- Product Type: RTD Beverages currently holds the largest market share, due to its convenience. However, Electrolyte Powders are exhibiting strong growth due to cost-effectiveness and versatility.
- Flavor: Flavored electrolyte mixes dominate the market, driven by consumer preference for enhanced taste and palatability.
- Distribution Channel: Supermarkets/Hypermarkets continue to be the primary distribution channel, but online retail stores are experiencing significant growth, driven by e-commerce expansion and increased consumer convenience.
Key Growth Drivers:
- Rising health consciousness: Increased awareness of the importance of hydration among consumers.
- Growing athletic population: Expanding participation in sports and fitness activities.
- Technological advancements: Continuous improvements in product formulations and packaging.
- E-commerce growth: Expansion of online retail channels enhancing product accessibility.
Electrolyte Mixes Market Product Analysis
Electrolyte mixes are available in various forms including Ready-to-Drink (RTD) beverages, powders, and tablets. Product innovation focuses on developing unique flavors, incorporating functional ingredients (e.g., probiotics, vitamins), and improving product stability and shelf life. The competitive advantage is largely determined by product quality, taste, price, and branding. Technological advancements, such as improved packaging and enhanced manufacturing processes, play a significant role in achieving superior product characteristics and cost-effectiveness.
Key Drivers, Barriers & Challenges in Electrolyte Mixes Market
Key Drivers:
- Rising consumer health consciousness
- Increased participation in sports and fitness activities
- Technological advancements in formulation and packaging
- Expansion of e-commerce platforms
Challenges & Restraints:
- Intense competition among established and emerging players
- Fluctuations in raw material prices
- Stringent regulatory requirements for food and beverage products
- Potential supply chain disruptions due to geopolitical factors
Growth Drivers in the Electrolyte Mixes Market Market
The market's growth is fueled by several key factors, including increased consumer awareness of the importance of hydration, the expansion of the fitness and sports industry, continuous innovation in product formulations, and the rise of e-commerce platforms. Government regulations, although creating challenges, also create opportunities for companies that comply and showcase their compliance.
Challenges Impacting Electrolyte Mixes Market Growth
Challenges include intense competition, volatile raw material prices, stringent regulatory hurdles, and potential supply chain disruptions. These challenges affect profitability and market growth. Furthermore, maintaining product quality and innovation under these constraints necessitates robust supply chain management.
Key Players Shaping the Electrolyte Mixes Market Market
- Tailwind Nutrition
- Kent Corporation
- Nestlé SA
- PepsiCo Inc
- Unilever PLC
- Abbott Laboratories
- LyteLine LLC
- Otsuka Holdings Co Ltd
- Vitalyte Sports Nutrition Inc
- Ultima Health Products Inc
Significant Electrolyte Mixes Market Industry Milestones
- JUL 2021: Nestlé Health Science acquired Nuun, expanding its portfolio in functional hydration products. This acquisition significantly impacted the market share dynamics.
- MAR 2022: Gatorade Canada's partnership with Canada Soccer strengthened its brand presence in the sports nutrition segment. This reflects the increasing importance of strategic partnerships in the market.
- MAY 2022: Liquid IV's launch of Hydration Multiplier+ showcased innovation in product formulations by incorporating probiotics, enhancing product value and attracting health-conscious consumers. This highlights the trend towards functional hydration products.
Future Outlook for Electrolyte Mixes Market Market
The future of the Electrolyte Mixes Market appears promising, driven by sustained growth in health consciousness, increasing demand for convenient hydration solutions, and continuous product innovation. Strategic partnerships, expansion into new markets, and the incorporation of functional ingredients will create significant opportunities for market players. The market is poised for further expansion, with substantial growth potential across various regions and segments.
Electrolyte Mixes Market Segmentation
-
1. Product Type
- 1.1. RTD Beverages
- 1.2. Electrolyte Powders
- 1.3. Tablets
-
2. Flavor
- 2.1. Flavored
- 2.2. Unflavored
-
3. Distribution Channel
- 3.1. Supermarkets/Hypermarkets
- 3.2. Convenience Stores
- 3.3. Pharmacies/Drug Stores
- 3.4. Online Retail Stores
- 3.5. Other Distribution Channels
Electrolyte Mixes Market Segmentation By Geography
-
1. North America
- 1.1. United States
- 1.2. Canada
- 1.3. Mexico
- 1.4. Rest of North America
-
2. Europe
- 2.1. United Kingdom
- 2.2. Germany
- 2.3. France
- 2.4. Russia
- 2.5. Italy
- 2.6. Spain
- 2.7. Rest of Europe
-
3. Asia Pacific
- 3.1. China
- 3.2. India
- 3.3. Japan
- 3.4. Australia
- 3.5. Rest of Asia Pacific
-
4. South America
- 4.1. Brazil
- 4.2. Argentina
- 4.3. Rest of South America
-
5. Middle East and Africa
- 5.1. South Africa
- 5.2. United Arab Emirates
- 5.3. Rest of Middle East and Africa
Electrolyte Mixes Market Regional Market Share
Geographic Coverage of Electrolyte Mixes Market
Electrolyte Mixes Market REPORT HIGHLIGHTS
| Aspects | Details |
|---|---|
| Study Period | 2020-2034 |
| Base Year | 2025 |
| Estimated Year | 2026 |
| Forecast Period | 2026-2034 |
| Historical Period | 2020-2025 |
| Growth Rate | CAGR of 2.81% from 2020-2034 |
| Segmentation |
|
Table of Contents
- 1. Introduction
- 1.1. Research Scope
- 1.2. Market Segmentation
- 1.3. Research Objective
- 1.4. Definitions and Assumptions
- 2. Executive Summary
- 2.1. Market Snapshot
- 3. Market Dynamics
- 3.1. Market Drivers
- 3.2. Market Restrains
- 3.3. Market Trends
- 3.4. Market Opportunities
- 4. Market Factor Analysis
- 4.1. Porters Five Forces
- 4.1.1. Bargaining Power of Suppliers
- 4.1.2. Bargaining Power of Buyers
- 4.1.3. Threat of New Entrants
- 4.1.4. Threat of Substitutes
- 4.1.5. Competitive Rivalry
- 4.2. PESTEL analysis
- 4.3. BCG Analysis
- 4.3.1. Stars (High Growth, High Market Share)
- 4.3.2. Cash Cows (Low Growth, High Market Share)
- 4.3.3. Question Mark (High Growth, Low Market Share)
- 4.3.4. Dogs (Low Growth, Low Market Share)
- 4.4. Ansoff Matrix Analysis
- 4.5. Supply Chain Analysis
- 4.6. Regulatory Landscape
- 4.7. Current Market Potential and Opportunity Assessment (TAM–SAM–SOM Framework)
- 4.8. TIR Analyst Note
- 4.1. Porters Five Forces
- 5. Market Analysis, Insights and Forecast 2021-2033
- 5.1. Market Analysis, Insights and Forecast - by Product Type
- 5.1.1. RTD Beverages
- 5.1.2. Electrolyte Powders
- 5.1.3. Tablets
- 5.2. Market Analysis, Insights and Forecast - by Flavor
- 5.2.1. Flavored
- 5.2.2. Unflavored
- 5.3. Market Analysis, Insights and Forecast - by Distribution Channel
- 5.3.1. Supermarkets/Hypermarkets
- 5.3.2. Convenience Stores
- 5.3.3. Pharmacies/Drug Stores
- 5.3.4. Online Retail Stores
- 5.3.5. Other Distribution Channels
- 5.4. Market Analysis, Insights and Forecast - by Region
- 5.4.1. North America
- 5.4.2. Europe
- 5.4.3. Asia Pacific
- 5.4.4. South America
- 5.4.5. Middle East and Africa
- 5.1. Market Analysis, Insights and Forecast - by Product Type
- 6. Global Electrolyte Mixes Market Analysis, Insights and Forecast, 2021-2033
- 6.1. Market Analysis, Insights and Forecast - by Product Type
- 6.1.1. RTD Beverages
- 6.1.2. Electrolyte Powders
- 6.1.3. Tablets
- 6.2. Market Analysis, Insights and Forecast - by Flavor
- 6.2.1. Flavored
- 6.2.2. Unflavored
- 6.3. Market Analysis, Insights and Forecast - by Distribution Channel
- 6.3.1. Supermarkets/Hypermarkets
- 6.3.2. Convenience Stores
- 6.3.3. Pharmacies/Drug Stores
- 6.3.4. Online Retail Stores
- 6.3.5. Other Distribution Channels
- 6.1. Market Analysis, Insights and Forecast - by Product Type
- 7. North America Electrolyte Mixes Market Analysis, Insights and Forecast, 2020-2032
- 7.1. Market Analysis, Insights and Forecast - by Product Type
- 7.1.1. RTD Beverages
- 7.1.2. Electrolyte Powders
- 7.1.3. Tablets
- 7.2. Market Analysis, Insights and Forecast - by Flavor
- 7.2.1. Flavored
- 7.2.2. Unflavored
- 7.3. Market Analysis, Insights and Forecast - by Distribution Channel
- 7.3.1. Supermarkets/Hypermarkets
- 7.3.2. Convenience Stores
- 7.3.3. Pharmacies/Drug Stores
- 7.3.4. Online Retail Stores
- 7.3.5. Other Distribution Channels
- 7.1. Market Analysis, Insights and Forecast - by Product Type
- 8. Europe Electrolyte Mixes Market Analysis, Insights and Forecast, 2020-2032
- 8.1. Market Analysis, Insights and Forecast - by Product Type
- 8.1.1. RTD Beverages
- 8.1.2. Electrolyte Powders
- 8.1.3. Tablets
- 8.2. Market Analysis, Insights and Forecast - by Flavor
- 8.2.1. Flavored
- 8.2.2. Unflavored
- 8.3. Market Analysis, Insights and Forecast - by Distribution Channel
- 8.3.1. Supermarkets/Hypermarkets
- 8.3.2. Convenience Stores
- 8.3.3. Pharmacies/Drug Stores
- 8.3.4. Online Retail Stores
- 8.3.5. Other Distribution Channels
- 8.1. Market Analysis, Insights and Forecast - by Product Type
- 9. Asia Pacific Electrolyte Mixes Market Analysis, Insights and Forecast, 2020-2032
- 9.1. Market Analysis, Insights and Forecast - by Product Type
- 9.1.1. RTD Beverages
- 9.1.2. Electrolyte Powders
- 9.1.3. Tablets
- 9.2. Market Analysis, Insights and Forecast - by Flavor
- 9.2.1. Flavored
- 9.2.2. Unflavored
- 9.3. Market Analysis, Insights and Forecast - by Distribution Channel
- 9.3.1. Supermarkets/Hypermarkets
- 9.3.2. Convenience Stores
- 9.3.3. Pharmacies/Drug Stores
- 9.3.4. Online Retail Stores
- 9.3.5. Other Distribution Channels
- 9.1. Market Analysis, Insights and Forecast - by Product Type
- 10. South America Electrolyte Mixes Market Analysis, Insights and Forecast, 2020-2032
- 10.1. Market Analysis, Insights and Forecast - by Product Type
- 10.1.1. RTD Beverages
- 10.1.2. Electrolyte Powders
- 10.1.3. Tablets
- 10.2. Market Analysis, Insights and Forecast - by Flavor
- 10.2.1. Flavored
- 10.2.2. Unflavored
- 10.3. Market Analysis, Insights and Forecast - by Distribution Channel
- 10.3.1. Supermarkets/Hypermarkets
- 10.3.2. Convenience Stores
- 10.3.3. Pharmacies/Drug Stores
- 10.3.4. Online Retail Stores
- 10.3.5. Other Distribution Channels
- 10.1. Market Analysis, Insights and Forecast - by Product Type
- 11. Middle East and Africa Electrolyte Mixes Market Analysis, Insights and Forecast, 2020-2032
- 11.1. Market Analysis, Insights and Forecast - by Product Type
- 11.1.1. RTD Beverages
- 11.1.2. Electrolyte Powders
- 11.1.3. Tablets
- 11.2. Market Analysis, Insights and Forecast - by Flavor
- 11.2.1. Flavored
- 11.2.2. Unflavored
- 11.3. Market Analysis, Insights and Forecast - by Distribution Channel
- 11.3.1. Supermarkets/Hypermarkets
- 11.3.2. Convenience Stores
- 11.3.3. Pharmacies/Drug Stores
- 11.3.4. Online Retail Stores
- 11.3.5. Other Distribution Channels
- 11.1. Market Analysis, Insights and Forecast - by Product Type
- 12. Competitive Analysis
- 12.1. Company Profiles
- 12.1.1 Tailwind Nutrition
- 12.1.1.1. Company Overview
- 12.1.1.2. Products
- 12.1.1.3. Company Financials
- 12.1.1.4. SWOT Analysis
- 12.1.2 Kent Corporation
- 12.1.2.1. Company Overview
- 12.1.2.2. Products
- 12.1.2.3. Company Financials
- 12.1.2.4. SWOT Analysis
- 12.1.3 Nestlé SA
- 12.1.3.1. Company Overview
- 12.1.3.2. Products
- 12.1.3.3. Company Financials
- 12.1.3.4. SWOT Analysis
- 12.1.4 PepsiCo Inc
- 12.1.4.1. Company Overview
- 12.1.4.2. Products
- 12.1.4.3. Company Financials
- 12.1.4.4. SWOT Analysis
- 12.1.5 Unilever PLC
- 12.1.5.1. Company Overview
- 12.1.5.2. Products
- 12.1.5.3. Company Financials
- 12.1.5.4. SWOT Analysis
- 12.1.6 Abbott Laboratories
- 12.1.6.1. Company Overview
- 12.1.6.2. Products
- 12.1.6.3. Company Financials
- 12.1.6.4. SWOT Analysis
- 12.1.7 LyteLine LLC
- 12.1.7.1. Company Overview
- 12.1.7.2. Products
- 12.1.7.3. Company Financials
- 12.1.7.4. SWOT Analysis
- 12.1.8 Otsuka Holdings Co Ltd
- 12.1.8.1. Company Overview
- 12.1.8.2. Products
- 12.1.8.3. Company Financials
- 12.1.8.4. SWOT Analysis
- 12.1.9 Vitalyte Sports Nutrition Inc *List Not Exhaustive
- 12.1.9.1. Company Overview
- 12.1.9.2. Products
- 12.1.9.3. Company Financials
- 12.1.9.4. SWOT Analysis
- 12.1.10 Ultima Health Products Inc
- 12.1.10.1. Company Overview
- 12.1.10.2. Products
- 12.1.10.3. Company Financials
- 12.1.10.4. SWOT Analysis
- 12.1.1 Tailwind Nutrition
- 12.2. Market Entropy
- 12.2.1 Company's Key Areas Served
- 12.2.2 Recent Developments
- 12.3. Company Market Share Analysis 2025
- 12.3.1 Top 5 Companies Market Share Analysis
- 12.3.2 Top 3 Companies Market Share Analysis
- 12.4. List of Potential Customers
- 13. Research Methodology
List of Figures
- Figure 1: Global Electrolyte Mixes Market Revenue Breakdown (Million, %) by Region 2025 & 2033
- Figure 2: North America Electrolyte Mixes Market Revenue (Million), by Product Type 2025 & 2033
- Figure 3: North America Electrolyte Mixes Market Revenue Share (%), by Product Type 2025 & 2033
- Figure 4: North America Electrolyte Mixes Market Revenue (Million), by Flavor 2025 & 2033
- Figure 5: North America Electrolyte Mixes Market Revenue Share (%), by Flavor 2025 & 2033
- Figure 6: North America Electrolyte Mixes Market Revenue (Million), by Distribution Channel 2025 & 2033
- Figure 7: North America Electrolyte Mixes Market Revenue Share (%), by Distribution Channel 2025 & 2033
- Figure 8: North America Electrolyte Mixes Market Revenue (Million), by Country 2025 & 2033
- Figure 9: North America Electrolyte Mixes Market Revenue Share (%), by Country 2025 & 2033
- Figure 10: Europe Electrolyte Mixes Market Revenue (Million), by Product Type 2025 & 2033
- Figure 11: Europe Electrolyte Mixes Market Revenue Share (%), by Product Type 2025 & 2033
- Figure 12: Europe Electrolyte Mixes Market Revenue (Million), by Flavor 2025 & 2033
- Figure 13: Europe Electrolyte Mixes Market Revenue Share (%), by Flavor 2025 & 2033
- Figure 14: Europe Electrolyte Mixes Market Revenue (Million), by Distribution Channel 2025 & 2033
- Figure 15: Europe Electrolyte Mixes Market Revenue Share (%), by Distribution Channel 2025 & 2033
- Figure 16: Europe Electrolyte Mixes Market Revenue (Million), by Country 2025 & 2033
- Figure 17: Europe Electrolyte Mixes Market Revenue Share (%), by Country 2025 & 2033
- Figure 18: Asia Pacific Electrolyte Mixes Market Revenue (Million), by Product Type 2025 & 2033
- Figure 19: Asia Pacific Electrolyte Mixes Market Revenue Share (%), by Product Type 2025 & 2033
- Figure 20: Asia Pacific Electrolyte Mixes Market Revenue (Million), by Flavor 2025 & 2033
- Figure 21: Asia Pacific Electrolyte Mixes Market Revenue Share (%), by Flavor 2025 & 2033
- Figure 22: Asia Pacific Electrolyte Mixes Market Revenue (Million), by Distribution Channel 2025 & 2033
- Figure 23: Asia Pacific Electrolyte Mixes Market Revenue Share (%), by Distribution Channel 2025 & 2033
- Figure 24: Asia Pacific Electrolyte Mixes Market Revenue (Million), by Country 2025 & 2033
- Figure 25: Asia Pacific Electrolyte Mixes Market Revenue Share (%), by Country 2025 & 2033
- Figure 26: South America Electrolyte Mixes Market Revenue (Million), by Product Type 2025 & 2033
- Figure 27: South America Electrolyte Mixes Market Revenue Share (%), by Product Type 2025 & 2033
- Figure 28: South America Electrolyte Mixes Market Revenue (Million), by Flavor 2025 & 2033
- Figure 29: South America Electrolyte Mixes Market Revenue Share (%), by Flavor 2025 & 2033
- Figure 30: South America Electrolyte Mixes Market Revenue (Million), by Distribution Channel 2025 & 2033
- Figure 31: South America Electrolyte Mixes Market Revenue Share (%), by Distribution Channel 2025 & 2033
- Figure 32: South America Electrolyte Mixes Market Revenue (Million), by Country 2025 & 2033
- Figure 33: South America Electrolyte Mixes Market Revenue Share (%), by Country 2025 & 2033
- Figure 34: Middle East and Africa Electrolyte Mixes Market Revenue (Million), by Product Type 2025 & 2033
- Figure 35: Middle East and Africa Electrolyte Mixes Market Revenue Share (%), by Product Type 2025 & 2033
- Figure 36: Middle East and Africa Electrolyte Mixes Market Revenue (Million), by Flavor 2025 & 2033
- Figure 37: Middle East and Africa Electrolyte Mixes Market Revenue Share (%), by Flavor 2025 & 2033
- Figure 38: Middle East and Africa Electrolyte Mixes Market Revenue (Million), by Distribution Channel 2025 & 2033
- Figure 39: Middle East and Africa Electrolyte Mixes Market Revenue Share (%), by Distribution Channel 2025 & 2033
- Figure 40: Middle East and Africa Electrolyte Mixes Market Revenue (Million), by Country 2025 & 2033
- Figure 41: Middle East and Africa Electrolyte Mixes Market Revenue Share (%), by Country 2025 & 2033
List of Tables
- Table 1: Global Electrolyte Mixes Market Revenue Million Forecast, by Product Type 2020 & 2033
- Table 2: Global Electrolyte Mixes Market Revenue Million Forecast, by Flavor 2020 & 2033
- Table 3: Global Electrolyte Mixes Market Revenue Million Forecast, by Distribution Channel 2020 & 2033
- Table 4: Global Electrolyte Mixes Market Revenue Million Forecast, by Region 2020 & 2033
- Table 5: Global Electrolyte Mixes Market Revenue Million Forecast, by Product Type 2020 & 2033
- Table 6: Global Electrolyte Mixes Market Revenue Million Forecast, by Flavor 2020 & 2033
- Table 7: Global Electrolyte Mixes Market Revenue Million Forecast, by Distribution Channel 2020 & 2033
- Table 8: Global Electrolyte Mixes Market Revenue Million Forecast, by Country 2020 & 2033
- Table 9: United States Electrolyte Mixes Market Revenue (Million) Forecast, by Application 2020 & 2033
- Table 10: Canada Electrolyte Mixes Market Revenue (Million) Forecast, by Application 2020 & 2033
- Table 11: Mexico Electrolyte Mixes Market Revenue (Million) Forecast, by Application 2020 & 2033
- Table 12: Rest of North America Electrolyte Mixes Market Revenue (Million) Forecast, by Application 2020 & 2033
- Table 13: Global Electrolyte Mixes Market Revenue Million Forecast, by Product Type 2020 & 2033
- Table 14: Global Electrolyte Mixes Market Revenue Million Forecast, by Flavor 2020 & 2033
- Table 15: Global Electrolyte Mixes Market Revenue Million Forecast, by Distribution Channel 2020 & 2033
- Table 16: Global Electrolyte Mixes Market Revenue Million Forecast, by Country 2020 & 2033
- Table 17: United Kingdom Electrolyte Mixes Market Revenue (Million) Forecast, by Application 2020 & 2033
- Table 18: Germany Electrolyte Mixes Market Revenue (Million) Forecast, by Application 2020 & 2033
- Table 19: France Electrolyte Mixes Market Revenue (Million) Forecast, by Application 2020 & 2033
- Table 20: Russia Electrolyte Mixes Market Revenue (Million) Forecast, by Application 2020 & 2033
- Table 21: Italy Electrolyte Mixes Market Revenue (Million) Forecast, by Application 2020 & 2033
- Table 22: Spain Electrolyte Mixes Market Revenue (Million) Forecast, by Application 2020 & 2033
- Table 23: Rest of Europe Electrolyte Mixes Market Revenue (Million) Forecast, by Application 2020 & 2033
- Table 24: Global Electrolyte Mixes Market Revenue Million Forecast, by Product Type 2020 & 2033
- Table 25: Global Electrolyte Mixes Market Revenue Million Forecast, by Flavor 2020 & 2033
- Table 26: Global Electrolyte Mixes Market Revenue Million Forecast, by Distribution Channel 2020 & 2033
- Table 27: Global Electrolyte Mixes Market Revenue Million Forecast, by Country 2020 & 2033
- Table 28: China Electrolyte Mixes Market Revenue (Million) Forecast, by Application 2020 & 2033
- Table 29: India Electrolyte Mixes Market Revenue (Million) Forecast, by Application 2020 & 2033
- Table 30: Japan Electrolyte Mixes Market Revenue (Million) Forecast, by Application 2020 & 2033
- Table 31: Australia Electrolyte Mixes Market Revenue (Million) Forecast, by Application 2020 & 2033
- Table 32: Rest of Asia Pacific Electrolyte Mixes Market Revenue (Million) Forecast, by Application 2020 & 2033
- Table 33: Global Electrolyte Mixes Market Revenue Million Forecast, by Product Type 2020 & 2033
- Table 34: Global Electrolyte Mixes Market Revenue Million Forecast, by Flavor 2020 & 2033
- Table 35: Global Electrolyte Mixes Market Revenue Million Forecast, by Distribution Channel 2020 & 2033
- Table 36: Global Electrolyte Mixes Market Revenue Million Forecast, by Country 2020 & 2033
- Table 37: Brazil Electrolyte Mixes Market Revenue (Million) Forecast, by Application 2020 & 2033
- Table 38: Argentina Electrolyte Mixes Market Revenue (Million) Forecast, by Application 2020 & 2033
- Table 39: Rest of South America Electrolyte Mixes Market Revenue (Million) Forecast, by Application 2020 & 2033
- Table 40: Global Electrolyte Mixes Market Revenue Million Forecast, by Product Type 2020 & 2033
- Table 41: Global Electrolyte Mixes Market Revenue Million Forecast, by Flavor 2020 & 2033
- Table 42: Global Electrolyte Mixes Market Revenue Million Forecast, by Distribution Channel 2020 & 2033
- Table 43: Global Electrolyte Mixes Market Revenue Million Forecast, by Country 2020 & 2033
- Table 44: South Africa Electrolyte Mixes Market Revenue (Million) Forecast, by Application 2020 & 2033
- Table 45: United Arab Emirates Electrolyte Mixes Market Revenue (Million) Forecast, by Application 2020 & 2033
- Table 46: Rest of Middle East and Africa Electrolyte Mixes Market Revenue (Million) Forecast, by Application 2020 & 2033
Frequently Asked Questions
1. What is the projected Compound Annual Growth Rate (CAGR) of the Electrolyte Mixes Market?
The projected CAGR is approximately 2.81%.
2. Which companies are prominent players in the Electrolyte Mixes Market?
Key companies in the market include Tailwind Nutrition, Kent Corporation, Nestlé SA, PepsiCo Inc, Unilever PLC, Abbott Laboratories, LyteLine LLC, Otsuka Holdings Co Ltd, Vitalyte Sports Nutrition Inc *List Not Exhaustive, Ultima Health Products Inc.
3. What are the main segments of the Electrolyte Mixes Market?
The market segments include Product Type, Flavor, Distribution Channel.
4. Can you provide details about the market size?
The market size is estimated to be USD 579.65 Million as of 2022.
5. What are some drivers contributing to market growth?
Rising Demand For Ready Meals Food Products to Influence Growth; Increasing Demand for Organic and Vegan Ready-to-Eat food products..
6. What are the notable trends driving market growth?
Surging Interest Among Consumers in Physical Activities. Including Gyms.
7. Are there any restraints impacting market growth?
Rising Concern Over Health Issues Associated with Processed Foods.
8. Can you provide examples of recent developments in the market?
MAY 2022: Liquid IV announced the launch of Hydration Multiplier+ Powdered Probiotic Kombucha, a blendable mixture that contains electrolytes, Liquid IV's BC30 Probiotic, which boasts an impressive 1 billion colony forming units (CFU), and a powdered kombucha. These components together help in boosting gut health.
9. What pricing options are available for accessing the report?
Pricing options include single-user, multi-user, and enterprise licenses priced at USD 4750, USD 5250, and USD 8750 respectively.
10. Is the market size provided in terms of value or volume?
The market size is provided in terms of value, measured in Million.
11. Are there any specific market keywords associated with the report?
Yes, the market keyword associated with the report is "Electrolyte Mixes Market," which aids in identifying and referencing the specific market segment covered.
12. How do I determine which pricing option suits my needs best?
The pricing options vary based on user requirements and access needs. Individual users may opt for single-user licenses, while businesses requiring broader access may choose multi-user or enterprise licenses for cost-effective access to the report.
13. Are there any additional resources or data provided in the Electrolyte Mixes Market report?
While the report offers comprehensive insights, it's advisable to review the specific contents or supplementary materials provided to ascertain if additional resources or data are available.
14. How can I stay updated on further developments or reports in the Electrolyte Mixes Market?
To stay informed about further developments, trends, and reports in the Electrolyte Mixes Market, consider subscribing to industry newsletters, following relevant companies and organizations, or regularly checking reputable industry news sources and publications.
Methodology
Step 1 - Identification of Relevant Samples Size from Population Database


Step 2 - Approaches for Defining Global Market Size (Value, Volume* & Price*)

Note*: In applicable scenarios
Step 3 - Data Sources
Primary Research
- Web Analytics
- Survey Reports
- Research Institute
- Latest Research Reports
- Opinion Leaders
Secondary Research
- Annual Reports
- White Paper
- Latest Press Release
- Industry Association
- Paid Database
- Investor Presentations

Step 4 - Data Triangulation
Involves using different sources of information in order to increase the validity of a study
These sources are likely to be stakeholders in a program - participants, other researchers, program staff, other community members, and so on.
Then we put all data in single framework & apply various statistical tools to find out the dynamic on the market.
During the analysis stage, feedback from the stakeholder groups would be compared to determine areas of agreement as well as areas of divergence