

Key Insights
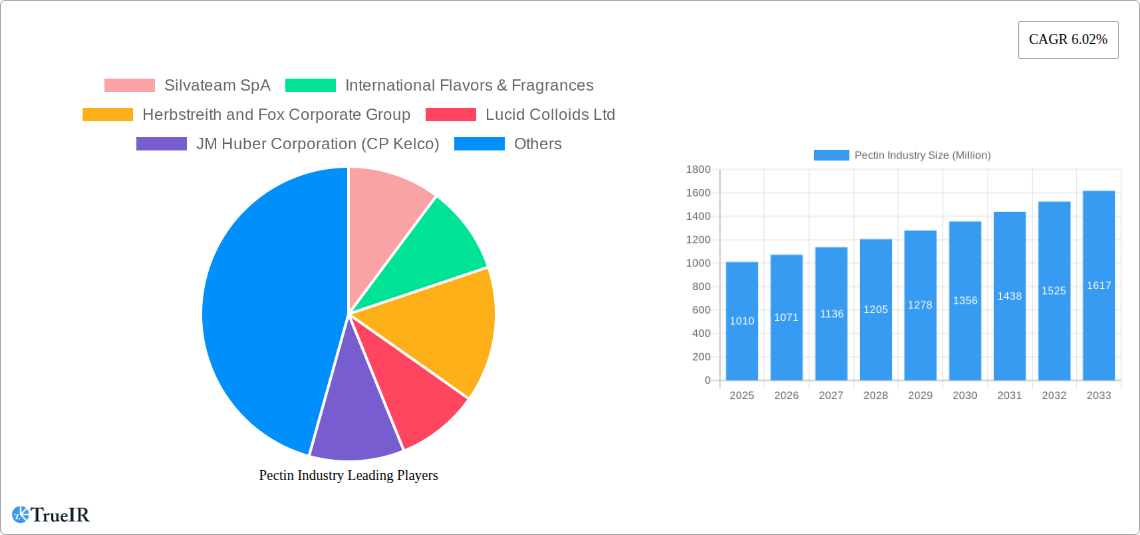
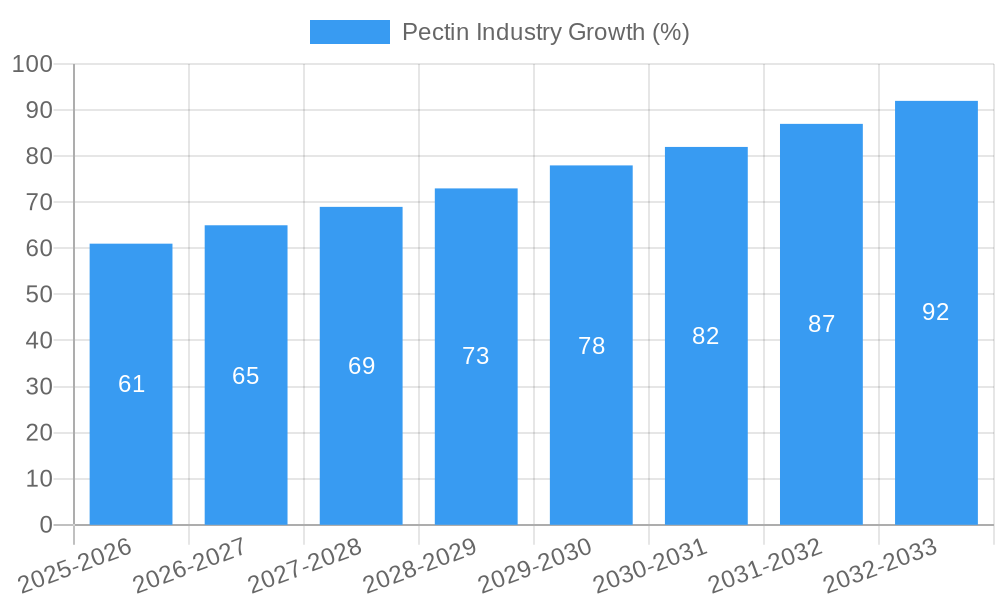
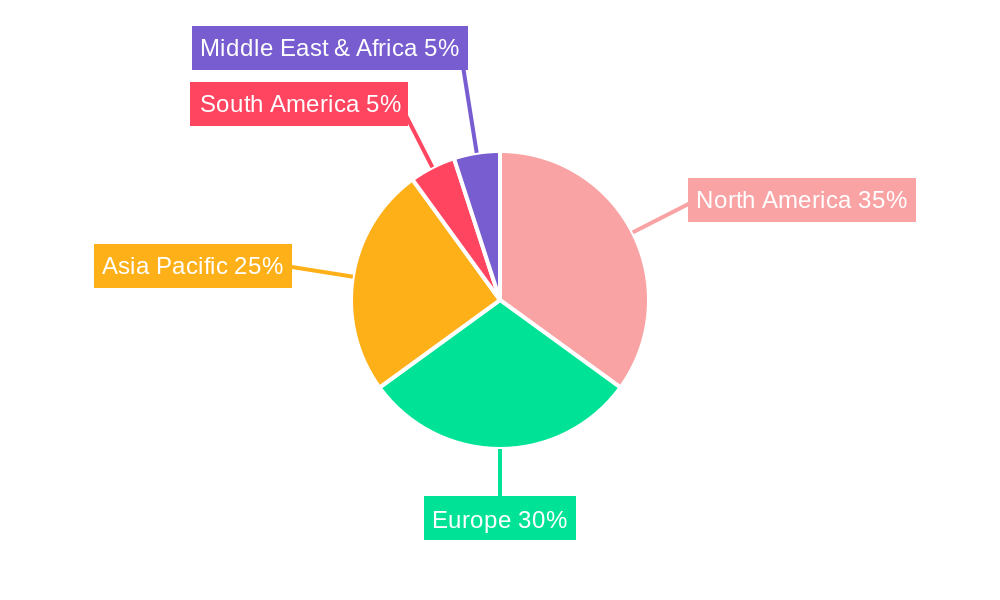
The global pectin market, valued at $1.01 billion in 2025, is projected to experience robust growth, driven by rising demand across diverse sectors. A Compound Annual Growth Rate (CAGR) of 6.02% from 2025 to 2033 indicates a significant expansion, fueled primarily by the increasing use of pectin as a natural gelling agent and stabilizer in the food and beverage industry. The food and beverage sector remains the dominant application segment, with a significant portion attributed to the growing popularity of jams, jellies, fruit preserves, and dairy products. Further growth is propelled by the expanding beauty and personal care sector, leveraging pectin's thickening and emulsifying properties in cosmetics and skincare products. The high methoxyl pectin type holds a considerable market share, followed by low methoxyl pectin, owing to their distinct functional properties and application suitability. Citrus fruits are the primary source of pectin, although sugar beet and apple pectin are also gaining traction due to their cost-effectiveness and diverse functionalities. Geographical dominance lies with North America and Europe, driven by high consumption levels and established food processing industries. However, Asia Pacific is poised for substantial growth, owing to increasing disposable incomes, changing dietary patterns and growing demand in emerging economies like India and China. While potential supply chain disruptions and price fluctuations in raw materials pose some challenges, the overall market outlook for pectin remains positive, fueled by consumer preference for natural ingredients and expanding applications in various industries.
The projected market size for 2033 can be estimated by applying the CAGR to the 2025 value. Considering a 6.02% CAGR, a conservative estimate would place the market value in 2033 above $1.6 billion. Factors influencing this growth include innovations in pectin extraction and modification techniques which are likely to lead to the development of new applications and improved product performance, further driving market expansion. The competitive landscape is marked by both established players like Cargill and Ingredion and smaller specialized producers. The ongoing focus on sustainability and the increasing preference for clean-label products are significant trends shaping the future of the pectin market. Companies are adapting their strategies to meet growing consumer demands for natural and functional ingredients.
Pectin Industry Market Report: A Comprehensive Analysis (2019-2033)
This dynamic report offers a comprehensive analysis of the global pectin industry, providing invaluable insights for businesses, investors, and researchers. We delve deep into market trends, competitive landscapes, and future projections, covering the period from 2019 to 2033. The report leverages extensive data analysis and expert insights to present a clear and actionable overview of this vital sector. The global pectin market is projected to reach xx Million by 2033, exhibiting significant growth potential.
Pectin Industry Market Structure & Competitive Landscape
The global pectin market is moderately concentrated, with several major players dominating the landscape. Key companies include Silvateam SpA, International Flavors & Fragrances (IFF), Herbstreith and Fox Corporate Group, Lucid Colloids Ltd, JM Huber Corporation (CP Kelco), Cargill Incorporated (Cargill), Pacific Pectin Inc, Foodchem International Corporation, Ingredion Incorporated (Ingredion), and Royal DSM (DSM). However, the presence of numerous smaller players indicates a dynamic and competitive environment.
Market Concentration: The top five players likely hold a combined market share of approximately xx%, suggesting moderate concentration. Further analysis will reveal precise concentration ratios based on revenue and production volume.
Innovation Drivers: Significant innovation is driven by the development of new pectin types with tailored functionalities, like improved gelling properties and label-friendly attributes. This responds to the increasing demand for clean-label products and functional foods.
Regulatory Impacts: Food safety regulations and labeling requirements significantly influence pectin production and application. Compliance with these regulations is a major factor shaping market dynamics.
Product Substitutes: While pectin has unique functionalities, alternative gelling agents exist, such as agar-agar, carrageenan, and gellan gum. The competitive landscape is shaped by the availability and cost-effectiveness of these substitutes.
End-User Segmentation: The market is segmented across food and beverages (largest segment), pharmaceuticals, beauty and personal care, and other applications. Detailed analysis of segment-specific growth rates and drivers are presented in subsequent sections.
M&A Trends: The pectin industry has witnessed a moderate level of mergers and acquisitions (M&A) activity in recent years. The report details specific transactions and their impact on market consolidation. Estimated M&A volume over the historical period (2019-2024) is estimated at xx Million USD.
Pectin Industry Market Trends & Opportunities
The global pectin market is experiencing robust growth, driven by several key trends. The market size is expected to witness a Compound Annual Growth Rate (CAGR) of xx% during the forecast period (2025-2033), reaching xx Million by 2033 from an estimated xx Million in 2025. This expansion is fueled by rising consumer demand for healthier food options, with pectin's role as a dietary fiber and natural gelling agent playing a crucial role. Technological advancements in pectin extraction and modification are leading to products with superior properties, further driving market growth.
Increased consumer preference for natural and clean-label ingredients is also a significant driver, contributing to higher pectin adoption across various food and beverage applications. The market is witnessing a shift towards low-methoxyl pectin (LMP) due to its versatility and suitability for low-sugar and other specialized applications. The growing popularity of plant-based foods and beverages is further boosting demand, especially for pectin derived from citrus fruits and apple sources. This trend opens avenues for innovation in food processing technology and presents ample opportunity for market players to leverage pectin’s functional and health benefits. Competitive dynamics are characterized by ongoing innovation, brand building, and strategic partnerships, influencing market share distribution and overall growth. Market penetration rates vary significantly across different segments and regions, with developed markets showing higher saturation levels compared to emerging economies.
Dominant Markets & Segments in Pectin Industry
The food and beverage sector represents the largest segment in the pectin market, holding an estimated xx% market share in 2025. Within this sector, the use of pectin in jams, jellies, and fruit preparations is dominant. However, significant growth is expected in other segments, especially in pharmaceuticals and beauty & personal care.
By Region: [Insert Dominant Region, e.g., North America or Europe] is the leading market for pectin, accounting for approximately xx% of global demand in 2025. Growth drivers in this region include:
- Strong demand from the food and beverage industry.
- Well-established food processing infrastructure.
- Favorable regulatory environment.
By Type: High methoxyl pectin (HMP) currently dominates the type segment due to its widespread use in traditional applications. However, Low methoxyl pectin (LMP) is experiencing faster growth owing to its suitability for low-sugar applications and its versatility.
By Source: Citrus fruits are the primary source of pectin, holding the largest market share. However, sugar beet and apple pectin are gaining traction, driven by sustainable sourcing and consumer preferences.
By Application: Food and beverage remains the dominant application, followed by pharmaceuticals (driven by pectin's use as an excipient) and, increasingly, beauty and personal care products.
Pectin Industry Product Analysis
Recent innovations in pectin technology have focused on developing pectins with enhanced functionalities, such as improved gel strength, clarity, and stability. This includes modified pectins tailored for specific applications, like low-sugar jams and specialized bakery fillings. Companies are investing in research and development to create pectins with unique sensory qualities and label-friendly attributes, aligning with consumer demand for clean-label and functional foods. These innovations have resulted in increased market penetration and competitive advantages for firms offering differentiated pectin products. The competitive landscape is shaped by the continuous introduction of new pectin types with tailored properties, addressing specific needs within diverse food and beverage segments.
Key Drivers, Barriers & Challenges in Pectin Industry
Key Drivers:
- Growing demand for clean-label and natural food ingredients.
- Rising health consciousness driving demand for dietary fiber.
- Increasing popularity of plant-based and low-sugar food products.
- Technological advancements in pectin extraction and modification processes leading to higher yield and improved functionality.
Challenges & Restraints:
- Fluctuations in raw material prices (citrus fruits, sugar beets) impacting production costs.
- Stringent regulatory requirements for food-grade pectins increasing compliance costs.
- Intense competition from other gelling agents and thickening solutions.
- Supply chain disruptions affecting raw material availability and timely delivery of finished products. These disruptions can lead to production delays and increased costs, potentially impacting profitability and market share.
Growth Drivers in the Pectin Industry Market
The pectin industry's growth is propelled by increasing demand for natural and healthy food ingredients. Technological innovations enabling the production of customized pectin types with enhanced functionalities cater to the evolving needs of the food and beverage industry. Favorable regulatory frameworks supporting the use of natural ingredients further stimulate market growth. These factors collectively contribute to an expanding market for pectin across various applications, from traditional jams to specialized food products.
Challenges Impacting Pectin Industry Growth
Challenges facing the pectin industry include price volatility of raw materials, stringent quality control and regulatory compliance requirements, and competition from synthetic alternatives. These factors can influence the cost of production and limit market expansion, particularly in price-sensitive segments. Supply chain vulnerabilities can result in production disruptions and impact the timely delivery of products to the market, affecting overall profitability.
Key Players Shaping the Pectin Industry Market
- Silvateam SpA
- International Flavors & Fragrances (IFF)
- Herbstreith and Fox Corporate Group
- Lucid Colloids Ltd
- JM Huber Corporation (CP Kelco)
- Cargill Incorporated (Cargill)
- Pacific Pectin Inc
- Foodchem International Corporation
- Ingredion Incorporated (Ingredion)
- Royal DSM (DSM)
Significant Pectin Industry Milestones
- September 2023: Cargill introduced a line of LM conventional (LMC) pectins, offering enhanced texture for fruit-filled food items and expanding its product portfolio.
- December 2023: Herbstreith & Fox GmbH & Co. KG expanded its market reach with the launch of a new subsidiary, H&F Italy SRL, in Milan.
- January 2024: IFF launched Grindsted Pectin FB 420, a new pectin designed for baking applications, showcasing ongoing innovation in the sector.
Future Outlook for Pectin Industry Market
The pectin industry is poised for continued growth, driven by ongoing innovation in product development, a rising demand for natural food additives and expanding applications beyond traditional food uses. Strategic partnerships and investments in research and development will play a crucial role in shaping market dynamics. The industry’s future success hinges on its capacity to adapt to evolving consumer preferences and effectively address challenges related to sustainability and supply chain efficiency. The global pectin market is projected to experience substantial growth in the coming years, driven by favorable industry trends.
Pectin Industry Segmentation
-
1. Source
- 1.1. Citrus Fruits
- 1.2. Sugar Beet
- 1.3. Apple
- 1.4. Other Sources
-
2. Application
- 2.1. Beauty and Personal Care
-
2.2. Food and Beverage
- 2.2.1. Jam, Jelly, and Preserve
- 2.2.2. Baked Goods
- 2.2.3. Dairy Products
- 2.2.4. Other Foods and Beverages
- 2.3. Pharmaceuticals
-
2.4. Other Applications
- 2.4.1. Edible Films and Coatings
- 2.4.2. Paper Substitutes
- 2.4.3. Foams and Plasticizers
-
3. Type
- 3.1. High Methoxyl Pectin
- 3.2. Low Methoxyl Pectin
Pectin Industry Segmentation By Geography
-
1. North America
- 1.1. United States
- 1.2. Canada
- 1.3. Mexico
- 1.4. Rest of North America
-
2. Europe
- 2.1. United Kingdom
- 2.2. Germany
- 2.3. France
- 2.4. Russia
- 2.5. Italy
- 2.6. Spain
- 2.7. Rest of Europe
-
3. Asia Pacific
- 3.1. India
- 3.2. China
- 3.3. Japan
- 3.4. Australia
- 3.5. Rest of Asia Pacific
-
4. South America
- 4.1. Brazil
- 4.2. Argentina
- 4.3. Rest of South America
- 5. Middle East
-
6. South Africa
- 6.1. Saudi Arabia
- 6.2. Rest of Middle East
Pectin Industry REPORT HIGHLIGHTS
| Aspects | Details |
|---|---|
| Study Period | 2019-2033 |
| Base Year | 2024 |
| Estimated Year | 2025 |
| Forecast Period | 2025-2033 |
| Historical Period | 2019-2024 |
| Growth Rate | CAGR of 6.02% from 2019-2033 |
| Segmentation |
|
Table of Contents
- 1. Introduction
- 1.1. Research Scope
- 1.2. Market Segmentation
- 1.3. Research Methodology
- 1.4. Definitions and Assumptions
- 2. Executive Summary
- 2.1. Introduction
- 3. Market Dynamics
- 3.1. Introduction
- 3.2. Market Drivers
- 3.2.1. Demand for Natural and Clean-label Ingredients; Rising Consumption of Packaged Food Products
- 3.3. Market Restrains
- 3.3.1. Availability of Economically Feasible Alternatives
- 3.4. Market Trends
- 3.4.1. Demand for Natural and Clean Label Ingredients
- 4. Market Factor Analysis
- 4.1. Porters Five Forces
- 4.2. Supply/Value Chain
- 4.3. PESTEL analysis
- 4.4. Market Entropy
- 4.5. Patent/Trademark Analysis
- 5. Global Pectin Industry Analysis, Insights and Forecast, 2019-2031
- 5.1. Market Analysis, Insights and Forecast - by Source
- 5.1.1. Citrus Fruits
- 5.1.2. Sugar Beet
- 5.1.3. Apple
- 5.1.4. Other Sources
- 5.2. Market Analysis, Insights and Forecast - by Application
- 5.2.1. Beauty and Personal Care
- 5.2.2. Food and Beverage
- 5.2.2.1. Jam, Jelly, and Preserve
- 5.2.2.2. Baked Goods
- 5.2.2.3. Dairy Products
- 5.2.2.4. Other Foods and Beverages
- 5.2.3. Pharmaceuticals
- 5.2.4. Other Applications
- 5.2.4.1. Edible Films and Coatings
- 5.2.4.2. Paper Substitutes
- 5.2.4.3. Foams and Plasticizers
- 5.3. Market Analysis, Insights and Forecast - by Type
- 5.3.1. High Methoxyl Pectin
- 5.3.2. Low Methoxyl Pectin
- 5.4. Market Analysis, Insights and Forecast - by Region
- 5.4.1. North America
- 5.4.2. Europe
- 5.4.3. Asia Pacific
- 5.4.4. South America
- 5.4.5. Middle East
- 5.4.6. South Africa
- 5.1. Market Analysis, Insights and Forecast - by Source
- 6. North America Pectin Industry Analysis, Insights and Forecast, 2019-2031
- 6.1. Market Analysis, Insights and Forecast - by Source
- 6.1.1. Citrus Fruits
- 6.1.2. Sugar Beet
- 6.1.3. Apple
- 6.1.4. Other Sources
- 6.2. Market Analysis, Insights and Forecast - by Application
- 6.2.1. Beauty and Personal Care
- 6.2.2. Food and Beverage
- 6.2.2.1. Jam, Jelly, and Preserve
- 6.2.2.2. Baked Goods
- 6.2.2.3. Dairy Products
- 6.2.2.4. Other Foods and Beverages
- 6.2.3. Pharmaceuticals
- 6.2.4. Other Applications
- 6.2.4.1. Edible Films and Coatings
- 6.2.4.2. Paper Substitutes
- 6.2.4.3. Foams and Plasticizers
- 6.3. Market Analysis, Insights and Forecast - by Type
- 6.3.1. High Methoxyl Pectin
- 6.3.2. Low Methoxyl Pectin
- 6.1. Market Analysis, Insights and Forecast - by Source
- 7. Europe Pectin Industry Analysis, Insights and Forecast, 2019-2031
- 7.1. Market Analysis, Insights and Forecast - by Source
- 7.1.1. Citrus Fruits
- 7.1.2. Sugar Beet
- 7.1.3. Apple
- 7.1.4. Other Sources
- 7.2. Market Analysis, Insights and Forecast - by Application
- 7.2.1. Beauty and Personal Care
- 7.2.2. Food and Beverage
- 7.2.2.1. Jam, Jelly, and Preserve
- 7.2.2.2. Baked Goods
- 7.2.2.3. Dairy Products
- 7.2.2.4. Other Foods and Beverages
- 7.2.3. Pharmaceuticals
- 7.2.4. Other Applications
- 7.2.4.1. Edible Films and Coatings
- 7.2.4.2. Paper Substitutes
- 7.2.4.3. Foams and Plasticizers
- 7.3. Market Analysis, Insights and Forecast - by Type
- 7.3.1. High Methoxyl Pectin
- 7.3.2. Low Methoxyl Pectin
- 7.1. Market Analysis, Insights and Forecast - by Source
- 8. Asia Pacific Pectin Industry Analysis, Insights and Forecast, 2019-2031
- 8.1. Market Analysis, Insights and Forecast - by Source
- 8.1.1. Citrus Fruits
- 8.1.2. Sugar Beet
- 8.1.3. Apple
- 8.1.4. Other Sources
- 8.2. Market Analysis, Insights and Forecast - by Application
- 8.2.1. Beauty and Personal Care
- 8.2.2. Food and Beverage
- 8.2.2.1. Jam, Jelly, and Preserve
- 8.2.2.2. Baked Goods
- 8.2.2.3. Dairy Products
- 8.2.2.4. Other Foods and Beverages
- 8.2.3. Pharmaceuticals
- 8.2.4. Other Applications
- 8.2.4.1. Edible Films and Coatings
- 8.2.4.2. Paper Substitutes
- 8.2.4.3. Foams and Plasticizers
- 8.3. Market Analysis, Insights and Forecast - by Type
- 8.3.1. High Methoxyl Pectin
- 8.3.2. Low Methoxyl Pectin
- 8.1. Market Analysis, Insights and Forecast - by Source
- 9. South America Pectin Industry Analysis, Insights and Forecast, 2019-2031
- 9.1. Market Analysis, Insights and Forecast - by Source
- 9.1.1. Citrus Fruits
- 9.1.2. Sugar Beet
- 9.1.3. Apple
- 9.1.4. Other Sources
- 9.2. Market Analysis, Insights and Forecast - by Application
- 9.2.1. Beauty and Personal Care
- 9.2.2. Food and Beverage
- 9.2.2.1. Jam, Jelly, and Preserve
- 9.2.2.2. Baked Goods
- 9.2.2.3. Dairy Products
- 9.2.2.4. Other Foods and Beverages
- 9.2.3. Pharmaceuticals
- 9.2.4. Other Applications
- 9.2.4.1. Edible Films and Coatings
- 9.2.4.2. Paper Substitutes
- 9.2.4.3. Foams and Plasticizers
- 9.3. Market Analysis, Insights and Forecast - by Type
- 9.3.1. High Methoxyl Pectin
- 9.3.2. Low Methoxyl Pectin
- 9.1. Market Analysis, Insights and Forecast - by Source
- 10. Middle East Pectin Industry Analysis, Insights and Forecast, 2019-2031
- 10.1. Market Analysis, Insights and Forecast - by Source
- 10.1.1. Citrus Fruits
- 10.1.2. Sugar Beet
- 10.1.3. Apple
- 10.1.4. Other Sources
- 10.2. Market Analysis, Insights and Forecast - by Application
- 10.2.1. Beauty and Personal Care
- 10.2.2. Food and Beverage
- 10.2.2.1. Jam, Jelly, and Preserve
- 10.2.2.2. Baked Goods
- 10.2.2.3. Dairy Products
- 10.2.2.4. Other Foods and Beverages
- 10.2.3. Pharmaceuticals
- 10.2.4. Other Applications
- 10.2.4.1. Edible Films and Coatings
- 10.2.4.2. Paper Substitutes
- 10.2.4.3. Foams and Plasticizers
- 10.3. Market Analysis, Insights and Forecast - by Type
- 10.3.1. High Methoxyl Pectin
- 10.3.2. Low Methoxyl Pectin
- 10.1. Market Analysis, Insights and Forecast - by Source
- 11. South Africa Pectin Industry Analysis, Insights and Forecast, 2019-2031
- 11.1. Market Analysis, Insights and Forecast - by Source
- 11.1.1. Citrus Fruits
- 11.1.2. Sugar Beet
- 11.1.3. Apple
- 11.1.4. Other Sources
- 11.2. Market Analysis, Insights and Forecast - by Application
- 11.2.1. Beauty and Personal Care
- 11.2.2. Food and Beverage
- 11.2.2.1. Jam, Jelly, and Preserve
- 11.2.2.2. Baked Goods
- 11.2.2.3. Dairy Products
- 11.2.2.4. Other Foods and Beverages
- 11.2.3. Pharmaceuticals
- 11.2.4. Other Applications
- 11.2.4.1. Edible Films and Coatings
- 11.2.4.2. Paper Substitutes
- 11.2.4.3. Foams and Plasticizers
- 11.3. Market Analysis, Insights and Forecast - by Type
- 11.3.1. High Methoxyl Pectin
- 11.3.2. Low Methoxyl Pectin
- 11.1. Market Analysis, Insights and Forecast - by Source
- 12. North America Pectin Industry Analysis, Insights and Forecast, 2019-2031
- 12.1. Market Analysis, Insights and Forecast - By Country/Sub-region
- 12.1.1 United States
- 12.1.2 Canada
- 12.1.3 Mexico
- 12.1.4 Rest of North America
- 13. Europe Pectin Industry Analysis, Insights and Forecast, 2019-2031
- 13.1. Market Analysis, Insights and Forecast - By Country/Sub-region
- 13.1.1 United Kingdom
- 13.1.2 Germany
- 13.1.3 France
- 13.1.4 Russia
- 13.1.5 Italy
- 13.1.6 Spain
- 13.1.7 Rest of Europe
- 14. Asia Pacific Pectin Industry Analysis, Insights and Forecast, 2019-2031
- 14.1. Market Analysis, Insights and Forecast - By Country/Sub-region
- 14.1.1 India
- 14.1.2 China
- 14.1.3 Japan
- 14.1.4 Australia
- 14.1.5 Rest of Asia Pacific
- 15. South America Pectin Industry Analysis, Insights and Forecast, 2019-2031
- 15.1. Market Analysis, Insights and Forecast - By Country/Sub-region
- 15.1.1 Brazil
- 15.1.2 Argentina
- 15.1.3 Rest of South America
- 16. Middle East & Africa Pectin Industry Analysis, Insights and Forecast, 2019-2031
- 16.1. Market Analysis, Insights and Forecast - By Country/Sub-region
- 16.1.1 UAE
- 16.1.2 South Africa
- 16.1.3 Saudi Arabia
- 16.1.4 Rest of MEA
- 17. South Africa Pectin Industry Analysis, Insights and Forecast, 2019-2031
- 17.1. Market Analysis, Insights and Forecast - By Country/Sub-region
- 17.1.1 Saudi Arabia
- 17.1.2 Rest of Middle East
- 18. Competitive Analysis
- 18.1. Global Market Share Analysis 2024
- 18.2. Company Profiles
- 18.2.1 Silvateam SpA
- 18.2.1.1. Overview
- 18.2.1.2. Products
- 18.2.1.3. SWOT Analysis
- 18.2.1.4. Recent Developments
- 18.2.1.5. Financials (Based on Availability)
- 18.2.2 International Flavors & Fragrances
- 18.2.2.1. Overview
- 18.2.2.2. Products
- 18.2.2.3. SWOT Analysis
- 18.2.2.4. Recent Developments
- 18.2.2.5. Financials (Based on Availability)
- 18.2.3 Herbstreith and Fox Corporate Group
- 18.2.3.1. Overview
- 18.2.3.2. Products
- 18.2.3.3. SWOT Analysis
- 18.2.3.4. Recent Developments
- 18.2.3.5. Financials (Based on Availability)
- 18.2.4 Lucid Colloids Ltd
- 18.2.4.1. Overview
- 18.2.4.2. Products
- 18.2.4.3. SWOT Analysis
- 18.2.4.4. Recent Developments
- 18.2.4.5. Financials (Based on Availability)
- 18.2.5 JM Huber Corporation (CP Kelco)
- 18.2.5.1. Overview
- 18.2.5.2. Products
- 18.2.5.3. SWOT Analysis
- 18.2.5.4. Recent Developments
- 18.2.5.5. Financials (Based on Availability)
- 18.2.6 Cargill Incorported
- 18.2.6.1. Overview
- 18.2.6.2. Products
- 18.2.6.3. SWOT Analysis
- 18.2.6.4. Recent Developments
- 18.2.6.5. Financials (Based on Availability)
- 18.2.7 Pacific Pectin Inc *List Not Exhaustive
- 18.2.7.1. Overview
- 18.2.7.2. Products
- 18.2.7.3. SWOT Analysis
- 18.2.7.4. Recent Developments
- 18.2.7.5. Financials (Based on Availability)
- 18.2.8 Foodchem International Corporation
- 18.2.8.1. Overview
- 18.2.8.2. Products
- 18.2.8.3. SWOT Analysis
- 18.2.8.4. Recent Developments
- 18.2.8.5. Financials (Based on Availability)
- 18.2.9 Ingredion Incorporated
- 18.2.9.1. Overview
- 18.2.9.2. Products
- 18.2.9.3. SWOT Analysis
- 18.2.9.4. Recent Developments
- 18.2.9.5. Financials (Based on Availability)
- 18.2.10 Royal DSM
- 18.2.10.1. Overview
- 18.2.10.2. Products
- 18.2.10.3. SWOT Analysis
- 18.2.10.4. Recent Developments
- 18.2.10.5. Financials (Based on Availability)
- 18.2.1 Silvateam SpA
List of Figures
- Figure 1: Global Pectin Industry Revenue Breakdown (Million, %) by Region 2024 & 2032
- Figure 2: North America Pectin Industry Revenue (Million), by Country 2024 & 2032
- Figure 3: North America Pectin Industry Revenue Share (%), by Country 2024 & 2032
- Figure 4: Europe Pectin Industry Revenue (Million), by Country 2024 & 2032
- Figure 5: Europe Pectin Industry Revenue Share (%), by Country 2024 & 2032
- Figure 6: Asia Pacific Pectin Industry Revenue (Million), by Country 2024 & 2032
- Figure 7: Asia Pacific Pectin Industry Revenue Share (%), by Country 2024 & 2032
- Figure 8: South America Pectin Industry Revenue (Million), by Country 2024 & 2032
- Figure 9: South America Pectin Industry Revenue Share (%), by Country 2024 & 2032
- Figure 10: Middle East & Africa Pectin Industry Revenue (Million), by Country 2024 & 2032
- Figure 11: Middle East & Africa Pectin Industry Revenue Share (%), by Country 2024 & 2032
- Figure 12: South Africa Pectin Industry Revenue (Million), by Country 2024 & 2032
- Figure 13: South Africa Pectin Industry Revenue Share (%), by Country 2024 & 2032
- Figure 14: North America Pectin Industry Revenue (Million), by Source 2024 & 2032
- Figure 15: North America Pectin Industry Revenue Share (%), by Source 2024 & 2032
- Figure 16: North America Pectin Industry Revenue (Million), by Application 2024 & 2032
- Figure 17: North America Pectin Industry Revenue Share (%), by Application 2024 & 2032
- Figure 18: North America Pectin Industry Revenue (Million), by Type 2024 & 2032
- Figure 19: North America Pectin Industry Revenue Share (%), by Type 2024 & 2032
- Figure 20: North America Pectin Industry Revenue (Million), by Country 2024 & 2032
- Figure 21: North America Pectin Industry Revenue Share (%), by Country 2024 & 2032
- Figure 22: Europe Pectin Industry Revenue (Million), by Source 2024 & 2032
- Figure 23: Europe Pectin Industry Revenue Share (%), by Source 2024 & 2032
- Figure 24: Europe Pectin Industry Revenue (Million), by Application 2024 & 2032
- Figure 25: Europe Pectin Industry Revenue Share (%), by Application 2024 & 2032
- Figure 26: Europe Pectin Industry Revenue (Million), by Type 2024 & 2032
- Figure 27: Europe Pectin Industry Revenue Share (%), by Type 2024 & 2032
- Figure 28: Europe Pectin Industry Revenue (Million), by Country 2024 & 2032
- Figure 29: Europe Pectin Industry Revenue Share (%), by Country 2024 & 2032
- Figure 30: Asia Pacific Pectin Industry Revenue (Million), by Source 2024 & 2032
- Figure 31: Asia Pacific Pectin Industry Revenue Share (%), by Source 2024 & 2032
- Figure 32: Asia Pacific Pectin Industry Revenue (Million), by Application 2024 & 2032
- Figure 33: Asia Pacific Pectin Industry Revenue Share (%), by Application 2024 & 2032
- Figure 34: Asia Pacific Pectin Industry Revenue (Million), by Type 2024 & 2032
- Figure 35: Asia Pacific Pectin Industry Revenue Share (%), by Type 2024 & 2032
- Figure 36: Asia Pacific Pectin Industry Revenue (Million), by Country 2024 & 2032
- Figure 37: Asia Pacific Pectin Industry Revenue Share (%), by Country 2024 & 2032
- Figure 38: South America Pectin Industry Revenue (Million), by Source 2024 & 2032
- Figure 39: South America Pectin Industry Revenue Share (%), by Source 2024 & 2032
- Figure 40: South America Pectin Industry Revenue (Million), by Application 2024 & 2032
- Figure 41: South America Pectin Industry Revenue Share (%), by Application 2024 & 2032
- Figure 42: South America Pectin Industry Revenue (Million), by Type 2024 & 2032
- Figure 43: South America Pectin Industry Revenue Share (%), by Type 2024 & 2032
- Figure 44: South America Pectin Industry Revenue (Million), by Country 2024 & 2032
- Figure 45: South America Pectin Industry Revenue Share (%), by Country 2024 & 2032
- Figure 46: Middle East Pectin Industry Revenue (Million), by Source 2024 & 2032
- Figure 47: Middle East Pectin Industry Revenue Share (%), by Source 2024 & 2032
- Figure 48: Middle East Pectin Industry Revenue (Million), by Application 2024 & 2032
- Figure 49: Middle East Pectin Industry Revenue Share (%), by Application 2024 & 2032
- Figure 50: Middle East Pectin Industry Revenue (Million), by Type 2024 & 2032
- Figure 51: Middle East Pectin Industry Revenue Share (%), by Type 2024 & 2032
- Figure 52: Middle East Pectin Industry Revenue (Million), by Country 2024 & 2032
- Figure 53: Middle East Pectin Industry Revenue Share (%), by Country 2024 & 2032
- Figure 54: South Africa Pectin Industry Revenue (Million), by Source 2024 & 2032
- Figure 55: South Africa Pectin Industry Revenue Share (%), by Source 2024 & 2032
- Figure 56: South Africa Pectin Industry Revenue (Million), by Application 2024 & 2032
- Figure 57: South Africa Pectin Industry Revenue Share (%), by Application 2024 & 2032
- Figure 58: South Africa Pectin Industry Revenue (Million), by Type 2024 & 2032
- Figure 59: South Africa Pectin Industry Revenue Share (%), by Type 2024 & 2032
- Figure 60: South Africa Pectin Industry Revenue (Million), by Country 2024 & 2032
- Figure 61: South Africa Pectin Industry Revenue Share (%), by Country 2024 & 2032
List of Tables
- Table 1: Global Pectin Industry Revenue Million Forecast, by Region 2019 & 2032
- Table 2: Global Pectin Industry Revenue Million Forecast, by Source 2019 & 2032
- Table 3: Global Pectin Industry Revenue Million Forecast, by Application 2019 & 2032
- Table 4: Global Pectin Industry Revenue Million Forecast, by Type 2019 & 2032
- Table 5: Global Pectin Industry Revenue Million Forecast, by Region 2019 & 2032
- Table 6: Global Pectin Industry Revenue Million Forecast, by Country 2019 & 2032
- Table 7: United States Pectin Industry Revenue (Million) Forecast, by Application 2019 & 2032
- Table 8: Canada Pectin Industry Revenue (Million) Forecast, by Application 2019 & 2032
- Table 9: Mexico Pectin Industry Revenue (Million) Forecast, by Application 2019 & 2032
- Table 10: Rest of North America Pectin Industry Revenue (Million) Forecast, by Application 2019 & 2032
- Table 11: Global Pectin Industry Revenue Million Forecast, by Country 2019 & 2032
- Table 12: United Kingdom Pectin Industry Revenue (Million) Forecast, by Application 2019 & 2032
- Table 13: Germany Pectin Industry Revenue (Million) Forecast, by Application 2019 & 2032
- Table 14: France Pectin Industry Revenue (Million) Forecast, by Application 2019 & 2032
- Table 15: Russia Pectin Industry Revenue (Million) Forecast, by Application 2019 & 2032
- Table 16: Italy Pectin Industry Revenue (Million) Forecast, by Application 2019 & 2032
- Table 17: Spain Pectin Industry Revenue (Million) Forecast, by Application 2019 & 2032
- Table 18: Rest of Europe Pectin Industry Revenue (Million) Forecast, by Application 2019 & 2032
- Table 19: Global Pectin Industry Revenue Million Forecast, by Country 2019 & 2032
- Table 20: India Pectin Industry Revenue (Million) Forecast, by Application 2019 & 2032
- Table 21: China Pectin Industry Revenue (Million) Forecast, by Application 2019 & 2032
- Table 22: Japan Pectin Industry Revenue (Million) Forecast, by Application 2019 & 2032
- Table 23: Australia Pectin Industry Revenue (Million) Forecast, by Application 2019 & 2032
- Table 24: Rest of Asia Pacific Pectin Industry Revenue (Million) Forecast, by Application 2019 & 2032
- Table 25: Global Pectin Industry Revenue Million Forecast, by Country 2019 & 2032
- Table 26: Brazil Pectin Industry Revenue (Million) Forecast, by Application 2019 & 2032
- Table 27: Argentina Pectin Industry Revenue (Million) Forecast, by Application 2019 & 2032
- Table 28: Rest of South America Pectin Industry Revenue (Million) Forecast, by Application 2019 & 2032
- Table 29: Global Pectin Industry Revenue Million Forecast, by Country 2019 & 2032
- Table 30: UAE Pectin Industry Revenue (Million) Forecast, by Application 2019 & 2032
- Table 31: South Africa Pectin Industry Revenue (Million) Forecast, by Application 2019 & 2032
- Table 32: Saudi Arabia Pectin Industry Revenue (Million) Forecast, by Application 2019 & 2032
- Table 33: Rest of MEA Pectin Industry Revenue (Million) Forecast, by Application 2019 & 2032
- Table 34: Global Pectin Industry Revenue Million Forecast, by Country 2019 & 2032
- Table 35: Saudi Arabia Pectin Industry Revenue (Million) Forecast, by Application 2019 & 2032
- Table 36: Rest of Middle East Pectin Industry Revenue (Million) Forecast, by Application 2019 & 2032
- Table 37: Global Pectin Industry Revenue Million Forecast, by Source 2019 & 2032
- Table 38: Global Pectin Industry Revenue Million Forecast, by Application 2019 & 2032
- Table 39: Global Pectin Industry Revenue Million Forecast, by Type 2019 & 2032
- Table 40: Global Pectin Industry Revenue Million Forecast, by Country 2019 & 2032
- Table 41: United States Pectin Industry Revenue (Million) Forecast, by Application 2019 & 2032
- Table 42: Canada Pectin Industry Revenue (Million) Forecast, by Application 2019 & 2032
- Table 43: Mexico Pectin Industry Revenue (Million) Forecast, by Application 2019 & 2032
- Table 44: Rest of North America Pectin Industry Revenue (Million) Forecast, by Application 2019 & 2032
- Table 45: Global Pectin Industry Revenue Million Forecast, by Source 2019 & 2032
- Table 46: Global Pectin Industry Revenue Million Forecast, by Application 2019 & 2032
- Table 47: Global Pectin Industry Revenue Million Forecast, by Type 2019 & 2032
- Table 48: Global Pectin Industry Revenue Million Forecast, by Country 2019 & 2032
- Table 49: United Kingdom Pectin Industry Revenue (Million) Forecast, by Application 2019 & 2032
- Table 50: Germany Pectin Industry Revenue (Million) Forecast, by Application 2019 & 2032
- Table 51: France Pectin Industry Revenue (Million) Forecast, by Application 2019 & 2032
- Table 52: Russia Pectin Industry Revenue (Million) Forecast, by Application 2019 & 2032
- Table 53: Italy Pectin Industry Revenue (Million) Forecast, by Application 2019 & 2032
- Table 54: Spain Pectin Industry Revenue (Million) Forecast, by Application 2019 & 2032
- Table 55: Rest of Europe Pectin Industry Revenue (Million) Forecast, by Application 2019 & 2032
- Table 56: Global Pectin Industry Revenue Million Forecast, by Source 2019 & 2032
- Table 57: Global Pectin Industry Revenue Million Forecast, by Application 2019 & 2032
- Table 58: Global Pectin Industry Revenue Million Forecast, by Type 2019 & 2032
- Table 59: Global Pectin Industry Revenue Million Forecast, by Country 2019 & 2032
- Table 60: India Pectin Industry Revenue (Million) Forecast, by Application 2019 & 2032
- Table 61: China Pectin Industry Revenue (Million) Forecast, by Application 2019 & 2032
- Table 62: Japan Pectin Industry Revenue (Million) Forecast, by Application 2019 & 2032
- Table 63: Australia Pectin Industry Revenue (Million) Forecast, by Application 2019 & 2032
- Table 64: Rest of Asia Pacific Pectin Industry Revenue (Million) Forecast, by Application 2019 & 2032
- Table 65: Global Pectin Industry Revenue Million Forecast, by Source 2019 & 2032
- Table 66: Global Pectin Industry Revenue Million Forecast, by Application 2019 & 2032
- Table 67: Global Pectin Industry Revenue Million Forecast, by Type 2019 & 2032
- Table 68: Global Pectin Industry Revenue Million Forecast, by Country 2019 & 2032
- Table 69: Brazil Pectin Industry Revenue (Million) Forecast, by Application 2019 & 2032
- Table 70: Argentina Pectin Industry Revenue (Million) Forecast, by Application 2019 & 2032
- Table 71: Rest of South America Pectin Industry Revenue (Million) Forecast, by Application 2019 & 2032
- Table 72: Global Pectin Industry Revenue Million Forecast, by Source 2019 & 2032
- Table 73: Global Pectin Industry Revenue Million Forecast, by Application 2019 & 2032
- Table 74: Global Pectin Industry Revenue Million Forecast, by Type 2019 & 2032
- Table 75: Global Pectin Industry Revenue Million Forecast, by Country 2019 & 2032
- Table 76: Global Pectin Industry Revenue Million Forecast, by Source 2019 & 2032
- Table 77: Global Pectin Industry Revenue Million Forecast, by Application 2019 & 2032
- Table 78: Global Pectin Industry Revenue Million Forecast, by Type 2019 & 2032
- Table 79: Global Pectin Industry Revenue Million Forecast, by Country 2019 & 2032
- Table 80: Saudi Arabia Pectin Industry Revenue (Million) Forecast, by Application 2019 & 2032
- Table 81: Rest of Middle East Pectin Industry Revenue (Million) Forecast, by Application 2019 & 2032
Frequently Asked Questions
1. What is the projected Compound Annual Growth Rate (CAGR) of the Pectin Industry?
The projected CAGR is approximately 6.02%.
2. Which companies are prominent players in the Pectin Industry?
Key companies in the market include Silvateam SpA, International Flavors & Fragrances, Herbstreith and Fox Corporate Group, Lucid Colloids Ltd, JM Huber Corporation (CP Kelco), Cargill Incorported, Pacific Pectin Inc *List Not Exhaustive, Foodchem International Corporation, Ingredion Incorporated, Royal DSM.
3. What are the main segments of the Pectin Industry?
The market segments include Source, Application, Type.
4. Can you provide details about the market size?
The market size is estimated to be USD 1.01 Million as of 2022.
5. What are some drivers contributing to market growth?
Demand for Natural and Clean-label Ingredients; Rising Consumption of Packaged Food Products.
6. What are the notable trends driving market growth?
Demand for Natural and Clean Label Ingredients.
7. Are there any restraints impacting market growth?
Availability of Economically Feasible Alternatives.
8. Can you provide examples of recent developments in the market?
January 2024: IFF launched Grindsted Pectin FB 420 for baking applications. It is ideal for baking applications, has unique sensory qualities for bake-stable fruit fillings, and is label-friendly and process-efficient.
9. What pricing options are available for accessing the report?
Pricing options include single-user, multi-user, and enterprise licenses priced at USD 4750, USD 5250, and USD 8750 respectively.
10. Is the market size provided in terms of value or volume?
The market size is provided in terms of value, measured in Million.
11. Are there any specific market keywords associated with the report?
Yes, the market keyword associated with the report is "Pectin Industry," which aids in identifying and referencing the specific market segment covered.
12. How do I determine which pricing option suits my needs best?
The pricing options vary based on user requirements and access needs. Individual users may opt for single-user licenses, while businesses requiring broader access may choose multi-user or enterprise licenses for cost-effective access to the report.
13. Are there any additional resources or data provided in the Pectin Industry report?
While the report offers comprehensive insights, it's advisable to review the specific contents or supplementary materials provided to ascertain if additional resources or data are available.
14. How can I stay updated on further developments or reports in the Pectin Industry?
To stay informed about further developments, trends, and reports in the Pectin Industry, consider subscribing to industry newsletters, following relevant companies and organizations, or regularly checking reputable industry news sources and publications.
Methodology
Step 1 - Identification of Relevant Samples Size from Population Database


Step 2 - Approaches for Defining Global Market Size (Value, Volume* & Price*)

Note*: In applicable scenarios
Step 3 - Data Sources
Primary Research
- Web Analytics
- Survey Reports
- Research Institute
- Latest Research Reports
- Opinion Leaders
Secondary Research
- Annual Reports
- White Paper
- Latest Press Release
- Industry Association
- Paid Database
- Investor Presentations

Step 4 - Data Triangulation
Involves using different sources of information in order to increase the validity of a study
These sources are likely to be stakeholders in a program - participants, other researchers, program staff, other community members, and so on.
Then we put all data in single framework & apply various statistical tools to find out the dynamic on the market.
During the analysis stage, feedback from the stakeholder groups would be compared to determine areas of agreement as well as areas of divergence
