

Key Insights
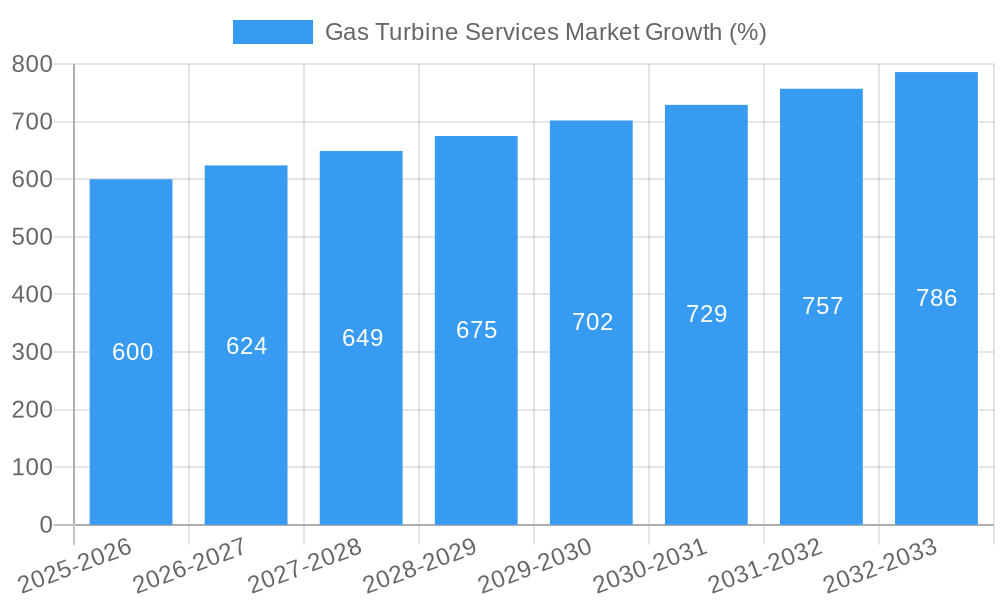
The global gas turbine services market is experiencing robust growth, driven by the increasing demand for electricity and the aging infrastructure of existing gas turbine power plants. A compound annual growth rate (CAGR) exceeding 4% indicates a significant expansion projected through 2033. This growth is fueled by several key factors, including the rising adoption of combined cycle gas turbines for improved efficiency and reduced emissions, the growing need for preventative maintenance and upgrades to extend the lifespan of existing assets, and the expansion of the oil and gas sector in developing economies. The market segmentation reveals a substantial share held by the combined cycle gas turbine segment due to its superior efficiency compared to open cycle systems. Similarly, the power generation industry dominates end-user applications, reflecting the critical role of gas turbines in power production. The geographical distribution shows strong growth in regions like Asia-Pacific, driven by rapid industrialization and increasing energy demands, while North America and Europe maintain substantial market shares due to their established energy infrastructure and ongoing maintenance requirements. Competition is intense, with major players like GE, Siemens, and Mitsubishi Heavy Industries, alongside regional players like Bharat Heavy Electricals Limited, vying for market share through technological innovation and service offerings.
The market faces some challenges. The high initial investment costs associated with gas turbine services and the cyclical nature of the energy sector can impact growth. Furthermore, stringent environmental regulations and increasing pressure to reduce carbon emissions are prompting a shift towards cleaner energy sources, potentially affecting long-term growth projections. Nevertheless, the growing emphasis on optimizing existing gas turbine fleet performance through sophisticated service contracts, including predictive maintenance and performance enhancements, suggests a positive outlook for the market. Continuous advancements in gas turbine technology, coupled with rising energy demand in developing nations, are expected to drive further market expansion. The diverse service offerings, encompassing inspections, repairs, upgrades, and parts replacements, contribute to the market's overall dynamism and continued growth trajectory.

Gas Turbine Services Market: A Comprehensive Report (2019-2033)
This dynamic report provides a thorough analysis of the Gas Turbine Services Market, offering invaluable insights for industry stakeholders, investors, and researchers. Covering the period 2019-2033, with a base year of 2025 and a forecast period of 2025-2033, this study unveils the market's structure, competitive landscape, dominant segments, key players, and future growth trajectory. The market is projected to reach xx Million by 2033, exhibiting a CAGR of xx% during the forecast period.
Gas Turbine Services Market Structure & Competitive Landscape
The Gas Turbine Services Market is characterized by a moderately concentrated structure, with key players holding significant market share. The Herfindahl-Hirschman Index (HHI) is estimated at xx, indicating a moderately competitive landscape. Innovation in areas such as digitalization, predictive maintenance, and advanced materials is driving market growth. Stringent environmental regulations, particularly concerning emissions, significantly impact market dynamics, pushing players towards cleaner technologies. Product substitutes, such as renewable energy sources, pose a competitive threat, though gas turbines remain vital for baseload power generation and peak demand management. The market shows significant end-user segmentation across power generation, oil & gas, and other industries. M&A activity remains moderate, with an estimated xx number of transactions recorded between 2019 and 2024, primarily driven by expansion strategies and technological integration.
- Market Concentration: HHI estimated at xx
- Innovation Drivers: Digitalization, predictive maintenance, advanced materials
- Regulatory Impacts: Stringent emission norms, renewable energy policies
- Product Substitutes: Renewable energy sources (solar, wind)
- End-User Segmentation: Power generation, Oil & Gas, Other
- M&A Trends: xx transactions between 2019-2024
Gas Turbine Services Market Market Trends & Opportunities
The Gas Turbine Services Market is experiencing robust growth, driven by increasing energy demand, particularly in developing economies. Technological advancements, including the integration of AI and IoT for improved efficiency and predictive maintenance, are significantly shaping market dynamics. The market's growth is also influenced by evolving consumer preferences toward environmentally friendly and cost-effective solutions. Competitive dynamics are intense, with leading players focusing on strategic partnerships, technological innovation, and service diversification to enhance their market position. The market penetration rate for advanced services is currently at xx%, and is projected to reach xx% by 2033. This growth is supported by a shift in consumer demand toward advanced predictive maintenance and operational optimization services. The market size is expected to grow from xx Million in 2025 to xx Million in 2033.
Dominant Markets & Segments in Gas Turbine Services Market
The Power generation sector constitutes the largest end-user segment, accounting for approximately xx% of the market. Geographically, the Asia-Pacific region is currently the dominant market, fueled by rapid infrastructure development and increasing energy demand. The 31-120 MW capacity segment holds the largest market share among capacity segments, driven by its suitability for a wide range of applications. Combined cycle gas turbines represent the leading type, owing to their higher efficiency compared to open-cycle systems.
- Key Growth Drivers:
- Rapid infrastructure development in developing economies.
- Rising energy demand globally.
- Stringent emission regulations driving demand for efficient and cleaner technologies.
- Favorable government policies and incentives.
- Market Dominance:
- Region: Asia-Pacific
- Capacity Segment: 31-120 MW
- Type: Combined Cycle
- End-User: Power Generation
Gas Turbine Services Market Product Analysis
Significant product innovations are focused on enhancing efficiency, reducing emissions, and improving the reliability of gas turbines. This includes advancements in digital technologies such as predictive maintenance software, remote diagnostics, and advanced control systems that optimize gas turbine performance. These innovations improve operational efficiency, reduce downtime, and minimize maintenance costs making them highly attractive to end-users.
Key Drivers, Barriers & Challenges in Gas Turbine Services Market
Key Drivers:
- Increasing global energy demand.
- Technological advancements in gas turbine efficiency and emissions control.
- Government regulations promoting cleaner energy sources and improved maintenance practices.
Key Challenges and Restraints:
- Fluctuations in fuel prices impacting operational costs.
- Stringent environmental regulations demanding significant investments in upgrades.
- Intense competition among existing players and emerging technologies. Supply chain disruptions and material cost volatility have been estimated to impact the market growth by approximately xx% in 2024.
Growth Drivers in the Gas Turbine Services Market Market
The market's growth is significantly driven by the increasing demand for reliable and efficient power generation, especially in developing countries. Advancements in technologies like predictive maintenance and digitalization improve operational efficiency and reduce maintenance costs, further accelerating growth. Favorable government policies and investments in infrastructure projects also contribute significantly to the market's expansion.
Challenges Impacting Gas Turbine Services Market Growth
Challenges include volatility in fuel prices, stringent environmental regulations necessitating costly upgrades and the competitive pressure from alternative energy technologies. Supply chain disruptions and skilled labor shortages also constrain growth. Furthermore, the high initial investment costs for gas turbine services can pose a barrier for some potential customers.
Key Players Shaping the Gas Turbine Services Market Market
- Solar Turbines Incorporated
- Ansaldo Energia SpA
- Bharat Heavy Electricals Limited
- Siemens AG
- Wartsila Oyj Abp
- General Electric Company
- Kawasaki Heavy Industries Ltd
- IHI Corporation
- Mitsubishi Heavy Industries Ltd
Significant Gas Turbine Services Market Industry Milestones
- 2020: Siemens AG launched its new digital platform for gas turbine diagnostics and predictive maintenance.
- 2022: General Electric Company acquired a smaller gas turbine service provider, expanding its service capabilities.
- 2023: Wartsila Oyj Abp invested significantly in research and development to produce next-generation, highly efficient turbines. (Further details for other years need to be added here).
Future Outlook for Gas Turbine Services Market Market
The Gas Turbine Services Market is poised for continued growth, driven by sustained global energy demand, ongoing technological advancements, and supportive government policies. Strategic opportunities exist in developing markets and in providing advanced services such as digitalization and predictive maintenance. The market is expected to see increased consolidation as larger players seek to expand their market share.
Gas Turbine Services Market Segmentation
-
1. Capacity
- 1.1. Less than 30 MW
- 1.2. 31-120 MW
- 1.3. Above 120 MW
-
2. Type
- 2.1. Combined Cycle
- 2.2. Open Cycle
-
3. End-User Industry
- 3.1. Power
- 3.2. Oil and Gas
- 3.3. Other End-user Industries
Gas Turbine Services Market Segmentation By Geography
- 1. Asia Pacific
- 2. North America
- 3. Europe
- 4. South America
- 5. Middle East and Africa

Gas Turbine Services Market REPORT HIGHLIGHTS
| Aspects | Details |
|---|---|
| Study Period | 2019-2033 |
| Base Year | 2024 |
| Estimated Year | 2025 |
| Forecast Period | 2025-2033 |
| Historical Period | 2019-2024 |
| Growth Rate | CAGR of > 4.00% from 2019-2033 |
| Segmentation |
|
Table of Contents
- 1. Introduction
- 1.1. Research Scope
- 1.2. Market Segmentation
- 1.3. Research Methodology
- 1.4. Definitions and Assumptions
- 2. Executive Summary
- 2.1. Introduction
- 3. Market Dynamics
- 3.1. Introduction
- 3.2. Market Drivers
- 3.2.1. 4.; Rising Power Demand4.; Substantial Investments And Efforts To Modernize The T&D Grid
- 3.3. Market Restrains
- 3.3.1. 4.; Rising Distributed Energy Generation
- 3.4. Market Trends
- 3.4.1. Power Sector is Expected to Dominate the Market
- 4. Market Factor Analysis
- 4.1. Porters Five Forces
- 4.2. Supply/Value Chain
- 4.3. PESTEL analysis
- 4.4. Market Entropy
- 4.5. Patent/Trademark Analysis
- 5. Global Gas Turbine Services Market Analysis, Insights and Forecast, 2019-2031
- 5.1. Market Analysis, Insights and Forecast - by Capacity
- 5.1.1. Less than 30 MW
- 5.1.2. 31-120 MW
- 5.1.3. Above 120 MW
- 5.2. Market Analysis, Insights and Forecast - by Type
- 5.2.1. Combined Cycle
- 5.2.2. Open Cycle
- 5.3. Market Analysis, Insights and Forecast - by End-User Industry
- 5.3.1. Power
- 5.3.2. Oil and Gas
- 5.3.3. Other End-user Industries
- 5.4. Market Analysis, Insights and Forecast - by Region
- 5.4.1. Asia Pacific
- 5.4.2. North America
- 5.4.3. Europe
- 5.4.4. South America
- 5.4.5. Middle East and Africa
- 5.1. Market Analysis, Insights and Forecast - by Capacity
- 6. Asia Pacific Gas Turbine Services Market Analysis, Insights and Forecast, 2019-2031
- 6.1. Market Analysis, Insights and Forecast - by Capacity
- 6.1.1. Less than 30 MW
- 6.1.2. 31-120 MW
- 6.1.3. Above 120 MW
- 6.2. Market Analysis, Insights and Forecast - by Type
- 6.2.1. Combined Cycle
- 6.2.2. Open Cycle
- 6.3. Market Analysis, Insights and Forecast - by End-User Industry
- 6.3.1. Power
- 6.3.2. Oil and Gas
- 6.3.3. Other End-user Industries
- 6.1. Market Analysis, Insights and Forecast - by Capacity
- 7. North America Gas Turbine Services Market Analysis, Insights and Forecast, 2019-2031
- 7.1. Market Analysis, Insights and Forecast - by Capacity
- 7.1.1. Less than 30 MW
- 7.1.2. 31-120 MW
- 7.1.3. Above 120 MW
- 7.2. Market Analysis, Insights and Forecast - by Type
- 7.2.1. Combined Cycle
- 7.2.2. Open Cycle
- 7.3. Market Analysis, Insights and Forecast - by End-User Industry
- 7.3.1. Power
- 7.3.2. Oil and Gas
- 7.3.3. Other End-user Industries
- 7.1. Market Analysis, Insights and Forecast - by Capacity
- 8. Europe Gas Turbine Services Market Analysis, Insights and Forecast, 2019-2031
- 8.1. Market Analysis, Insights and Forecast - by Capacity
- 8.1.1. Less than 30 MW
- 8.1.2. 31-120 MW
- 8.1.3. Above 120 MW
- 8.2. Market Analysis, Insights and Forecast - by Type
- 8.2.1. Combined Cycle
- 8.2.2. Open Cycle
- 8.3. Market Analysis, Insights and Forecast - by End-User Industry
- 8.3.1. Power
- 8.3.2. Oil and Gas
- 8.3.3. Other End-user Industries
- 8.1. Market Analysis, Insights and Forecast - by Capacity
- 9. South America Gas Turbine Services Market Analysis, Insights and Forecast, 2019-2031
- 9.1. Market Analysis, Insights and Forecast - by Capacity
- 9.1.1. Less than 30 MW
- 9.1.2. 31-120 MW
- 9.1.3. Above 120 MW
- 9.2. Market Analysis, Insights and Forecast - by Type
- 9.2.1. Combined Cycle
- 9.2.2. Open Cycle
- 9.3. Market Analysis, Insights and Forecast - by End-User Industry
- 9.3.1. Power
- 9.3.2. Oil and Gas
- 9.3.3. Other End-user Industries
- 9.1. Market Analysis, Insights and Forecast - by Capacity
- 10. Middle East and Africa Gas Turbine Services Market Analysis, Insights and Forecast, 2019-2031
- 10.1. Market Analysis, Insights and Forecast - by Capacity
- 10.1.1. Less than 30 MW
- 10.1.2. 31-120 MW
- 10.1.3. Above 120 MW
- 10.2. Market Analysis, Insights and Forecast - by Type
- 10.2.1. Combined Cycle
- 10.2.2. Open Cycle
- 10.3. Market Analysis, Insights and Forecast - by End-User Industry
- 10.3.1. Power
- 10.3.2. Oil and Gas
- 10.3.3. Other End-user Industries
- 10.1. Market Analysis, Insights and Forecast - by Capacity
- 11. North America Gas Turbine Services Market Analysis, Insights and Forecast, 2019-2031
- 11.1. Market Analysis, Insights and Forecast - By Country/Sub-region
- 11.1.1 United States
- 11.1.2 Canada
- 11.1.3 Mexico
- 12. Europe Gas Turbine Services Market Analysis, Insights and Forecast, 2019-2031
- 12.1. Market Analysis, Insights and Forecast - By Country/Sub-region
- 12.1.1 Germany
- 12.1.2 United Kingdom
- 12.1.3 France
- 12.1.4 Spain
- 12.1.5 Italy
- 12.1.6 Spain
- 12.1.7 Belgium
- 12.1.8 Netherland
- 12.1.9 Nordics
- 12.1.10 Rest of Europe
- 13. Asia Pacific Gas Turbine Services Market Analysis, Insights and Forecast, 2019-2031
- 13.1. Market Analysis, Insights and Forecast - By Country/Sub-region
- 13.1.1 China
- 13.1.2 Japan
- 13.1.3 India
- 13.1.4 South Korea
- 13.1.5 Southeast Asia
- 13.1.6 Australia
- 13.1.7 Indonesia
- 13.1.8 Phillipes
- 13.1.9 Singapore
- 13.1.10 Thailandc
- 13.1.11 Rest of Asia Pacific
- 14. South America Gas Turbine Services Market Analysis, Insights and Forecast, 2019-2031
- 14.1. Market Analysis, Insights and Forecast - By Country/Sub-region
- 14.1.1 Brazil
- 14.1.2 Argentina
- 14.1.3 Peru
- 14.1.4 Chile
- 14.1.5 Colombia
- 14.1.6 Ecuador
- 14.1.7 Venezuela
- 14.1.8 Rest of South America
- 15. North America Gas Turbine Services Market Analysis, Insights and Forecast, 2019-2031
- 15.1. Market Analysis, Insights and Forecast - By Country/Sub-region
- 15.1.1 United States
- 15.1.2 Canada
- 15.1.3 Mexico
- 16. MEA Gas Turbine Services Market Analysis, Insights and Forecast, 2019-2031
- 16.1. Market Analysis, Insights and Forecast - By Country/Sub-region
- 16.1.1 United Arab Emirates
- 16.1.2 Saudi Arabia
- 16.1.3 South Africa
- 16.1.4 Rest of Middle East and Africa
- 17. Competitive Analysis
- 17.1. Global Market Share Analysis 2024
- 17.2. Company Profiles
- 17.2.1 Solar Turbines Incorporated
- 17.2.1.1. Overview
- 17.2.1.2. Products
- 17.2.1.3. SWOT Analysis
- 17.2.1.4. Recent Developments
- 17.2.1.5. Financials (Based on Availability)
- 17.2.2 Ansaldo Energia SpA*List Not Exhaustive 6 4 *List Not Exhaustiv
- 17.2.2.1. Overview
- 17.2.2.2. Products
- 17.2.2.3. SWOT Analysis
- 17.2.2.4. Recent Developments
- 17.2.2.5. Financials (Based on Availability)
- 17.2.3 Bharat Heavy Electricals Limited
- 17.2.3.1. Overview
- 17.2.3.2. Products
- 17.2.3.3. SWOT Analysis
- 17.2.3.4. Recent Developments
- 17.2.3.5. Financials (Based on Availability)
- 17.2.4 Siemens AG
- 17.2.4.1. Overview
- 17.2.4.2. Products
- 17.2.4.3. SWOT Analysis
- 17.2.4.4. Recent Developments
- 17.2.4.5. Financials (Based on Availability)
- 17.2.5 Wartsila Oyj Abp
- 17.2.5.1. Overview
- 17.2.5.2. Products
- 17.2.5.3. SWOT Analysis
- 17.2.5.4. Recent Developments
- 17.2.5.5. Financials (Based on Availability)
- 17.2.6 General Electric Company
- 17.2.6.1. Overview
- 17.2.6.2. Products
- 17.2.6.3. SWOT Analysis
- 17.2.6.4. Recent Developments
- 17.2.6.5. Financials (Based on Availability)
- 17.2.7 Kawasaki Heavy Industries Ltd
- 17.2.7.1. Overview
- 17.2.7.2. Products
- 17.2.7.3. SWOT Analysis
- 17.2.7.4. Recent Developments
- 17.2.7.5. Financials (Based on Availability)
- 17.2.8 IHI Corporation
- 17.2.8.1. Overview
- 17.2.8.2. Products
- 17.2.8.3. SWOT Analysis
- 17.2.8.4. Recent Developments
- 17.2.8.5. Financials (Based on Availability)
- 17.2.9 Mitsubishi Heavy Industries Ltd
- 17.2.9.1. Overview
- 17.2.9.2. Products
- 17.2.9.3. SWOT Analysis
- 17.2.9.4. Recent Developments
- 17.2.9.5. Financials (Based on Availability)
- 17.2.1 Solar Turbines Incorporated
List of Figures
- Figure 1: Global Gas Turbine Services Market Revenue Breakdown (Million, %) by Region 2024 & 2032
- Figure 2: North America Gas Turbine Services Market Revenue (Million), by Country 2024 & 2032
- Figure 3: North America Gas Turbine Services Market Revenue Share (%), by Country 2024 & 2032
- Figure 4: Europe Gas Turbine Services Market Revenue (Million), by Country 2024 & 2032
- Figure 5: Europe Gas Turbine Services Market Revenue Share (%), by Country 2024 & 2032
- Figure 6: Asia Pacific Gas Turbine Services Market Revenue (Million), by Country 2024 & 2032
- Figure 7: Asia Pacific Gas Turbine Services Market Revenue Share (%), by Country 2024 & 2032
- Figure 8: South America Gas Turbine Services Market Revenue (Million), by Country 2024 & 2032
- Figure 9: South America Gas Turbine Services Market Revenue Share (%), by Country 2024 & 2032
- Figure 10: North America Gas Turbine Services Market Revenue (Million), by Country 2024 & 2032
- Figure 11: North America Gas Turbine Services Market Revenue Share (%), by Country 2024 & 2032
- Figure 12: MEA Gas Turbine Services Market Revenue (Million), by Country 2024 & 2032
- Figure 13: MEA Gas Turbine Services Market Revenue Share (%), by Country 2024 & 2032
- Figure 14: Asia Pacific Gas Turbine Services Market Revenue (Million), by Capacity 2024 & 2032
- Figure 15: Asia Pacific Gas Turbine Services Market Revenue Share (%), by Capacity 2024 & 2032
- Figure 16: Asia Pacific Gas Turbine Services Market Revenue (Million), by Type 2024 & 2032
- Figure 17: Asia Pacific Gas Turbine Services Market Revenue Share (%), by Type 2024 & 2032
- Figure 18: Asia Pacific Gas Turbine Services Market Revenue (Million), by End-User Industry 2024 & 2032
- Figure 19: Asia Pacific Gas Turbine Services Market Revenue Share (%), by End-User Industry 2024 & 2032
- Figure 20: Asia Pacific Gas Turbine Services Market Revenue (Million), by Country 2024 & 2032
- Figure 21: Asia Pacific Gas Turbine Services Market Revenue Share (%), by Country 2024 & 2032
- Figure 22: North America Gas Turbine Services Market Revenue (Million), by Capacity 2024 & 2032
- Figure 23: North America Gas Turbine Services Market Revenue Share (%), by Capacity 2024 & 2032
- Figure 24: North America Gas Turbine Services Market Revenue (Million), by Type 2024 & 2032
- Figure 25: North America Gas Turbine Services Market Revenue Share (%), by Type 2024 & 2032
- Figure 26: North America Gas Turbine Services Market Revenue (Million), by End-User Industry 2024 & 2032
- Figure 27: North America Gas Turbine Services Market Revenue Share (%), by End-User Industry 2024 & 2032
- Figure 28: North America Gas Turbine Services Market Revenue (Million), by Country 2024 & 2032
- Figure 29: North America Gas Turbine Services Market Revenue Share (%), by Country 2024 & 2032
- Figure 30: Europe Gas Turbine Services Market Revenue (Million), by Capacity 2024 & 2032
- Figure 31: Europe Gas Turbine Services Market Revenue Share (%), by Capacity 2024 & 2032
- Figure 32: Europe Gas Turbine Services Market Revenue (Million), by Type 2024 & 2032
- Figure 33: Europe Gas Turbine Services Market Revenue Share (%), by Type 2024 & 2032
- Figure 34: Europe Gas Turbine Services Market Revenue (Million), by End-User Industry 2024 & 2032
- Figure 35: Europe Gas Turbine Services Market Revenue Share (%), by End-User Industry 2024 & 2032
- Figure 36: Europe Gas Turbine Services Market Revenue (Million), by Country 2024 & 2032
- Figure 37: Europe Gas Turbine Services Market Revenue Share (%), by Country 2024 & 2032
- Figure 38: South America Gas Turbine Services Market Revenue (Million), by Capacity 2024 & 2032
- Figure 39: South America Gas Turbine Services Market Revenue Share (%), by Capacity 2024 & 2032
- Figure 40: South America Gas Turbine Services Market Revenue (Million), by Type 2024 & 2032
- Figure 41: South America Gas Turbine Services Market Revenue Share (%), by Type 2024 & 2032
- Figure 42: South America Gas Turbine Services Market Revenue (Million), by End-User Industry 2024 & 2032
- Figure 43: South America Gas Turbine Services Market Revenue Share (%), by End-User Industry 2024 & 2032
- Figure 44: South America Gas Turbine Services Market Revenue (Million), by Country 2024 & 2032
- Figure 45: South America Gas Turbine Services Market Revenue Share (%), by Country 2024 & 2032
- Figure 46: Middle East and Africa Gas Turbine Services Market Revenue (Million), by Capacity 2024 & 2032
- Figure 47: Middle East and Africa Gas Turbine Services Market Revenue Share (%), by Capacity 2024 & 2032
- Figure 48: Middle East and Africa Gas Turbine Services Market Revenue (Million), by Type 2024 & 2032
- Figure 49: Middle East and Africa Gas Turbine Services Market Revenue Share (%), by Type 2024 & 2032
- Figure 50: Middle East and Africa Gas Turbine Services Market Revenue (Million), by End-User Industry 2024 & 2032
- Figure 51: Middle East and Africa Gas Turbine Services Market Revenue Share (%), by End-User Industry 2024 & 2032
- Figure 52: Middle East and Africa Gas Turbine Services Market Revenue (Million), by Country 2024 & 2032
- Figure 53: Middle East and Africa Gas Turbine Services Market Revenue Share (%), by Country 2024 & 2032
List of Tables
- Table 1: Global Gas Turbine Services Market Revenue Million Forecast, by Region 2019 & 2032
- Table 2: Global Gas Turbine Services Market Revenue Million Forecast, by Capacity 2019 & 2032
- Table 3: Global Gas Turbine Services Market Revenue Million Forecast, by Type 2019 & 2032
- Table 4: Global Gas Turbine Services Market Revenue Million Forecast, by End-User Industry 2019 & 2032
- Table 5: Global Gas Turbine Services Market Revenue Million Forecast, by Region 2019 & 2032
- Table 6: Global Gas Turbine Services Market Revenue Million Forecast, by Country 2019 & 2032
- Table 7: United States Gas Turbine Services Market Revenue (Million) Forecast, by Application 2019 & 2032
- Table 8: Canada Gas Turbine Services Market Revenue (Million) Forecast, by Application 2019 & 2032
- Table 9: Mexico Gas Turbine Services Market Revenue (Million) Forecast, by Application 2019 & 2032
- Table 10: Global Gas Turbine Services Market Revenue Million Forecast, by Country 2019 & 2032
- Table 11: Germany Gas Turbine Services Market Revenue (Million) Forecast, by Application 2019 & 2032
- Table 12: United Kingdom Gas Turbine Services Market Revenue (Million) Forecast, by Application 2019 & 2032
- Table 13: France Gas Turbine Services Market Revenue (Million) Forecast, by Application 2019 & 2032
- Table 14: Spain Gas Turbine Services Market Revenue (Million) Forecast, by Application 2019 & 2032
- Table 15: Italy Gas Turbine Services Market Revenue (Million) Forecast, by Application 2019 & 2032
- Table 16: Spain Gas Turbine Services Market Revenue (Million) Forecast, by Application 2019 & 2032
- Table 17: Belgium Gas Turbine Services Market Revenue (Million) Forecast, by Application 2019 & 2032
- Table 18: Netherland Gas Turbine Services Market Revenue (Million) Forecast, by Application 2019 & 2032
- Table 19: Nordics Gas Turbine Services Market Revenue (Million) Forecast, by Application 2019 & 2032
- Table 20: Rest of Europe Gas Turbine Services Market Revenue (Million) Forecast, by Application 2019 & 2032
- Table 21: Global Gas Turbine Services Market Revenue Million Forecast, by Country 2019 & 2032
- Table 22: China Gas Turbine Services Market Revenue (Million) Forecast, by Application 2019 & 2032
- Table 23: Japan Gas Turbine Services Market Revenue (Million) Forecast, by Application 2019 & 2032
- Table 24: India Gas Turbine Services Market Revenue (Million) Forecast, by Application 2019 & 2032
- Table 25: South Korea Gas Turbine Services Market Revenue (Million) Forecast, by Application 2019 & 2032
- Table 26: Southeast Asia Gas Turbine Services Market Revenue (Million) Forecast, by Application 2019 & 2032
- Table 27: Australia Gas Turbine Services Market Revenue (Million) Forecast, by Application 2019 & 2032
- Table 28: Indonesia Gas Turbine Services Market Revenue (Million) Forecast, by Application 2019 & 2032
- Table 29: Phillipes Gas Turbine Services Market Revenue (Million) Forecast, by Application 2019 & 2032
- Table 30: Singapore Gas Turbine Services Market Revenue (Million) Forecast, by Application 2019 & 2032
- Table 31: Thailandc Gas Turbine Services Market Revenue (Million) Forecast, by Application 2019 & 2032
- Table 32: Rest of Asia Pacific Gas Turbine Services Market Revenue (Million) Forecast, by Application 2019 & 2032
- Table 33: Global Gas Turbine Services Market Revenue Million Forecast, by Country 2019 & 2032
- Table 34: Brazil Gas Turbine Services Market Revenue (Million) Forecast, by Application 2019 & 2032
- Table 35: Argentina Gas Turbine Services Market Revenue (Million) Forecast, by Application 2019 & 2032
- Table 36: Peru Gas Turbine Services Market Revenue (Million) Forecast, by Application 2019 & 2032
- Table 37: Chile Gas Turbine Services Market Revenue (Million) Forecast, by Application 2019 & 2032
- Table 38: Colombia Gas Turbine Services Market Revenue (Million) Forecast, by Application 2019 & 2032
- Table 39: Ecuador Gas Turbine Services Market Revenue (Million) Forecast, by Application 2019 & 2032
- Table 40: Venezuela Gas Turbine Services Market Revenue (Million) Forecast, by Application 2019 & 2032
- Table 41: Rest of South America Gas Turbine Services Market Revenue (Million) Forecast, by Application 2019 & 2032
- Table 42: Global Gas Turbine Services Market Revenue Million Forecast, by Country 2019 & 2032
- Table 43: United States Gas Turbine Services Market Revenue (Million) Forecast, by Application 2019 & 2032
- Table 44: Canada Gas Turbine Services Market Revenue (Million) Forecast, by Application 2019 & 2032
- Table 45: Mexico Gas Turbine Services Market Revenue (Million) Forecast, by Application 2019 & 2032
- Table 46: Global Gas Turbine Services Market Revenue Million Forecast, by Country 2019 & 2032
- Table 47: United Arab Emirates Gas Turbine Services Market Revenue (Million) Forecast, by Application 2019 & 2032
- Table 48: Saudi Arabia Gas Turbine Services Market Revenue (Million) Forecast, by Application 2019 & 2032
- Table 49: South Africa Gas Turbine Services Market Revenue (Million) Forecast, by Application 2019 & 2032
- Table 50: Rest of Middle East and Africa Gas Turbine Services Market Revenue (Million) Forecast, by Application 2019 & 2032
- Table 51: Global Gas Turbine Services Market Revenue Million Forecast, by Capacity 2019 & 2032
- Table 52: Global Gas Turbine Services Market Revenue Million Forecast, by Type 2019 & 2032
- Table 53: Global Gas Turbine Services Market Revenue Million Forecast, by End-User Industry 2019 & 2032
- Table 54: Global Gas Turbine Services Market Revenue Million Forecast, by Country 2019 & 2032
- Table 55: Global Gas Turbine Services Market Revenue Million Forecast, by Capacity 2019 & 2032
- Table 56: Global Gas Turbine Services Market Revenue Million Forecast, by Type 2019 & 2032
- Table 57: Global Gas Turbine Services Market Revenue Million Forecast, by End-User Industry 2019 & 2032
- Table 58: Global Gas Turbine Services Market Revenue Million Forecast, by Country 2019 & 2032
- Table 59: Global Gas Turbine Services Market Revenue Million Forecast, by Capacity 2019 & 2032
- Table 60: Global Gas Turbine Services Market Revenue Million Forecast, by Type 2019 & 2032
- Table 61: Global Gas Turbine Services Market Revenue Million Forecast, by End-User Industry 2019 & 2032
- Table 62: Global Gas Turbine Services Market Revenue Million Forecast, by Country 2019 & 2032
- Table 63: Global Gas Turbine Services Market Revenue Million Forecast, by Capacity 2019 & 2032
- Table 64: Global Gas Turbine Services Market Revenue Million Forecast, by Type 2019 & 2032
- Table 65: Global Gas Turbine Services Market Revenue Million Forecast, by End-User Industry 2019 & 2032
- Table 66: Global Gas Turbine Services Market Revenue Million Forecast, by Country 2019 & 2032
- Table 67: Global Gas Turbine Services Market Revenue Million Forecast, by Capacity 2019 & 2032
- Table 68: Global Gas Turbine Services Market Revenue Million Forecast, by Type 2019 & 2032
- Table 69: Global Gas Turbine Services Market Revenue Million Forecast, by End-User Industry 2019 & 2032
- Table 70: Global Gas Turbine Services Market Revenue Million Forecast, by Country 2019 & 2032
Frequently Asked Questions
1. What is the projected Compound Annual Growth Rate (CAGR) of the Gas Turbine Services Market?
The projected CAGR is approximately > 4.00%.
2. Which companies are prominent players in the Gas Turbine Services Market?
Key companies in the market include Solar Turbines Incorporated, Ansaldo Energia SpA*List Not Exhaustive 6 4 *List Not Exhaustiv, Bharat Heavy Electricals Limited, Siemens AG, Wartsila Oyj Abp, General Electric Company, Kawasaki Heavy Industries Ltd, IHI Corporation, Mitsubishi Heavy Industries Ltd.
3. What are the main segments of the Gas Turbine Services Market?
The market segments include Capacity, Type, End-User Industry.
4. Can you provide details about the market size?
The market size is estimated to be USD XX Million as of 2022.
5. What are some drivers contributing to market growth?
4.; Rising Power Demand4.; Substantial Investments And Efforts To Modernize The T&D Grid.
6. What are the notable trends driving market growth?
Power Sector is Expected to Dominate the Market.
7. Are there any restraints impacting market growth?
4.; Rising Distributed Energy Generation.
8. Can you provide examples of recent developments in the market?
N/A
9. What pricing options are available for accessing the report?
Pricing options include single-user, multi-user, and enterprise licenses priced at USD 4750, USD 5250, and USD 8750 respectively.
10. Is the market size provided in terms of value or volume?
The market size is provided in terms of value, measured in Million.
11. Are there any specific market keywords associated with the report?
Yes, the market keyword associated with the report is "Gas Turbine Services Market," which aids in identifying and referencing the specific market segment covered.
12. How do I determine which pricing option suits my needs best?
The pricing options vary based on user requirements and access needs. Individual users may opt for single-user licenses, while businesses requiring broader access may choose multi-user or enterprise licenses for cost-effective access to the report.
13. Are there any additional resources or data provided in the Gas Turbine Services Market report?
While the report offers comprehensive insights, it's advisable to review the specific contents or supplementary materials provided to ascertain if additional resources or data are available.
14. How can I stay updated on further developments or reports in the Gas Turbine Services Market?
To stay informed about further developments, trends, and reports in the Gas Turbine Services Market, consider subscribing to industry newsletters, following relevant companies and organizations, or regularly checking reputable industry news sources and publications.
Methodology
Step 1 - Identification of Relevant Samples Size from Population Database


Step 2 - Approaches for Defining Global Market Size (Value, Volume* & Price*)

Note*: In applicable scenarios
Step 3 - Data Sources
Primary Research
- Web Analytics
- Survey Reports
- Research Institute
- Latest Research Reports
- Opinion Leaders
Secondary Research
- Annual Reports
- White Paper
- Latest Press Release
- Industry Association
- Paid Database
- Investor Presentations

Step 4 - Data Triangulation
Involves using different sources of information in order to increase the validity of a study
These sources are likely to be stakeholders in a program - participants, other researchers, program staff, other community members, and so on.
Then we put all data in single framework & apply various statistical tools to find out the dynamic on the market.
During the analysis stage, feedback from the stakeholder groups would be compared to determine areas of agreement as well as areas of divergence
