

Key Insights
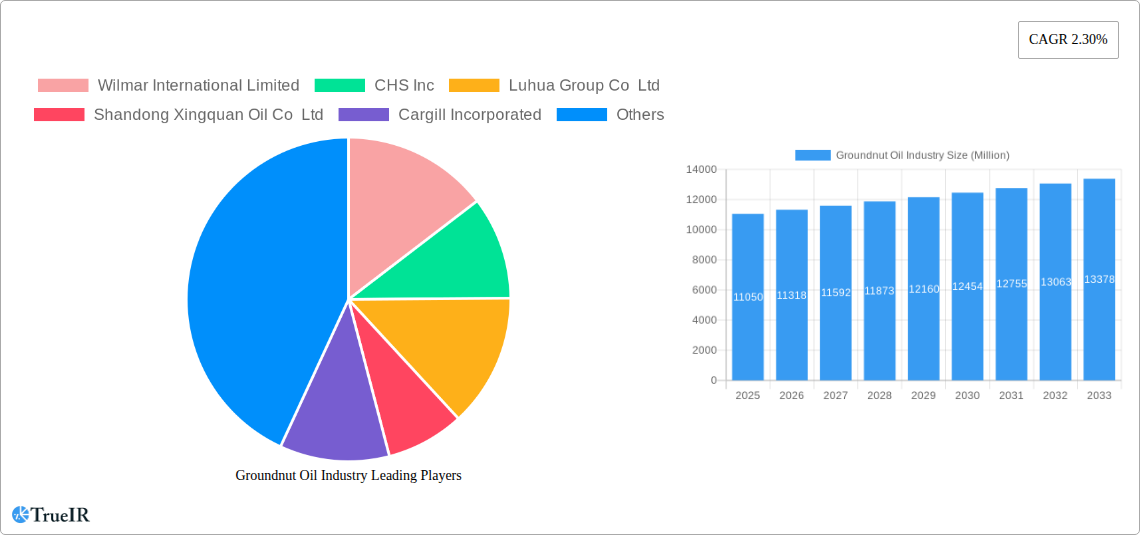
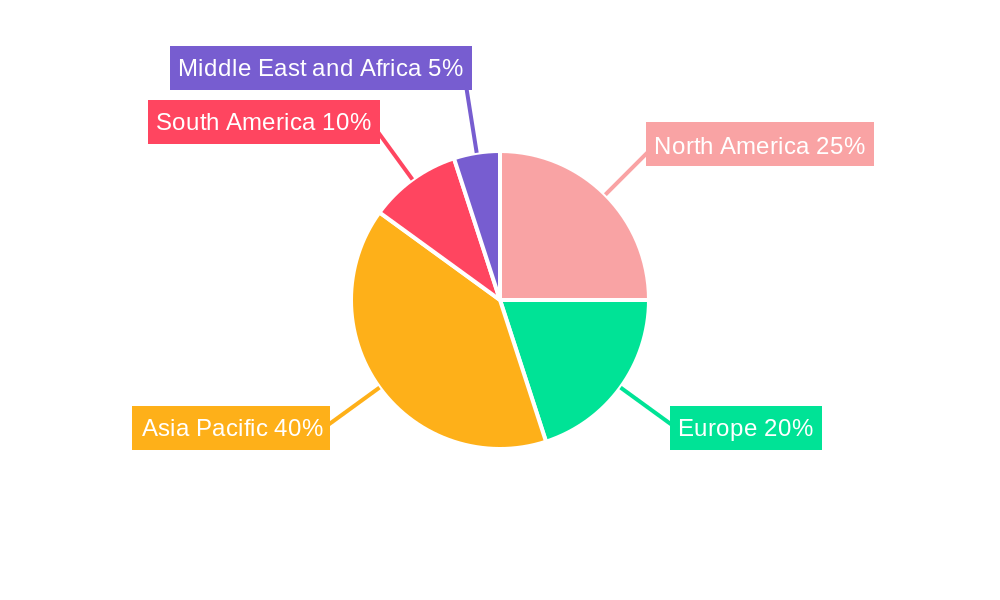
The global groundnut oil market, valued at $11.05 billion in 2025, is projected to exhibit a Compound Annual Growth Rate (CAGR) of 2.30% from 2025 to 2033. This moderate growth reflects a complex interplay of factors. The rising demand for groundnut oil in food applications, particularly in regions with established culinary traditions like Asia and Africa, is a significant driver. Its nutritional benefits, including high levels of monounsaturated fats and vitamin E, are also contributing to its popularity among health-conscious consumers. Growth within the personal care segment is also anticipated due to its use in cosmetics and skincare products. However, fluctuations in groundnut production due to climate change and pest infestations pose a significant restraint, potentially impacting supply and price stability. Competition from other vegetable oils, along with concerns about aflatoxin contamination in some regions, further moderate market expansion. The refined groundnut oil segment currently holds a larger market share than unrefined, driven by consumer preference for a more refined taste and longer shelf life. Major players like Wilmar International, Cargill, and Bunge are strategically investing in sustainable sourcing and processing technologies to enhance their market position. Geographic distribution shows strong growth potential in Asia-Pacific, particularly in India and China, fueled by increasing population and rising disposable incomes. North America and Europe, while exhibiting steady growth, show more moderate expansion due to existing market saturation and competition from other oils.
The market segmentation reveals a dynamic landscape. The refined groundnut oil segment is projected to maintain its dominance due to consumer preference for convenience and extended shelf life. Within applications, the food sector remains the largest consumer, driven by its use in cooking and as a culinary ingredient. However, the pharmaceutical and personal care segments are poised for growth due to increasing demand for natural ingredients in health and beauty products. Regional market analysis highlights the Asia-Pacific region as a key growth driver, followed by North America and Europe. While challenges related to production and competition exist, strategic investments in sustainable practices, coupled with the rising awareness of groundnut oil's health benefits, will likely support market growth in the forecast period. The unrefined segment offers opportunities for growth through targeting niche markets emphasizing authenticity and natural attributes.
Groundnut Oil Industry Market Report: 2019-2033
This comprehensive report provides a detailed analysis of the global groundnut oil industry, offering invaluable insights into market dynamics, competitive landscapes, and future growth prospects. With a study period spanning 2019-2033, a base year of 2025, and a forecast period of 2025-2033, this report is an essential resource for industry stakeholders seeking to understand the current state and future trajectory of this dynamic market. The report leverages extensive data analysis to provide a 360° view of the groundnut oil market, encompassing market size projections, segment-specific analysis, and in-depth competitive profiling. The report is vital for investors, manufacturers, suppliers, and anyone seeking to navigate the complexities of the groundnut oil market. The global market size was valued at $XX Million in 2024 and is projected to reach $XX Million by 2033, exhibiting a CAGR of xx% during the forecast period.
Groundnut Oil Industry Market Structure & Competitive Landscape
The global groundnut oil market exhibits a moderately concentrated structure, with several large multinational corporations commanding significant market shares. Concentration ratios, such as the CR4 (combined market share of the top four players), are estimated to be around xx% in 2025, indicating a competitive but not overly fragmented landscape. Key players, including Wilmar International Limited, Cargill Incorporated, Bunge Ltd, and Archer Daniels Midland Company, drive innovation through product diversification, supply chain optimization, and strategic partnerships. Regulatory changes, particularly those related to food safety and labeling, significantly impact market dynamics. The industry also faces pressure from substitute products like soybean oil and sunflower oil, prompting continuous innovation in product quality and marketing strategies. End-user segmentation, driven primarily by the food industry, influences market demand. Mergers and acquisitions (M&A) activity within the industry has been relatively stable in recent years, with an estimated annual M&A volume of xx deals in the historical period, contributing to market consolidation.
- Market Concentration: CR4 estimated at xx% in 2025.
- Innovation Drivers: Product diversification, sustainable sourcing, technological advancements.
- Regulatory Impacts: Food safety regulations, labeling requirements, trade policies.
- Product Substitutes: Soybean oil, sunflower oil, palm oil.
- End-User Segmentation: Food (largest segment), Personal Care, Pharmaceuticals, Other Applications.
- M&A Trends: xx deals annually (2019-2024), leading to market consolidation.
Groundnut Oil Industry Market Trends & Opportunities
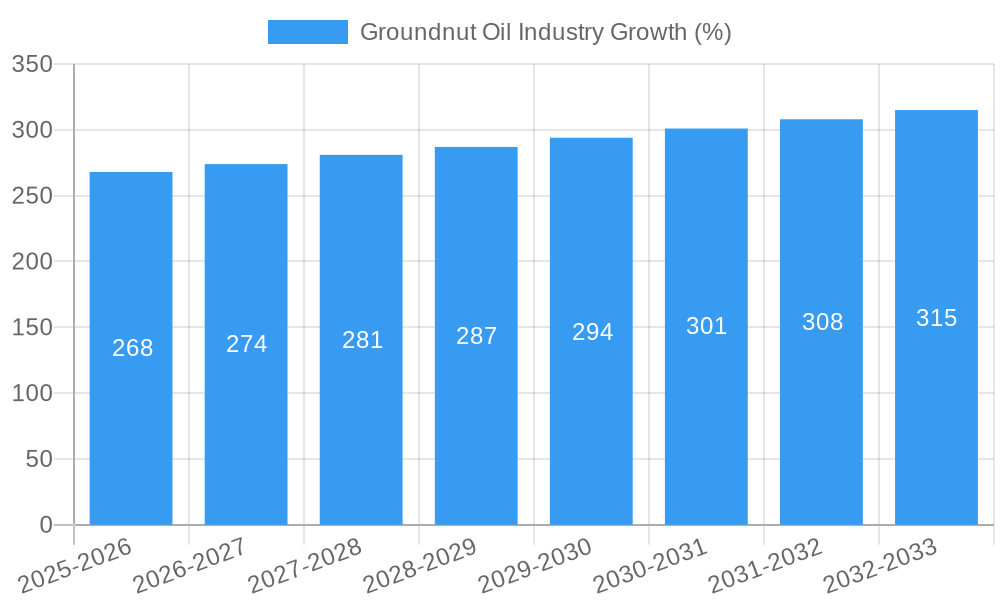
The groundnut oil market is experiencing steady growth, driven by increasing consumer demand for healthier cooking oils and the expanding use of groundnut oil in various applications. The global market is estimated to reach $XX Million by 2033, representing a substantial increase compared to the $XX Million recorded in 2024. This growth is fueled by several factors, including changing consumer preferences towards healthier cooking options, rising disposable incomes in developing economies, and expanding applications in personal care and pharmaceuticals. Technological advancements in oil extraction and refining are further improving efficiency and product quality. The market also benefits from the rising popularity of groundnut-based products, leading to increased demand for the oil. Competitive dynamics are intense, with major players investing in branding, distribution networks, and product innovation to maintain market share. This dynamic interplay of consumer trends, technological advancements, and competitive strategies shapes the overall trajectory of the market. The CAGR during the forecast period is expected to be xx%. Market penetration rates vary significantly across regions, with higher penetration in established markets and potential for significant growth in emerging economies.
Dominant Markets & Segments in Groundnut Oil Industry
The Asia-Pacific region currently dominates the global groundnut oil market, driven by high consumption levels in countries like India and China. Within the product segments, refined groundnut oil holds the largest market share, due to its higher purity and extended shelf life. The food industry remains the dominant end-use segment, with personal care and pharmaceuticals witnessing promising growth.
Key Growth Drivers:
- Asia-Pacific Region: High consumption in India and China, growing population.
- Refined Groundnut Oil: Higher purity, extended shelf life, consumer preference.
- Food Industry: Extensive use in cooking, baking, and food processing.
- Emerging Economies: Rising disposable incomes, increasing demand for healthier cooking oils.
- Government Initiatives: Support for agriculture and food processing industries.
Groundnut Oil Industry Product Analysis
Groundnut oil product innovation focuses primarily on improving quality, enhancing shelf life, and exploring new applications. Advances in extraction and refining technologies have resulted in healthier and more refined products with improved oxidative stability. These innovations cater to the increasing consumer demand for high-quality, nutritious oils. The competitive advantage lies in offering premium, sustainably sourced products that meet evolving consumer expectations and regulatory requirements.
Key Drivers, Barriers & Challenges in Groundnut Oil Industry
Key Drivers:
- Growing consumer preference for healthy cooking oils.
- Increasing demand from the food processing industry.
- Expansion of applications in personal care and pharmaceuticals.
- Technological advancements in oil extraction and refining.
Challenges & Restraints:
- Fluctuations in groundnut production due to weather conditions.
- Competition from other vegetable oils.
- Regulatory hurdles related to food safety and labeling.
- Supply chain disruptions impacting pricing and availability. These factors have resulted in a xx% price fluctuation in the past five years, impacting market stability.
Growth Drivers in the Groundnut Oil Industry Market
The groundnut oil market is driven by a confluence of factors. Increasing health consciousness fuels demand for healthier alternatives to other cooking oils. The expanding food processing industry necessitates large volumes of groundnut oil, while innovative applications in personal care and pharmaceuticals contribute to steady growth. Government support for agriculture and processing, particularly in developing countries, further stimulates market expansion.
Challenges Impacting Groundnut Oil Industry Growth
Significant challenges impede market growth. Fluctuations in groundnut yields due to climate change affect oil supply and pricing. Intense competition from other vegetable oils necessitates continuous innovation and marketing efforts. Stricter food safety regulations and complex supply chains impose additional costs and operational challenges.
Key Players Shaping the Groundnut Oil Industry Market
- Wilmar International Limited
- CHS Inc
- Luhua Group Co Ltd
- Shandong Xingquan Oil Co Ltd
- Cargill Incorporated
- Bunge Ltd
- Archer Daniels Midland Company
- Hain Celestial Group Inc
- Olam International
- Liberty Oil Mills Limited
- Lorenzati Group
Significant Groundnut Oil Industry Industry Milestones
- 2020: Increased focus on sustainable sourcing practices by several key players.
- 2021: Launch of new refined groundnut oil products with enhanced nutritional benefits.
- 2022: Significant investment in groundnut processing facilities in key growing regions.
- 2023: Growing adoption of technologically advanced oil extraction methods.
- 2024: Several mergers and acquisitions aimed at market consolidation.
Future Outlook for Groundnut Oil Industry Market
The future outlook for the groundnut oil industry remains positive, driven by continued growth in emerging markets and increasing consumer demand for healthier cooking oils. Strategic investments in sustainable sourcing, technological advancements, and product innovation are poised to further shape the market's trajectory. The industry's capacity to adapt to evolving consumer preferences and regulatory changes will be crucial for long-term success. The market is expected to witness steady growth, with particular opportunities in developing economies and expanding applications in diverse sectors.
Groundnut Oil Industry Segmentation
-
1. Type
- 1.1. Refined
- 1.2. Unrefined
-
2. Application
- 2.1. Personal Care
- 2.2. Food
- 2.3. Pharmaceuticals
- 2.4. Other Applications
Groundnut Oil Industry Segmentation By Geography
-
1. North America
- 1.1. United States
- 1.2. Canada
- 1.3. Mexico
- 1.4. Rest of North America
-
2. Europe
- 2.1. Spain
- 2.2. United Kingdom
- 2.3. Germany
- 2.4. France
- 2.5. Italy
- 2.6. Russia
- 2.7. Rest of Europe
-
3. Asia Pacific
- 3.1. China
- 3.2. Japan
- 3.3. India
- 3.4. Australia
- 3.5. Rest of Asia Pacific
-
4. South America
- 4.1. Brazil
- 4.2. Argentina
- 4.3. Rest of South America
-
5. Middle East and Africa
- 5.1. South Africa
- 5.2. Saudi Arabia
- 5.3. Rest of Middle East and Africa
Groundnut Oil Industry REPORT HIGHLIGHTS
| Aspects | Details |
|---|---|
| Study Period | 2019-2033 |
| Base Year | 2024 |
| Estimated Year | 2025 |
| Forecast Period | 2025-2033 |
| Historical Period | 2019-2024 |
| Growth Rate | CAGR of 2.30% from 2019-2033 |
| Segmentation |
|
Table of Contents
- 1. Introduction
- 1.1. Research Scope
- 1.2. Market Segmentation
- 1.3. Research Methodology
- 1.4. Definitions and Assumptions
- 2. Executive Summary
- 2.1. Introduction
- 3. Market Dynamics
- 3.1. Introduction
- 3.2. Market Drivers
- 3.2.1. Inclination Towards Fitness and Increasing Intake of Plant-based Protein; Increase in Consumer Inclination Towards Meat Substitutes
- 3.3. Market Restrains
- 3.3.1. Gluten-Intolerance Among the Population Hindering the Market
- 3.4. Market Trends
- 3.4.1. Increasing Awareness of Peanut Oil Benefits in Skincare Products
- 4. Market Factor Analysis
- 4.1. Porters Five Forces
- 4.2. Supply/Value Chain
- 4.3. PESTEL analysis
- 4.4. Market Entropy
- 4.5. Patent/Trademark Analysis
- 5. Global Groundnut Oil Industry Analysis, Insights and Forecast, 2019-2031
- 5.1. Market Analysis, Insights and Forecast - by Type
- 5.1.1. Refined
- 5.1.2. Unrefined
- 5.2. Market Analysis, Insights and Forecast - by Application
- 5.2.1. Personal Care
- 5.2.2. Food
- 5.2.3. Pharmaceuticals
- 5.2.4. Other Applications
- 5.3. Market Analysis, Insights and Forecast - by Region
- 5.3.1. North America
- 5.3.2. Europe
- 5.3.3. Asia Pacific
- 5.3.4. South America
- 5.3.5. Middle East and Africa
- 5.1. Market Analysis, Insights and Forecast - by Type
- 6. North America Groundnut Oil Industry Analysis, Insights and Forecast, 2019-2031
- 6.1. Market Analysis, Insights and Forecast - by Type
- 6.1.1. Refined
- 6.1.2. Unrefined
- 6.2. Market Analysis, Insights and Forecast - by Application
- 6.2.1. Personal Care
- 6.2.2. Food
- 6.2.3. Pharmaceuticals
- 6.2.4. Other Applications
- 6.1. Market Analysis, Insights and Forecast - by Type
- 7. Europe Groundnut Oil Industry Analysis, Insights and Forecast, 2019-2031
- 7.1. Market Analysis, Insights and Forecast - by Type
- 7.1.1. Refined
- 7.1.2. Unrefined
- 7.2. Market Analysis, Insights and Forecast - by Application
- 7.2.1. Personal Care
- 7.2.2. Food
- 7.2.3. Pharmaceuticals
- 7.2.4. Other Applications
- 7.1. Market Analysis, Insights and Forecast - by Type
- 8. Asia Pacific Groundnut Oil Industry Analysis, Insights and Forecast, 2019-2031
- 8.1. Market Analysis, Insights and Forecast - by Type
- 8.1.1. Refined
- 8.1.2. Unrefined
- 8.2. Market Analysis, Insights and Forecast - by Application
- 8.2.1. Personal Care
- 8.2.2. Food
- 8.2.3. Pharmaceuticals
- 8.2.4. Other Applications
- 8.1. Market Analysis, Insights and Forecast - by Type
- 9. South America Groundnut Oil Industry Analysis, Insights and Forecast, 2019-2031
- 9.1. Market Analysis, Insights and Forecast - by Type
- 9.1.1. Refined
- 9.1.2. Unrefined
- 9.2. Market Analysis, Insights and Forecast - by Application
- 9.2.1. Personal Care
- 9.2.2. Food
- 9.2.3. Pharmaceuticals
- 9.2.4. Other Applications
- 9.1. Market Analysis, Insights and Forecast - by Type
- 10. Middle East and Africa Groundnut Oil Industry Analysis, Insights and Forecast, 2019-2031
- 10.1. Market Analysis, Insights and Forecast - by Type
- 10.1.1. Refined
- 10.1.2. Unrefined
- 10.2. Market Analysis, Insights and Forecast - by Application
- 10.2.1. Personal Care
- 10.2.2. Food
- 10.2.3. Pharmaceuticals
- 10.2.4. Other Applications
- 10.1. Market Analysis, Insights and Forecast - by Type
- 11. North America Groundnut Oil Industry Analysis, Insights and Forecast, 2019-2031
- 11.1. Market Analysis, Insights and Forecast - By Country/Sub-region
- 11.1.1 United States
- 11.1.2 Canada
- 11.1.3 Mexico
- 11.1.4 Rest of North America
- 12. Europe Groundnut Oil Industry Analysis, Insights and Forecast, 2019-2031
- 12.1. Market Analysis, Insights and Forecast - By Country/Sub-region
- 12.1.1 Spain
- 12.1.2 United Kingdom
- 12.1.3 Germany
- 12.1.4 France
- 12.1.5 Italy
- 12.1.6 Russia
- 12.1.7 Rest of Europe
- 13. Asia Pacific Groundnut Oil Industry Analysis, Insights and Forecast, 2019-2031
- 13.1. Market Analysis, Insights and Forecast - By Country/Sub-region
- 13.1.1 China
- 13.1.2 Japan
- 13.1.3 India
- 13.1.4 Australia
- 13.1.5 Rest of Asia Pacific
- 14. South America Groundnut Oil Industry Analysis, Insights and Forecast, 2019-2031
- 14.1. Market Analysis, Insights and Forecast - By Country/Sub-region
- 14.1.1 Brazil
- 14.1.2 Argentina
- 14.1.3 Rest of South America
- 15. Middle East and Africa Groundnut Oil Industry Analysis, Insights and Forecast, 2019-2031
- 15.1. Market Analysis, Insights and Forecast - By Country/Sub-region
- 15.1.1 South Africa
- 15.1.2 Saudi Arabia
- 15.1.3 Rest of Middle East and Africa
- 16. Competitive Analysis
- 16.1. Global Market Share Analysis 2024
- 16.2. Company Profiles
- 16.2.1 Wilmar International Limited
- 16.2.1.1. Overview
- 16.2.1.2. Products
- 16.2.1.3. SWOT Analysis
- 16.2.1.4. Recent Developments
- 16.2.1.5. Financials (Based on Availability)
- 16.2.2 CHS Inc
- 16.2.2.1. Overview
- 16.2.2.2. Products
- 16.2.2.3. SWOT Analysis
- 16.2.2.4. Recent Developments
- 16.2.2.5. Financials (Based on Availability)
- 16.2.3 Luhua Group Co Ltd
- 16.2.3.1. Overview
- 16.2.3.2. Products
- 16.2.3.3. SWOT Analysis
- 16.2.3.4. Recent Developments
- 16.2.3.5. Financials (Based on Availability)
- 16.2.4 Shandong Xingquan Oil Co Ltd
- 16.2.4.1. Overview
- 16.2.4.2. Products
- 16.2.4.3. SWOT Analysis
- 16.2.4.4. Recent Developments
- 16.2.4.5. Financials (Based on Availability)
- 16.2.5 Cargill Incorporated
- 16.2.5.1. Overview
- 16.2.5.2. Products
- 16.2.5.3. SWOT Analysis
- 16.2.5.4. Recent Developments
- 16.2.5.5. Financials (Based on Availability)
- 16.2.6 Bunge Ltd
- 16.2.6.1. Overview
- 16.2.6.2. Products
- 16.2.6.3. SWOT Analysis
- 16.2.6.4. Recent Developments
- 16.2.6.5. Financials (Based on Availability)
- 16.2.7 Archer Daniels Midland Company
- 16.2.7.1. Overview
- 16.2.7.2. Products
- 16.2.7.3. SWOT Analysis
- 16.2.7.4. Recent Developments
- 16.2.7.5. Financials (Based on Availability)
- 16.2.8 Hain Celestial Group Inc
- 16.2.8.1. Overview
- 16.2.8.2. Products
- 16.2.8.3. SWOT Analysis
- 16.2.8.4. Recent Developments
- 16.2.8.5. Financials (Based on Availability)
- 16.2.9 Olam International
- 16.2.9.1. Overview
- 16.2.9.2. Products
- 16.2.9.3. SWOT Analysis
- 16.2.9.4. Recent Developments
- 16.2.9.5. Financials (Based on Availability)
- 16.2.10 Liberty Oil Mills Limited
- 16.2.10.1. Overview
- 16.2.10.2. Products
- 16.2.10.3. SWOT Analysis
- 16.2.10.4. Recent Developments
- 16.2.10.5. Financials (Based on Availability)
- 16.2.11 Lorenzati Group*List Not Exhaustive
- 16.2.11.1. Overview
- 16.2.11.2. Products
- 16.2.11.3. SWOT Analysis
- 16.2.11.4. Recent Developments
- 16.2.11.5. Financials (Based on Availability)
- 16.2.1 Wilmar International Limited
List of Figures
- Figure 1: Global Groundnut Oil Industry Revenue Breakdown (Million, %) by Region 2024 & 2032
- Figure 2: Global Groundnut Oil Industry Volume Breakdown (K Tons, %) by Region 2024 & 2032
- Figure 3: North America Groundnut Oil Industry Revenue (Million), by Country 2024 & 2032
- Figure 4: North America Groundnut Oil Industry Volume (K Tons), by Country 2024 & 2032
- Figure 5: North America Groundnut Oil Industry Revenue Share (%), by Country 2024 & 2032
- Figure 6: North America Groundnut Oil Industry Volume Share (%), by Country 2024 & 2032
- Figure 7: Europe Groundnut Oil Industry Revenue (Million), by Country 2024 & 2032
- Figure 8: Europe Groundnut Oil Industry Volume (K Tons), by Country 2024 & 2032
- Figure 9: Europe Groundnut Oil Industry Revenue Share (%), by Country 2024 & 2032
- Figure 10: Europe Groundnut Oil Industry Volume Share (%), by Country 2024 & 2032
- Figure 11: Asia Pacific Groundnut Oil Industry Revenue (Million), by Country 2024 & 2032
- Figure 12: Asia Pacific Groundnut Oil Industry Volume (K Tons), by Country 2024 & 2032
- Figure 13: Asia Pacific Groundnut Oil Industry Revenue Share (%), by Country 2024 & 2032
- Figure 14: Asia Pacific Groundnut Oil Industry Volume Share (%), by Country 2024 & 2032
- Figure 15: South America Groundnut Oil Industry Revenue (Million), by Country 2024 & 2032
- Figure 16: South America Groundnut Oil Industry Volume (K Tons), by Country 2024 & 2032
- Figure 17: South America Groundnut Oil Industry Revenue Share (%), by Country 2024 & 2032
- Figure 18: South America Groundnut Oil Industry Volume Share (%), by Country 2024 & 2032
- Figure 19: Middle East and Africa Groundnut Oil Industry Revenue (Million), by Country 2024 & 2032
- Figure 20: Middle East and Africa Groundnut Oil Industry Volume (K Tons), by Country 2024 & 2032
- Figure 21: Middle East and Africa Groundnut Oil Industry Revenue Share (%), by Country 2024 & 2032
- Figure 22: Middle East and Africa Groundnut Oil Industry Volume Share (%), by Country 2024 & 2032
- Figure 23: North America Groundnut Oil Industry Revenue (Million), by Type 2024 & 2032
- Figure 24: North America Groundnut Oil Industry Volume (K Tons), by Type 2024 & 2032
- Figure 25: North America Groundnut Oil Industry Revenue Share (%), by Type 2024 & 2032
- Figure 26: North America Groundnut Oil Industry Volume Share (%), by Type 2024 & 2032
- Figure 27: North America Groundnut Oil Industry Revenue (Million), by Application 2024 & 2032
- Figure 28: North America Groundnut Oil Industry Volume (K Tons), by Application 2024 & 2032
- Figure 29: North America Groundnut Oil Industry Revenue Share (%), by Application 2024 & 2032
- Figure 30: North America Groundnut Oil Industry Volume Share (%), by Application 2024 & 2032
- Figure 31: North America Groundnut Oil Industry Revenue (Million), by Country 2024 & 2032
- Figure 32: North America Groundnut Oil Industry Volume (K Tons), by Country 2024 & 2032
- Figure 33: North America Groundnut Oil Industry Revenue Share (%), by Country 2024 & 2032
- Figure 34: North America Groundnut Oil Industry Volume Share (%), by Country 2024 & 2032
- Figure 35: Europe Groundnut Oil Industry Revenue (Million), by Type 2024 & 2032
- Figure 36: Europe Groundnut Oil Industry Volume (K Tons), by Type 2024 & 2032
- Figure 37: Europe Groundnut Oil Industry Revenue Share (%), by Type 2024 & 2032
- Figure 38: Europe Groundnut Oil Industry Volume Share (%), by Type 2024 & 2032
- Figure 39: Europe Groundnut Oil Industry Revenue (Million), by Application 2024 & 2032
- Figure 40: Europe Groundnut Oil Industry Volume (K Tons), by Application 2024 & 2032
- Figure 41: Europe Groundnut Oil Industry Revenue Share (%), by Application 2024 & 2032
- Figure 42: Europe Groundnut Oil Industry Volume Share (%), by Application 2024 & 2032
- Figure 43: Europe Groundnut Oil Industry Revenue (Million), by Country 2024 & 2032
- Figure 44: Europe Groundnut Oil Industry Volume (K Tons), by Country 2024 & 2032
- Figure 45: Europe Groundnut Oil Industry Revenue Share (%), by Country 2024 & 2032
- Figure 46: Europe Groundnut Oil Industry Volume Share (%), by Country 2024 & 2032
- Figure 47: Asia Pacific Groundnut Oil Industry Revenue (Million), by Type 2024 & 2032
- Figure 48: Asia Pacific Groundnut Oil Industry Volume (K Tons), by Type 2024 & 2032
- Figure 49: Asia Pacific Groundnut Oil Industry Revenue Share (%), by Type 2024 & 2032
- Figure 50: Asia Pacific Groundnut Oil Industry Volume Share (%), by Type 2024 & 2032
- Figure 51: Asia Pacific Groundnut Oil Industry Revenue (Million), by Application 2024 & 2032
- Figure 52: Asia Pacific Groundnut Oil Industry Volume (K Tons), by Application 2024 & 2032
- Figure 53: Asia Pacific Groundnut Oil Industry Revenue Share (%), by Application 2024 & 2032
- Figure 54: Asia Pacific Groundnut Oil Industry Volume Share (%), by Application 2024 & 2032
- Figure 55: Asia Pacific Groundnut Oil Industry Revenue (Million), by Country 2024 & 2032
- Figure 56: Asia Pacific Groundnut Oil Industry Volume (K Tons), by Country 2024 & 2032
- Figure 57: Asia Pacific Groundnut Oil Industry Revenue Share (%), by Country 2024 & 2032
- Figure 58: Asia Pacific Groundnut Oil Industry Volume Share (%), by Country 2024 & 2032
- Figure 59: South America Groundnut Oil Industry Revenue (Million), by Type 2024 & 2032
- Figure 60: South America Groundnut Oil Industry Volume (K Tons), by Type 2024 & 2032
- Figure 61: South America Groundnut Oil Industry Revenue Share (%), by Type 2024 & 2032
- Figure 62: South America Groundnut Oil Industry Volume Share (%), by Type 2024 & 2032
- Figure 63: South America Groundnut Oil Industry Revenue (Million), by Application 2024 & 2032
- Figure 64: South America Groundnut Oil Industry Volume (K Tons), by Application 2024 & 2032
- Figure 65: South America Groundnut Oil Industry Revenue Share (%), by Application 2024 & 2032
- Figure 66: South America Groundnut Oil Industry Volume Share (%), by Application 2024 & 2032
- Figure 67: South America Groundnut Oil Industry Revenue (Million), by Country 2024 & 2032
- Figure 68: South America Groundnut Oil Industry Volume (K Tons), by Country 2024 & 2032
- Figure 69: South America Groundnut Oil Industry Revenue Share (%), by Country 2024 & 2032
- Figure 70: South America Groundnut Oil Industry Volume Share (%), by Country 2024 & 2032
- Figure 71: Middle East and Africa Groundnut Oil Industry Revenue (Million), by Type 2024 & 2032
- Figure 72: Middle East and Africa Groundnut Oil Industry Volume (K Tons), by Type 2024 & 2032
- Figure 73: Middle East and Africa Groundnut Oil Industry Revenue Share (%), by Type 2024 & 2032
- Figure 74: Middle East and Africa Groundnut Oil Industry Volume Share (%), by Type 2024 & 2032
- Figure 75: Middle East and Africa Groundnut Oil Industry Revenue (Million), by Application 2024 & 2032
- Figure 76: Middle East and Africa Groundnut Oil Industry Volume (K Tons), by Application 2024 & 2032
- Figure 77: Middle East and Africa Groundnut Oil Industry Revenue Share (%), by Application 2024 & 2032
- Figure 78: Middle East and Africa Groundnut Oil Industry Volume Share (%), by Application 2024 & 2032
- Figure 79: Middle East and Africa Groundnut Oil Industry Revenue (Million), by Country 2024 & 2032
- Figure 80: Middle East and Africa Groundnut Oil Industry Volume (K Tons), by Country 2024 & 2032
- Figure 81: Middle East and Africa Groundnut Oil Industry Revenue Share (%), by Country 2024 & 2032
- Figure 82: Middle East and Africa Groundnut Oil Industry Volume Share (%), by Country 2024 & 2032
List of Tables
- Table 1: Global Groundnut Oil Industry Revenue Million Forecast, by Region 2019 & 2032
- Table 2: Global Groundnut Oil Industry Volume K Tons Forecast, by Region 2019 & 2032
- Table 3: Global Groundnut Oil Industry Revenue Million Forecast, by Type 2019 & 2032
- Table 4: Global Groundnut Oil Industry Volume K Tons Forecast, by Type 2019 & 2032
- Table 5: Global Groundnut Oil Industry Revenue Million Forecast, by Application 2019 & 2032
- Table 6: Global Groundnut Oil Industry Volume K Tons Forecast, by Application 2019 & 2032
- Table 7: Global Groundnut Oil Industry Revenue Million Forecast, by Region 2019 & 2032
- Table 8: Global Groundnut Oil Industry Volume K Tons Forecast, by Region 2019 & 2032
- Table 9: Global Groundnut Oil Industry Revenue Million Forecast, by Country 2019 & 2032
- Table 10: Global Groundnut Oil Industry Volume K Tons Forecast, by Country 2019 & 2032
- Table 11: United States Groundnut Oil Industry Revenue (Million) Forecast, by Application 2019 & 2032
- Table 12: United States Groundnut Oil Industry Volume (K Tons) Forecast, by Application 2019 & 2032
- Table 13: Canada Groundnut Oil Industry Revenue (Million) Forecast, by Application 2019 & 2032
- Table 14: Canada Groundnut Oil Industry Volume (K Tons) Forecast, by Application 2019 & 2032
- Table 15: Mexico Groundnut Oil Industry Revenue (Million) Forecast, by Application 2019 & 2032
- Table 16: Mexico Groundnut Oil Industry Volume (K Tons) Forecast, by Application 2019 & 2032
- Table 17: Rest of North America Groundnut Oil Industry Revenue (Million) Forecast, by Application 2019 & 2032
- Table 18: Rest of North America Groundnut Oil Industry Volume (K Tons) Forecast, by Application 2019 & 2032
- Table 19: Global Groundnut Oil Industry Revenue Million Forecast, by Country 2019 & 2032
- Table 20: Global Groundnut Oil Industry Volume K Tons Forecast, by Country 2019 & 2032
- Table 21: Spain Groundnut Oil Industry Revenue (Million) Forecast, by Application 2019 & 2032
- Table 22: Spain Groundnut Oil Industry Volume (K Tons) Forecast, by Application 2019 & 2032
- Table 23: United Kingdom Groundnut Oil Industry Revenue (Million) Forecast, by Application 2019 & 2032
- Table 24: United Kingdom Groundnut Oil Industry Volume (K Tons) Forecast, by Application 2019 & 2032
- Table 25: Germany Groundnut Oil Industry Revenue (Million) Forecast, by Application 2019 & 2032
- Table 26: Germany Groundnut Oil Industry Volume (K Tons) Forecast, by Application 2019 & 2032
- Table 27: France Groundnut Oil Industry Revenue (Million) Forecast, by Application 2019 & 2032
- Table 28: France Groundnut Oil Industry Volume (K Tons) Forecast, by Application 2019 & 2032
- Table 29: Italy Groundnut Oil Industry Revenue (Million) Forecast, by Application 2019 & 2032
- Table 30: Italy Groundnut Oil Industry Volume (K Tons) Forecast, by Application 2019 & 2032
- Table 31: Russia Groundnut Oil Industry Revenue (Million) Forecast, by Application 2019 & 2032
- Table 32: Russia Groundnut Oil Industry Volume (K Tons) Forecast, by Application 2019 & 2032
- Table 33: Rest of Europe Groundnut Oil Industry Revenue (Million) Forecast, by Application 2019 & 2032
- Table 34: Rest of Europe Groundnut Oil Industry Volume (K Tons) Forecast, by Application 2019 & 2032
- Table 35: Global Groundnut Oil Industry Revenue Million Forecast, by Country 2019 & 2032
- Table 36: Global Groundnut Oil Industry Volume K Tons Forecast, by Country 2019 & 2032
- Table 37: China Groundnut Oil Industry Revenue (Million) Forecast, by Application 2019 & 2032
- Table 38: China Groundnut Oil Industry Volume (K Tons) Forecast, by Application 2019 & 2032
- Table 39: Japan Groundnut Oil Industry Revenue (Million) Forecast, by Application 2019 & 2032
- Table 40: Japan Groundnut Oil Industry Volume (K Tons) Forecast, by Application 2019 & 2032
- Table 41: India Groundnut Oil Industry Revenue (Million) Forecast, by Application 2019 & 2032
- Table 42: India Groundnut Oil Industry Volume (K Tons) Forecast, by Application 2019 & 2032
- Table 43: Australia Groundnut Oil Industry Revenue (Million) Forecast, by Application 2019 & 2032
- Table 44: Australia Groundnut Oil Industry Volume (K Tons) Forecast, by Application 2019 & 2032
- Table 45: Rest of Asia Pacific Groundnut Oil Industry Revenue (Million) Forecast, by Application 2019 & 2032
- Table 46: Rest of Asia Pacific Groundnut Oil Industry Volume (K Tons) Forecast, by Application 2019 & 2032
- Table 47: Global Groundnut Oil Industry Revenue Million Forecast, by Country 2019 & 2032
- Table 48: Global Groundnut Oil Industry Volume K Tons Forecast, by Country 2019 & 2032
- Table 49: Brazil Groundnut Oil Industry Revenue (Million) Forecast, by Application 2019 & 2032
- Table 50: Brazil Groundnut Oil Industry Volume (K Tons) Forecast, by Application 2019 & 2032
- Table 51: Argentina Groundnut Oil Industry Revenue (Million) Forecast, by Application 2019 & 2032
- Table 52: Argentina Groundnut Oil Industry Volume (K Tons) Forecast, by Application 2019 & 2032
- Table 53: Rest of South America Groundnut Oil Industry Revenue (Million) Forecast, by Application 2019 & 2032
- Table 54: Rest of South America Groundnut Oil Industry Volume (K Tons) Forecast, by Application 2019 & 2032
- Table 55: Global Groundnut Oil Industry Revenue Million Forecast, by Country 2019 & 2032
- Table 56: Global Groundnut Oil Industry Volume K Tons Forecast, by Country 2019 & 2032
- Table 57: South Africa Groundnut Oil Industry Revenue (Million) Forecast, by Application 2019 & 2032
- Table 58: South Africa Groundnut Oil Industry Volume (K Tons) Forecast, by Application 2019 & 2032
- Table 59: Saudi Arabia Groundnut Oil Industry Revenue (Million) Forecast, by Application 2019 & 2032
- Table 60: Saudi Arabia Groundnut Oil Industry Volume (K Tons) Forecast, by Application 2019 & 2032
- Table 61: Rest of Middle East and Africa Groundnut Oil Industry Revenue (Million) Forecast, by Application 2019 & 2032
- Table 62: Rest of Middle East and Africa Groundnut Oil Industry Volume (K Tons) Forecast, by Application 2019 & 2032
- Table 63: Global Groundnut Oil Industry Revenue Million Forecast, by Type 2019 & 2032
- Table 64: Global Groundnut Oil Industry Volume K Tons Forecast, by Type 2019 & 2032
- Table 65: Global Groundnut Oil Industry Revenue Million Forecast, by Application 2019 & 2032
- Table 66: Global Groundnut Oil Industry Volume K Tons Forecast, by Application 2019 & 2032
- Table 67: Global Groundnut Oil Industry Revenue Million Forecast, by Country 2019 & 2032
- Table 68: Global Groundnut Oil Industry Volume K Tons Forecast, by Country 2019 & 2032
- Table 69: United States Groundnut Oil Industry Revenue (Million) Forecast, by Application 2019 & 2032
- Table 70: United States Groundnut Oil Industry Volume (K Tons) Forecast, by Application 2019 & 2032
- Table 71: Canada Groundnut Oil Industry Revenue (Million) Forecast, by Application 2019 & 2032
- Table 72: Canada Groundnut Oil Industry Volume (K Tons) Forecast, by Application 2019 & 2032
- Table 73: Mexico Groundnut Oil Industry Revenue (Million) Forecast, by Application 2019 & 2032
- Table 74: Mexico Groundnut Oil Industry Volume (K Tons) Forecast, by Application 2019 & 2032
- Table 75: Rest of North America Groundnut Oil Industry Revenue (Million) Forecast, by Application 2019 & 2032
- Table 76: Rest of North America Groundnut Oil Industry Volume (K Tons) Forecast, by Application 2019 & 2032
- Table 77: Global Groundnut Oil Industry Revenue Million Forecast, by Type 2019 & 2032
- Table 78: Global Groundnut Oil Industry Volume K Tons Forecast, by Type 2019 & 2032
- Table 79: Global Groundnut Oil Industry Revenue Million Forecast, by Application 2019 & 2032
- Table 80: Global Groundnut Oil Industry Volume K Tons Forecast, by Application 2019 & 2032
- Table 81: Global Groundnut Oil Industry Revenue Million Forecast, by Country 2019 & 2032
- Table 82: Global Groundnut Oil Industry Volume K Tons Forecast, by Country 2019 & 2032
- Table 83: Spain Groundnut Oil Industry Revenue (Million) Forecast, by Application 2019 & 2032
- Table 84: Spain Groundnut Oil Industry Volume (K Tons) Forecast, by Application 2019 & 2032
- Table 85: United Kingdom Groundnut Oil Industry Revenue (Million) Forecast, by Application 2019 & 2032
- Table 86: United Kingdom Groundnut Oil Industry Volume (K Tons) Forecast, by Application 2019 & 2032
- Table 87: Germany Groundnut Oil Industry Revenue (Million) Forecast, by Application 2019 & 2032
- Table 88: Germany Groundnut Oil Industry Volume (K Tons) Forecast, by Application 2019 & 2032
- Table 89: France Groundnut Oil Industry Revenue (Million) Forecast, by Application 2019 & 2032
- Table 90: France Groundnut Oil Industry Volume (K Tons) Forecast, by Application 2019 & 2032
- Table 91: Italy Groundnut Oil Industry Revenue (Million) Forecast, by Application 2019 & 2032
- Table 92: Italy Groundnut Oil Industry Volume (K Tons) Forecast, by Application 2019 & 2032
- Table 93: Russia Groundnut Oil Industry Revenue (Million) Forecast, by Application 2019 & 2032
- Table 94: Russia Groundnut Oil Industry Volume (K Tons) Forecast, by Application 2019 & 2032
- Table 95: Rest of Europe Groundnut Oil Industry Revenue (Million) Forecast, by Application 2019 & 2032
- Table 96: Rest of Europe Groundnut Oil Industry Volume (K Tons) Forecast, by Application 2019 & 2032
- Table 97: Global Groundnut Oil Industry Revenue Million Forecast, by Type 2019 & 2032
- Table 98: Global Groundnut Oil Industry Volume K Tons Forecast, by Type 2019 & 2032
- Table 99: Global Groundnut Oil Industry Revenue Million Forecast, by Application 2019 & 2032
- Table 100: Global Groundnut Oil Industry Volume K Tons Forecast, by Application 2019 & 2032
- Table 101: Global Groundnut Oil Industry Revenue Million Forecast, by Country 2019 & 2032
- Table 102: Global Groundnut Oil Industry Volume K Tons Forecast, by Country 2019 & 2032
- Table 103: China Groundnut Oil Industry Revenue (Million) Forecast, by Application 2019 & 2032
- Table 104: China Groundnut Oil Industry Volume (K Tons) Forecast, by Application 2019 & 2032
- Table 105: Japan Groundnut Oil Industry Revenue (Million) Forecast, by Application 2019 & 2032
- Table 106: Japan Groundnut Oil Industry Volume (K Tons) Forecast, by Application 2019 & 2032
- Table 107: India Groundnut Oil Industry Revenue (Million) Forecast, by Application 2019 & 2032
- Table 108: India Groundnut Oil Industry Volume (K Tons) Forecast, by Application 2019 & 2032
- Table 109: Australia Groundnut Oil Industry Revenue (Million) Forecast, by Application 2019 & 2032
- Table 110: Australia Groundnut Oil Industry Volume (K Tons) Forecast, by Application 2019 & 2032
- Table 111: Rest of Asia Pacific Groundnut Oil Industry Revenue (Million) Forecast, by Application 2019 & 2032
- Table 112: Rest of Asia Pacific Groundnut Oil Industry Volume (K Tons) Forecast, by Application 2019 & 2032
- Table 113: Global Groundnut Oil Industry Revenue Million Forecast, by Type 2019 & 2032
- Table 114: Global Groundnut Oil Industry Volume K Tons Forecast, by Type 2019 & 2032
- Table 115: Global Groundnut Oil Industry Revenue Million Forecast, by Application 2019 & 2032
- Table 116: Global Groundnut Oil Industry Volume K Tons Forecast, by Application 2019 & 2032
- Table 117: Global Groundnut Oil Industry Revenue Million Forecast, by Country 2019 & 2032
- Table 118: Global Groundnut Oil Industry Volume K Tons Forecast, by Country 2019 & 2032
- Table 119: Brazil Groundnut Oil Industry Revenue (Million) Forecast, by Application 2019 & 2032
- Table 120: Brazil Groundnut Oil Industry Volume (K Tons) Forecast, by Application 2019 & 2032
- Table 121: Argentina Groundnut Oil Industry Revenue (Million) Forecast, by Application 2019 & 2032
- Table 122: Argentina Groundnut Oil Industry Volume (K Tons) Forecast, by Application 2019 & 2032
- Table 123: Rest of South America Groundnut Oil Industry Revenue (Million) Forecast, by Application 2019 & 2032
- Table 124: Rest of South America Groundnut Oil Industry Volume (K Tons) Forecast, by Application 2019 & 2032
- Table 125: Global Groundnut Oil Industry Revenue Million Forecast, by Type 2019 & 2032
- Table 126: Global Groundnut Oil Industry Volume K Tons Forecast, by Type 2019 & 2032
- Table 127: Global Groundnut Oil Industry Revenue Million Forecast, by Application 2019 & 2032
- Table 128: Global Groundnut Oil Industry Volume K Tons Forecast, by Application 2019 & 2032
- Table 129: Global Groundnut Oil Industry Revenue Million Forecast, by Country 2019 & 2032
- Table 130: Global Groundnut Oil Industry Volume K Tons Forecast, by Country 2019 & 2032
- Table 131: South Africa Groundnut Oil Industry Revenue (Million) Forecast, by Application 2019 & 2032
- Table 132: South Africa Groundnut Oil Industry Volume (K Tons) Forecast, by Application 2019 & 2032
- Table 133: Saudi Arabia Groundnut Oil Industry Revenue (Million) Forecast, by Application 2019 & 2032
- Table 134: Saudi Arabia Groundnut Oil Industry Volume (K Tons) Forecast, by Application 2019 & 2032
- Table 135: Rest of Middle East and Africa Groundnut Oil Industry Revenue (Million) Forecast, by Application 2019 & 2032
- Table 136: Rest of Middle East and Africa Groundnut Oil Industry Volume (K Tons) Forecast, by Application 2019 & 2032
Frequently Asked Questions
1. What is the projected Compound Annual Growth Rate (CAGR) of the Groundnut Oil Industry?
The projected CAGR is approximately 2.30%.
2. Which companies are prominent players in the Groundnut Oil Industry?
Key companies in the market include Wilmar International Limited, CHS Inc, Luhua Group Co Ltd, Shandong Xingquan Oil Co Ltd, Cargill Incorporated, Bunge Ltd, Archer Daniels Midland Company, Hain Celestial Group Inc, Olam International, Liberty Oil Mills Limited, Lorenzati Group*List Not Exhaustive.
3. What are the main segments of the Groundnut Oil Industry?
The market segments include Type, Application.
4. Can you provide details about the market size?
The market size is estimated to be USD 11.05 Million as of 2022.
5. What are some drivers contributing to market growth?
Inclination Towards Fitness and Increasing Intake of Plant-based Protein; Increase in Consumer Inclination Towards Meat Substitutes.
6. What are the notable trends driving market growth?
Increasing Awareness of Peanut Oil Benefits in Skincare Products.
7. Are there any restraints impacting market growth?
Gluten-Intolerance Among the Population Hindering the Market.
8. Can you provide examples of recent developments in the market?
N/A
9. What pricing options are available for accessing the report?
Pricing options include single-user, multi-user, and enterprise licenses priced at USD 4750, USD 5250, and USD 8750 respectively.
10. Is the market size provided in terms of value or volume?
The market size is provided in terms of value, measured in Million and volume, measured in K Tons.
11. Are there any specific market keywords associated with the report?
Yes, the market keyword associated with the report is "Groundnut Oil Industry," which aids in identifying and referencing the specific market segment covered.
12. How do I determine which pricing option suits my needs best?
The pricing options vary based on user requirements and access needs. Individual users may opt for single-user licenses, while businesses requiring broader access may choose multi-user or enterprise licenses for cost-effective access to the report.
13. Are there any additional resources or data provided in the Groundnut Oil Industry report?
While the report offers comprehensive insights, it's advisable to review the specific contents or supplementary materials provided to ascertain if additional resources or data are available.
14. How can I stay updated on further developments or reports in the Groundnut Oil Industry?
To stay informed about further developments, trends, and reports in the Groundnut Oil Industry, consider subscribing to industry newsletters, following relevant companies and organizations, or regularly checking reputable industry news sources and publications.
Methodology
Step 1 - Identification of Relevant Samples Size from Population Database


Step 2 - Approaches for Defining Global Market Size (Value, Volume* & Price*)

Note*: In applicable scenarios
Step 3 - Data Sources
Primary Research
- Web Analytics
- Survey Reports
- Research Institute
- Latest Research Reports
- Opinion Leaders
Secondary Research
- Annual Reports
- White Paper
- Latest Press Release
- Industry Association
- Paid Database
- Investor Presentations

Step 4 - Data Triangulation
Involves using different sources of information in order to increase the validity of a study
These sources are likely to be stakeholders in a program - participants, other researchers, program staff, other community members, and so on.
Then we put all data in single framework & apply various statistical tools to find out the dynamic on the market.
During the analysis stage, feedback from the stakeholder groups would be compared to determine areas of agreement as well as areas of divergence
