

Key Insights
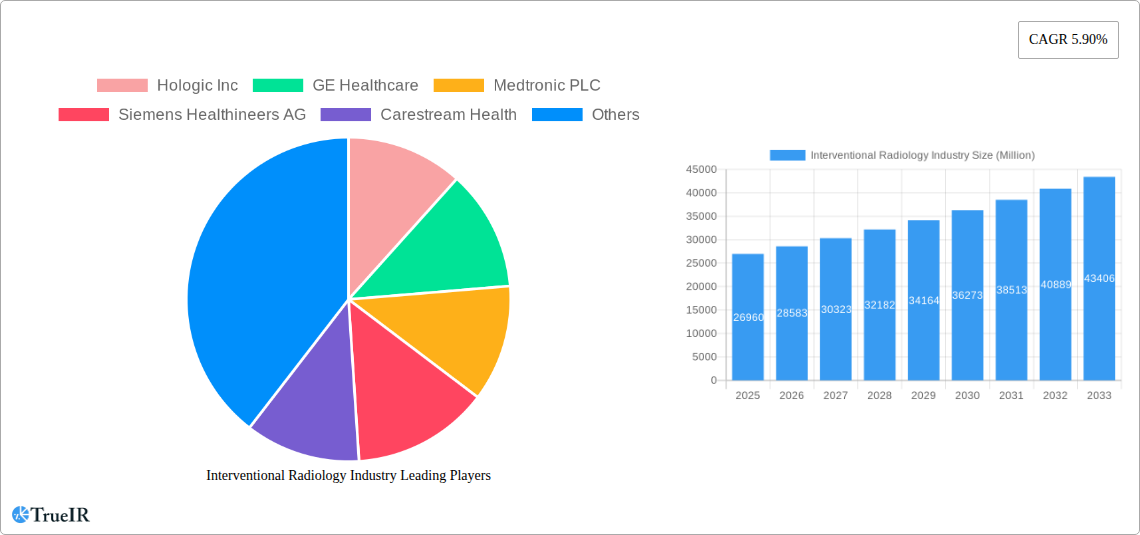
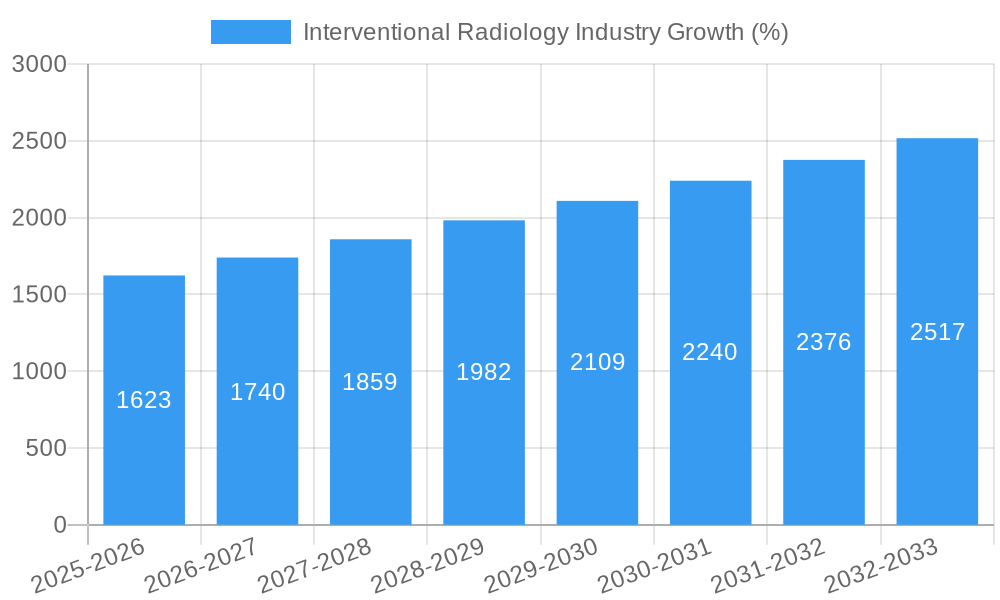
The Interventional Radiology market, valued at $26.96 billion in 2025, is projected to experience robust growth, driven by a compound annual growth rate (CAGR) of 5.90% from 2025 to 2033. This expansion is fueled by several key factors. Technological advancements in imaging systems like MRI, CT scanners, and ultrasound, coupled with minimally invasive procedures, are significantly improving diagnostic accuracy and treatment efficacy. The rising prevalence of chronic diseases such as cardiovascular ailments, cancer, and neurological disorders is further boosting demand for interventional radiology services. Growth is also spurred by the increasing adoption of advanced image-guided therapy techniques, enabling more precise and effective interventions. Furthermore, the aging global population necessitates more sophisticated and less invasive treatment options, leading to higher adoption rates of interventional radiology procedures.
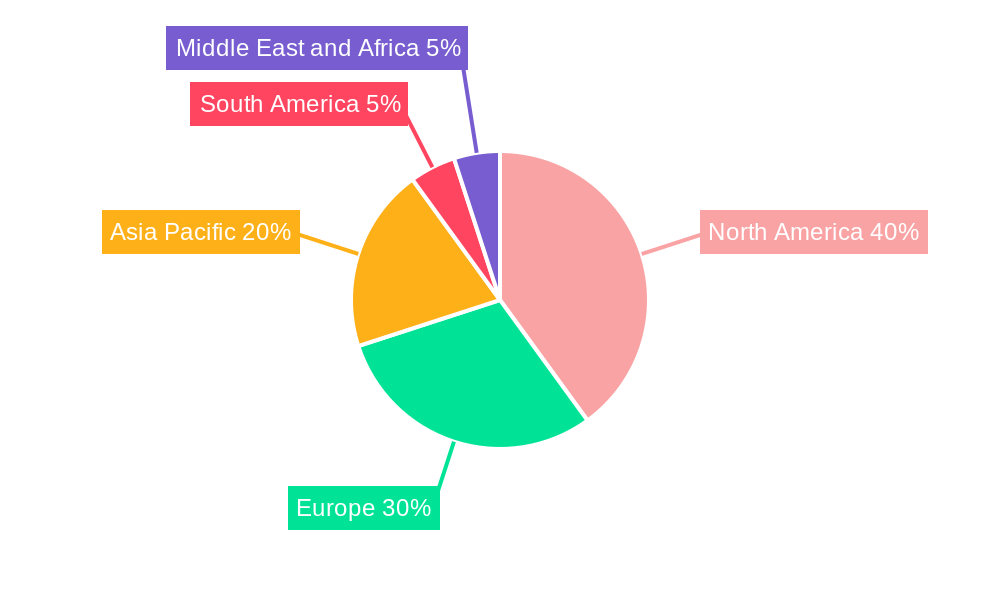
However, market growth is not without its challenges. High equipment costs and the need for specialized medical professionals can present significant barriers to entry, especially in developing nations. Strict regulatory approvals and reimbursement policies in various healthcare systems may also act as restraints on market expansion. Despite these challenges, the market is expected to witness substantial growth across all segments, with North America and Europe leading the way initially due to higher healthcare spending and technological infrastructure. Asia-Pacific is anticipated to exhibit considerable growth potential in the coming years, driven by rising disposable incomes, improved healthcare infrastructure, and increased awareness about minimally invasive procedures. This growth will be distributed across various applications, including cardiology, oncology, and gastroenterology, with a particular focus on innovative treatments and technological integration within these specialties.
Interventional Radiology Industry Market Report: 2019-2033
This comprehensive report provides a detailed analysis of the Interventional Radiology industry, covering market size, growth drivers, competitive landscape, and future outlook from 2019 to 2033. The report leverages extensive data analysis and expert insights to offer actionable intelligence for industry stakeholders. With a focus on key segments, including MRI Systems, Ultrasound Imaging Systems, and Angiography Systems, this report is a vital resource for strategic decision-making. The report includes a detailed analysis of major players like Hologic Inc, GE Healthcare, and Medtronic PLC, providing a granular understanding of the competitive dynamics at play. The estimated market size in 2025 is valued at $XX Million, projected to reach $XX Million by 2033, exhibiting a robust CAGR of XX%.
Interventional Radiology Industry Market Structure & Competitive Landscape
The interventional radiology market is moderately concentrated, with several major players holding significant market share. The Herfindahl-Hirschman Index (HHI) is estimated at XX, indicating a moderately consolidated market. Innovation is a key driver, with continuous advancements in imaging technology and minimally invasive procedures fueling market growth. Stringent regulatory frameworks, particularly concerning device approvals and safety standards, significantly impact market dynamics. Product substitutes, such as conventional surgery, pose a competitive challenge, albeit a declining one as interventional radiology gains wider acceptance. End-user segmentation includes hospitals, ambulatory surgical centers, and diagnostic imaging centers, each with unique needs and purchasing patterns. Mergers and acquisitions (M&A) activity has been relatively high in recent years, with XX major deals recorded between 2019 and 2024, valued at a total of $XX Million, reflecting strategic efforts to expand market reach and diversify product portfolios.
- Market Concentration: Moderately concentrated (HHI: XX)
- Innovation Drivers: Advanced imaging technologies, minimally invasive procedures
- Regulatory Impacts: Stringent device approvals and safety standards
- Product Substitutes: Conventional surgery
- End-User Segmentation: Hospitals, ambulatory surgical centers, diagnostic imaging centers
- M&A Trends: XX major deals between 2019 and 2024, totaling $XX Million
Interventional Radiology Industry Market Trends & Opportunities
The interventional radiology market is experiencing robust growth, driven by several key factors. The global market size is estimated at $XX Million in 2025, exhibiting a projected compound annual growth rate (CAGR) of XX% from 2025 to 2033. This growth is propelled by technological advancements, such as the development of higher-resolution imaging systems and more sophisticated interventional devices. The increasing prevalence of chronic diseases, such as cardiovascular disease and cancer, significantly contributes to the rising demand for minimally invasive procedures. Consumer preferences are shifting towards less invasive, faster recovery options, further boosting the adoption of interventional radiology techniques. Competitive dynamics are marked by intense innovation and strategic collaborations among major players, aiming to develop superior products and expand market reach. Market penetration rates vary across regions and applications, with developed markets showing higher adoption levels compared to developing nations. Technological shifts are creating significant opportunities for growth, especially in areas like AI-powered image analysis and robotic-assisted interventions.
Dominant Markets & Segments in Interventional Radiology Industry
The North American region currently dominates the interventional radiology market, driven by robust healthcare infrastructure, high adoption rates of advanced technologies, and favorable reimbursement policies. Within product segments, Angiography Systems and Ultrasound Imaging Systems represent the largest revenue contributors, reflecting their widespread applications across various medical specialties. In terms of application areas, Cardiology and Oncology show exceptionally strong growth potential due to the high prevalence of heart disease and cancer, respectively.
Key Growth Drivers:
- North America: Robust healthcare infrastructure, high technology adoption, favorable reimbursement policies.
- Angiography Systems & Ultrasound Imaging Systems: Widespread applications across medical specialties.
- Cardiology & Oncology: High prevalence of heart disease and cancer.
Market Dominance Analysis: The North American region accounts for approximately XX% of the global market share. Angiography systems and Ultrasound Imaging systems collectively constitute over XX% of total product revenue. Cardiology and Oncology applications jointly contribute to approximately XX% of the overall application revenue.
Interventional Radiology Industry Product Analysis
Technological advancements are driving significant innovations in interventional radiology products. High-resolution imaging systems, coupled with minimally invasive devices, allow for more precise diagnoses and treatments, improving patient outcomes and reducing recovery times. The integration of artificial intelligence (AI) and machine learning (ML) algorithms into imaging systems enhances diagnostic accuracy and efficiency. Companies are focusing on developing user-friendly interfaces and advanced features to streamline workflows and improve overall system performance. The success of new products hinges on their clinical efficacy, ease of use, and cost-effectiveness.
Key Drivers, Barriers & Challenges in Interventional Radiology Industry
Key Drivers:
The interventional radiology market is driven by technological advancements such as AI integration in imaging systems, minimally invasive procedures' rising demand, and increasing prevalence of chronic diseases like cardiovascular diseases and cancer. Government initiatives promoting early diagnosis and minimally invasive treatments further boost the market.
Challenges & Restraints:
High costs associated with advanced equipment and procedures, stringent regulatory requirements for device approval, and competition from alternative treatment modalities pose significant challenges. Supply chain disruptions can also lead to equipment shortages and price volatility, impacting market growth. The estimated impact of these challenges on market growth is a reduction of approximately XX% in the forecast period.
Growth Drivers in the Interventional Radiology Industry Market
Technological advancements, rising prevalence of chronic diseases, and increasing demand for minimally invasive procedures are key growth drivers. Government initiatives promoting early diagnosis and treatment, coupled with favorable reimbursement policies in certain regions, significantly contribute to market expansion.
Challenges Impacting Interventional Radiology Industry Growth
High equipment and procedure costs, stringent regulatory hurdles, and competition from alternative treatments pose major challenges. Supply chain disruptions and skilled personnel shortages further impact market growth. These factors are estimated to restrain the market by approximately XX% during the forecast period.
Key Players Shaping the Interventional Radiology Industry Market
- Hologic Inc
- GE Healthcare
- Medtronic PLC
- Siemens Healthineers AG
- Carestream Health
- Koninklijke Philips NV
- Canon Medical Systems Corporation
- Cook Medical
- Esaote SPA
- Shimadzu Corporation
- Samsung Medison (Samsung Electronics Co Ltd)
- Fujifilm Holdings Corporation
Significant Interventional Radiology Industry Milestones
- November 2022: Konica Minolta Healthcare Americas launched the Sonimage MX1 Platinum point-of-care ultrasound system. This launch expanded the availability of high-quality ultrasound imaging to a wider range of healthcare settings.
- November 2022: Fujifilm Healthcare Americas Corporation launched the Scenaria View Focus Edition CT system in the US, featuring advanced cardiac motion correction technology. This enhanced the capabilities of cardiac CT imaging significantly.
- October 2022: GE Healthcare launched the Omni Legend all-digital PET/CT platform, improving operational efficiency in nuclear medicine. This innovation streamlined workflows and potentially reduced costs.
Future Outlook for Interventional Radiology Industry Market
The interventional radiology market is poised for continued robust growth, fueled by technological advancements, expanding applications, and an aging global population. Strategic partnerships and investments in research and development will play a crucial role in shaping the future landscape. Opportunities exist in developing AI-powered diagnostic tools, robotic-assisted interventions, and personalized treatment approaches. The market is expected to witness strong growth driven by increased adoption of minimally invasive procedures and enhanced imaging technologies.
Interventional Radiology Industry Segmentation
-
1. Product
- 1.1. MRI Systems
- 1.2. Ultrasound Imaging Systems
- 1.3. CT Scanners
- 1.4. Angiography Systems
- 1.5. Fluoroscopy Systems
- 1.6. Biopsy Devices
- 1.7. Other Products
-
2. Application
- 2.1. Cardiology
- 2.2. Urology and Nephrology
- 2.3. Oncology
- 2.4. Gastroenterology
- 2.5. Other Applications
Interventional Radiology Industry Segmentation By Geography
-
1. North America
- 1.1. United States
- 1.2. Canada
- 1.3. Mexico
-
2. Europe
- 2.1. Germany
- 2.2. United Kingdom
- 2.3. France
- 2.4. Italy
- 2.5. Spain
- 2.6. Rest of Europe
-
3. Asia Pacific
- 3.1. China
- 3.2. Japan
- 3.3. India
- 3.4. Australia
- 3.5. South Korea
- 3.6. Rest of Asia Pacific
-
4. Middle East and Africa
- 4.1. GCC
- 4.2. South Africa
- 4.3. Rest of Middle East and Africa
-
5. South America
- 5.1. Brazil
- 5.2. Argentina
- 5.3. Rest of South America
Interventional Radiology Industry REPORT HIGHLIGHTS
| Aspects | Details |
|---|---|
| Study Period | 2019-2033 |
| Base Year | 2024 |
| Estimated Year | 2025 |
| Forecast Period | 2025-2033 |
| Historical Period | 2019-2024 |
| Growth Rate | CAGR of 5.90% from 2019-2033 |
| Segmentation |
|
Table of Contents
- 1. Introduction
- 1.1. Research Scope
- 1.2. Market Segmentation
- 1.3. Research Methodology
- 1.4. Definitions and Assumptions
- 2. Executive Summary
- 2.1. Introduction
- 3. Market Dynamics
- 3.1. Introduction
- 3.2. Market Drivers
- 3.2.1. Increasing Burden of Chronic Diseases; Technological Advancements in Interventional Radiology Devices
- 3.3. Market Restrains
- 3.3.1. Risk of High Radiation Exposure; High Cost of Equipment
- 3.4. Market Trends
- 3.4.1. The Cardiology Application is Expected to Witness High Growth Over the Forecast Period
- 4. Market Factor Analysis
- 4.1. Porters Five Forces
- 4.2. Supply/Value Chain
- 4.3. PESTEL analysis
- 4.4. Market Entropy
- 4.5. Patent/Trademark Analysis
- 5. Global Interventional Radiology Industry Analysis, Insights and Forecast, 2019-2031
- 5.1. Market Analysis, Insights and Forecast - by Product
- 5.1.1. MRI Systems
- 5.1.2. Ultrasound Imaging Systems
- 5.1.3. CT Scanners
- 5.1.4. Angiography Systems
- 5.1.5. Fluoroscopy Systems
- 5.1.6. Biopsy Devices
- 5.1.7. Other Products
- 5.2. Market Analysis, Insights and Forecast - by Application
- 5.2.1. Cardiology
- 5.2.2. Urology and Nephrology
- 5.2.3. Oncology
- 5.2.4. Gastroenterology
- 5.2.5. Other Applications
- 5.3. Market Analysis, Insights and Forecast - by Region
- 5.3.1. North America
- 5.3.2. Europe
- 5.3.3. Asia Pacific
- 5.3.4. Middle East and Africa
- 5.3.5. South America
- 5.1. Market Analysis, Insights and Forecast - by Product
- 6. North America Interventional Radiology Industry Analysis, Insights and Forecast, 2019-2031
- 6.1. Market Analysis, Insights and Forecast - by Product
- 6.1.1. MRI Systems
- 6.1.2. Ultrasound Imaging Systems
- 6.1.3. CT Scanners
- 6.1.4. Angiography Systems
- 6.1.5. Fluoroscopy Systems
- 6.1.6. Biopsy Devices
- 6.1.7. Other Products
- 6.2. Market Analysis, Insights and Forecast - by Application
- 6.2.1. Cardiology
- 6.2.2. Urology and Nephrology
- 6.2.3. Oncology
- 6.2.4. Gastroenterology
- 6.2.5. Other Applications
- 6.1. Market Analysis, Insights and Forecast - by Product
- 7. Europe Interventional Radiology Industry Analysis, Insights and Forecast, 2019-2031
- 7.1. Market Analysis, Insights and Forecast - by Product
- 7.1.1. MRI Systems
- 7.1.2. Ultrasound Imaging Systems
- 7.1.3. CT Scanners
- 7.1.4. Angiography Systems
- 7.1.5. Fluoroscopy Systems
- 7.1.6. Biopsy Devices
- 7.1.7. Other Products
- 7.2. Market Analysis, Insights and Forecast - by Application
- 7.2.1. Cardiology
- 7.2.2. Urology and Nephrology
- 7.2.3. Oncology
- 7.2.4. Gastroenterology
- 7.2.5. Other Applications
- 7.1. Market Analysis, Insights and Forecast - by Product
- 8. Asia Pacific Interventional Radiology Industry Analysis, Insights and Forecast, 2019-2031
- 8.1. Market Analysis, Insights and Forecast - by Product
- 8.1.1. MRI Systems
- 8.1.2. Ultrasound Imaging Systems
- 8.1.3. CT Scanners
- 8.1.4. Angiography Systems
- 8.1.5. Fluoroscopy Systems
- 8.1.6. Biopsy Devices
- 8.1.7. Other Products
- 8.2. Market Analysis, Insights and Forecast - by Application
- 8.2.1. Cardiology
- 8.2.2. Urology and Nephrology
- 8.2.3. Oncology
- 8.2.4. Gastroenterology
- 8.2.5. Other Applications
- 8.1. Market Analysis, Insights and Forecast - by Product
- 9. Middle East and Africa Interventional Radiology Industry Analysis, Insights and Forecast, 2019-2031
- 9.1. Market Analysis, Insights and Forecast - by Product
- 9.1.1. MRI Systems
- 9.1.2. Ultrasound Imaging Systems
- 9.1.3. CT Scanners
- 9.1.4. Angiography Systems
- 9.1.5. Fluoroscopy Systems
- 9.1.6. Biopsy Devices
- 9.1.7. Other Products
- 9.2. Market Analysis, Insights and Forecast - by Application
- 9.2.1. Cardiology
- 9.2.2. Urology and Nephrology
- 9.2.3. Oncology
- 9.2.4. Gastroenterology
- 9.2.5. Other Applications
- 9.1. Market Analysis, Insights and Forecast - by Product
- 10. South America Interventional Radiology Industry Analysis, Insights and Forecast, 2019-2031
- 10.1. Market Analysis, Insights and Forecast - by Product
- 10.1.1. MRI Systems
- 10.1.2. Ultrasound Imaging Systems
- 10.1.3. CT Scanners
- 10.1.4. Angiography Systems
- 10.1.5. Fluoroscopy Systems
- 10.1.6. Biopsy Devices
- 10.1.7. Other Products
- 10.2. Market Analysis, Insights and Forecast - by Application
- 10.2.1. Cardiology
- 10.2.2. Urology and Nephrology
- 10.2.3. Oncology
- 10.2.4. Gastroenterology
- 10.2.5. Other Applications
- 10.1. Market Analysis, Insights and Forecast - by Product
- 11. North America Interventional Radiology Industry Analysis, Insights and Forecast, 2019-2031
- 11.1. Market Analysis, Insights and Forecast - By Country/Sub-region
- 11.1.1 United States
- 11.1.2 Canada
- 11.1.3 Mexico
- 12. Europe Interventional Radiology Industry Analysis, Insights and Forecast, 2019-2031
- 12.1. Market Analysis, Insights and Forecast - By Country/Sub-region
- 12.1.1 Germany
- 12.1.2 United Kingdom
- 12.1.3 France
- 12.1.4 Italy
- 12.1.5 Spain
- 12.1.6 Rest of Europe
- 13. Asia Pacific Interventional Radiology Industry Analysis, Insights and Forecast, 2019-2031
- 13.1. Market Analysis, Insights and Forecast - By Country/Sub-region
- 13.1.1 China
- 13.1.2 Japan
- 13.1.3 India
- 13.1.4 Australia
- 13.1.5 South Korea
- 13.1.6 Rest of Asia Pacific
- 14. South America Interventional Radiology Industry Analysis, Insights and Forecast, 2019-2031
- 14.1. Market Analysis, Insights and Forecast - By Country/Sub-region
- 14.1.1 Brazil
- 14.1.2 Argentina
- 14.1.3 Rest of South America
- 15. Middle East and Africa Interventional Radiology Industry Analysis, Insights and Forecast, 2019-2031
- 15.1. Market Analysis, Insights and Forecast - By Country/Sub-region
- 15.1.1 GCC
- 15.1.2 South Africa
- 15.1.3 Rest of Middle East and Africa
- 16. Competitive Analysis
- 16.1. Global Market Share Analysis 2024
- 16.2. Company Profiles
- 16.2.1 Hologic Inc
- 16.2.1.1. Overview
- 16.2.1.2. Products
- 16.2.1.3. SWOT Analysis
- 16.2.1.4. Recent Developments
- 16.2.1.5. Financials (Based on Availability)
- 16.2.2 GE Healthcare
- 16.2.2.1. Overview
- 16.2.2.2. Products
- 16.2.2.3. SWOT Analysis
- 16.2.2.4. Recent Developments
- 16.2.2.5. Financials (Based on Availability)
- 16.2.3 Medtronic PLC
- 16.2.3.1. Overview
- 16.2.3.2. Products
- 16.2.3.3. SWOT Analysis
- 16.2.3.4. Recent Developments
- 16.2.3.5. Financials (Based on Availability)
- 16.2.4 Siemens Healthineers AG
- 16.2.4.1. Overview
- 16.2.4.2. Products
- 16.2.4.3. SWOT Analysis
- 16.2.4.4. Recent Developments
- 16.2.4.5. Financials (Based on Availability)
- 16.2.5 Carestream Health
- 16.2.5.1. Overview
- 16.2.5.2. Products
- 16.2.5.3. SWOT Analysis
- 16.2.5.4. Recent Developments
- 16.2.5.5. Financials (Based on Availability)
- 16.2.6 Koninklijke Philips NV
- 16.2.6.1. Overview
- 16.2.6.2. Products
- 16.2.6.3. SWOT Analysis
- 16.2.6.4. Recent Developments
- 16.2.6.5. Financials (Based on Availability)
- 16.2.7 Canon Medical Systems Corporation
- 16.2.7.1. Overview
- 16.2.7.2. Products
- 16.2.7.3. SWOT Analysis
- 16.2.7.4. Recent Developments
- 16.2.7.5. Financials (Based on Availability)
- 16.2.8 Cook Medical
- 16.2.8.1. Overview
- 16.2.8.2. Products
- 16.2.8.3. SWOT Analysis
- 16.2.8.4. Recent Developments
- 16.2.8.5. Financials (Based on Availability)
- 16.2.9 Esaote SPA
- 16.2.9.1. Overview
- 16.2.9.2. Products
- 16.2.9.3. SWOT Analysis
- 16.2.9.4. Recent Developments
- 16.2.9.5. Financials (Based on Availability)
- 16.2.10 Shimadzu Corporation
- 16.2.10.1. Overview
- 16.2.10.2. Products
- 16.2.10.3. SWOT Analysis
- 16.2.10.4. Recent Developments
- 16.2.10.5. Financials (Based on Availability)
- 16.2.11 Samsung Medison (Samsung Electronics Co Ltd)
- 16.2.11.1. Overview
- 16.2.11.2. Products
- 16.2.11.3. SWOT Analysis
- 16.2.11.4. Recent Developments
- 16.2.11.5. Financials (Based on Availability)
- 16.2.12 Fujifilm Holdings Corporation
- 16.2.12.1. Overview
- 16.2.12.2. Products
- 16.2.12.3. SWOT Analysis
- 16.2.12.4. Recent Developments
- 16.2.12.5. Financials (Based on Availability)
- 16.2.1 Hologic Inc
List of Figures
- Figure 1: Global Interventional Radiology Industry Revenue Breakdown (Million, %) by Region 2024 & 2032
- Figure 2: North America Interventional Radiology Industry Revenue (Million), by Country 2024 & 2032
- Figure 3: North America Interventional Radiology Industry Revenue Share (%), by Country 2024 & 2032
- Figure 4: Europe Interventional Radiology Industry Revenue (Million), by Country 2024 & 2032
- Figure 5: Europe Interventional Radiology Industry Revenue Share (%), by Country 2024 & 2032
- Figure 6: Asia Pacific Interventional Radiology Industry Revenue (Million), by Country 2024 & 2032
- Figure 7: Asia Pacific Interventional Radiology Industry Revenue Share (%), by Country 2024 & 2032
- Figure 8: South America Interventional Radiology Industry Revenue (Million), by Country 2024 & 2032
- Figure 9: South America Interventional Radiology Industry Revenue Share (%), by Country 2024 & 2032
- Figure 10: Middle East and Africa Interventional Radiology Industry Revenue (Million), by Country 2024 & 2032
- Figure 11: Middle East and Africa Interventional Radiology Industry Revenue Share (%), by Country 2024 & 2032
- Figure 12: North America Interventional Radiology Industry Revenue (Million), by Product 2024 & 2032
- Figure 13: North America Interventional Radiology Industry Revenue Share (%), by Product 2024 & 2032
- Figure 14: North America Interventional Radiology Industry Revenue (Million), by Application 2024 & 2032
- Figure 15: North America Interventional Radiology Industry Revenue Share (%), by Application 2024 & 2032
- Figure 16: North America Interventional Radiology Industry Revenue (Million), by Country 2024 & 2032
- Figure 17: North America Interventional Radiology Industry Revenue Share (%), by Country 2024 & 2032
- Figure 18: Europe Interventional Radiology Industry Revenue (Million), by Product 2024 & 2032
- Figure 19: Europe Interventional Radiology Industry Revenue Share (%), by Product 2024 & 2032
- Figure 20: Europe Interventional Radiology Industry Revenue (Million), by Application 2024 & 2032
- Figure 21: Europe Interventional Radiology Industry Revenue Share (%), by Application 2024 & 2032
- Figure 22: Europe Interventional Radiology Industry Revenue (Million), by Country 2024 & 2032
- Figure 23: Europe Interventional Radiology Industry Revenue Share (%), by Country 2024 & 2032
- Figure 24: Asia Pacific Interventional Radiology Industry Revenue (Million), by Product 2024 & 2032
- Figure 25: Asia Pacific Interventional Radiology Industry Revenue Share (%), by Product 2024 & 2032
- Figure 26: Asia Pacific Interventional Radiology Industry Revenue (Million), by Application 2024 & 2032
- Figure 27: Asia Pacific Interventional Radiology Industry Revenue Share (%), by Application 2024 & 2032
- Figure 28: Asia Pacific Interventional Radiology Industry Revenue (Million), by Country 2024 & 2032
- Figure 29: Asia Pacific Interventional Radiology Industry Revenue Share (%), by Country 2024 & 2032
- Figure 30: Middle East and Africa Interventional Radiology Industry Revenue (Million), by Product 2024 & 2032
- Figure 31: Middle East and Africa Interventional Radiology Industry Revenue Share (%), by Product 2024 & 2032
- Figure 32: Middle East and Africa Interventional Radiology Industry Revenue (Million), by Application 2024 & 2032
- Figure 33: Middle East and Africa Interventional Radiology Industry Revenue Share (%), by Application 2024 & 2032
- Figure 34: Middle East and Africa Interventional Radiology Industry Revenue (Million), by Country 2024 & 2032
- Figure 35: Middle East and Africa Interventional Radiology Industry Revenue Share (%), by Country 2024 & 2032
- Figure 36: South America Interventional Radiology Industry Revenue (Million), by Product 2024 & 2032
- Figure 37: South America Interventional Radiology Industry Revenue Share (%), by Product 2024 & 2032
- Figure 38: South America Interventional Radiology Industry Revenue (Million), by Application 2024 & 2032
- Figure 39: South America Interventional Radiology Industry Revenue Share (%), by Application 2024 & 2032
- Figure 40: South America Interventional Radiology Industry Revenue (Million), by Country 2024 & 2032
- Figure 41: South America Interventional Radiology Industry Revenue Share (%), by Country 2024 & 2032
List of Tables
- Table 1: Global Interventional Radiology Industry Revenue Million Forecast, by Region 2019 & 2032
- Table 2: Global Interventional Radiology Industry Revenue Million Forecast, by Product 2019 & 2032
- Table 3: Global Interventional Radiology Industry Revenue Million Forecast, by Application 2019 & 2032
- Table 4: Global Interventional Radiology Industry Revenue Million Forecast, by Region 2019 & 2032
- Table 5: Global Interventional Radiology Industry Revenue Million Forecast, by Country 2019 & 2032
- Table 6: United States Interventional Radiology Industry Revenue (Million) Forecast, by Application 2019 & 2032
- Table 7: Canada Interventional Radiology Industry Revenue (Million) Forecast, by Application 2019 & 2032
- Table 8: Mexico Interventional Radiology Industry Revenue (Million) Forecast, by Application 2019 & 2032
- Table 9: Global Interventional Radiology Industry Revenue Million Forecast, by Country 2019 & 2032
- Table 10: Germany Interventional Radiology Industry Revenue (Million) Forecast, by Application 2019 & 2032
- Table 11: United Kingdom Interventional Radiology Industry Revenue (Million) Forecast, by Application 2019 & 2032
- Table 12: France Interventional Radiology Industry Revenue (Million) Forecast, by Application 2019 & 2032
- Table 13: Italy Interventional Radiology Industry Revenue (Million) Forecast, by Application 2019 & 2032
- Table 14: Spain Interventional Radiology Industry Revenue (Million) Forecast, by Application 2019 & 2032
- Table 15: Rest of Europe Interventional Radiology Industry Revenue (Million) Forecast, by Application 2019 & 2032
- Table 16: Global Interventional Radiology Industry Revenue Million Forecast, by Country 2019 & 2032
- Table 17: China Interventional Radiology Industry Revenue (Million) Forecast, by Application 2019 & 2032
- Table 18: Japan Interventional Radiology Industry Revenue (Million) Forecast, by Application 2019 & 2032
- Table 19: India Interventional Radiology Industry Revenue (Million) Forecast, by Application 2019 & 2032
- Table 20: Australia Interventional Radiology Industry Revenue (Million) Forecast, by Application 2019 & 2032
- Table 21: South Korea Interventional Radiology Industry Revenue (Million) Forecast, by Application 2019 & 2032
- Table 22: Rest of Asia Pacific Interventional Radiology Industry Revenue (Million) Forecast, by Application 2019 & 2032
- Table 23: Global Interventional Radiology Industry Revenue Million Forecast, by Country 2019 & 2032
- Table 24: Brazil Interventional Radiology Industry Revenue (Million) Forecast, by Application 2019 & 2032
- Table 25: Argentina Interventional Radiology Industry Revenue (Million) Forecast, by Application 2019 & 2032
- Table 26: Rest of South America Interventional Radiology Industry Revenue (Million) Forecast, by Application 2019 & 2032
- Table 27: Global Interventional Radiology Industry Revenue Million Forecast, by Country 2019 & 2032
- Table 28: GCC Interventional Radiology Industry Revenue (Million) Forecast, by Application 2019 & 2032
- Table 29: South Africa Interventional Radiology Industry Revenue (Million) Forecast, by Application 2019 & 2032
- Table 30: Rest of Middle East and Africa Interventional Radiology Industry Revenue (Million) Forecast, by Application 2019 & 2032
- Table 31: Global Interventional Radiology Industry Revenue Million Forecast, by Product 2019 & 2032
- Table 32: Global Interventional Radiology Industry Revenue Million Forecast, by Application 2019 & 2032
- Table 33: Global Interventional Radiology Industry Revenue Million Forecast, by Country 2019 & 2032
- Table 34: United States Interventional Radiology Industry Revenue (Million) Forecast, by Application 2019 & 2032
- Table 35: Canada Interventional Radiology Industry Revenue (Million) Forecast, by Application 2019 & 2032
- Table 36: Mexico Interventional Radiology Industry Revenue (Million) Forecast, by Application 2019 & 2032
- Table 37: Global Interventional Radiology Industry Revenue Million Forecast, by Product 2019 & 2032
- Table 38: Global Interventional Radiology Industry Revenue Million Forecast, by Application 2019 & 2032
- Table 39: Global Interventional Radiology Industry Revenue Million Forecast, by Country 2019 & 2032
- Table 40: Germany Interventional Radiology Industry Revenue (Million) Forecast, by Application 2019 & 2032
- Table 41: United Kingdom Interventional Radiology Industry Revenue (Million) Forecast, by Application 2019 & 2032
- Table 42: France Interventional Radiology Industry Revenue (Million) Forecast, by Application 2019 & 2032
- Table 43: Italy Interventional Radiology Industry Revenue (Million) Forecast, by Application 2019 & 2032
- Table 44: Spain Interventional Radiology Industry Revenue (Million) Forecast, by Application 2019 & 2032
- Table 45: Rest of Europe Interventional Radiology Industry Revenue (Million) Forecast, by Application 2019 & 2032
- Table 46: Global Interventional Radiology Industry Revenue Million Forecast, by Product 2019 & 2032
- Table 47: Global Interventional Radiology Industry Revenue Million Forecast, by Application 2019 & 2032
- Table 48: Global Interventional Radiology Industry Revenue Million Forecast, by Country 2019 & 2032
- Table 49: China Interventional Radiology Industry Revenue (Million) Forecast, by Application 2019 & 2032
- Table 50: Japan Interventional Radiology Industry Revenue (Million) Forecast, by Application 2019 & 2032
- Table 51: India Interventional Radiology Industry Revenue (Million) Forecast, by Application 2019 & 2032
- Table 52: Australia Interventional Radiology Industry Revenue (Million) Forecast, by Application 2019 & 2032
- Table 53: South Korea Interventional Radiology Industry Revenue (Million) Forecast, by Application 2019 & 2032
- Table 54: Rest of Asia Pacific Interventional Radiology Industry Revenue (Million) Forecast, by Application 2019 & 2032
- Table 55: Global Interventional Radiology Industry Revenue Million Forecast, by Product 2019 & 2032
- Table 56: Global Interventional Radiology Industry Revenue Million Forecast, by Application 2019 & 2032
- Table 57: Global Interventional Radiology Industry Revenue Million Forecast, by Country 2019 & 2032
- Table 58: GCC Interventional Radiology Industry Revenue (Million) Forecast, by Application 2019 & 2032
- Table 59: South Africa Interventional Radiology Industry Revenue (Million) Forecast, by Application 2019 & 2032
- Table 60: Rest of Middle East and Africa Interventional Radiology Industry Revenue (Million) Forecast, by Application 2019 & 2032
- Table 61: Global Interventional Radiology Industry Revenue Million Forecast, by Product 2019 & 2032
- Table 62: Global Interventional Radiology Industry Revenue Million Forecast, by Application 2019 & 2032
- Table 63: Global Interventional Radiology Industry Revenue Million Forecast, by Country 2019 & 2032
- Table 64: Brazil Interventional Radiology Industry Revenue (Million) Forecast, by Application 2019 & 2032
- Table 65: Argentina Interventional Radiology Industry Revenue (Million) Forecast, by Application 2019 & 2032
- Table 66: Rest of South America Interventional Radiology Industry Revenue (Million) Forecast, by Application 2019 & 2032
Frequently Asked Questions
1. What is the projected Compound Annual Growth Rate (CAGR) of the Interventional Radiology Industry?
The projected CAGR is approximately 5.90%.
2. Which companies are prominent players in the Interventional Radiology Industry?
Key companies in the market include Hologic Inc, GE Healthcare, Medtronic PLC, Siemens Healthineers AG, Carestream Health, Koninklijke Philips NV, Canon Medical Systems Corporation, Cook Medical, Esaote SPA, Shimadzu Corporation, Samsung Medison (Samsung Electronics Co Ltd), Fujifilm Holdings Corporation.
3. What are the main segments of the Interventional Radiology Industry?
The market segments include Product, Application.
4. Can you provide details about the market size?
The market size is estimated to be USD 26.96 Million as of 2022.
5. What are some drivers contributing to market growth?
Increasing Burden of Chronic Diseases; Technological Advancements in Interventional Radiology Devices.
6. What are the notable trends driving market growth?
The Cardiology Application is Expected to Witness High Growth Over the Forecast Period.
7. Are there any restraints impacting market growth?
Risk of High Radiation Exposure; High Cost of Equipment.
8. Can you provide examples of recent developments in the market?
November 2022: Konica Minolta Healthcare Americas launched a new point-of-care ultrasound system called Sonimage MX1 Platinum.
9. What pricing options are available for accessing the report?
Pricing options include single-user, multi-user, and enterprise licenses priced at USD 4750, USD 5250, and USD 8750 respectively.
10. Is the market size provided in terms of value or volume?
The market size is provided in terms of value, measured in Million.
11. Are there any specific market keywords associated with the report?
Yes, the market keyword associated with the report is "Interventional Radiology Industry," which aids in identifying and referencing the specific market segment covered.
12. How do I determine which pricing option suits my needs best?
The pricing options vary based on user requirements and access needs. Individual users may opt for single-user licenses, while businesses requiring broader access may choose multi-user or enterprise licenses for cost-effective access to the report.
13. Are there any additional resources or data provided in the Interventional Radiology Industry report?
While the report offers comprehensive insights, it's advisable to review the specific contents or supplementary materials provided to ascertain if additional resources or data are available.
14. How can I stay updated on further developments or reports in the Interventional Radiology Industry?
To stay informed about further developments, trends, and reports in the Interventional Radiology Industry, consider subscribing to industry newsletters, following relevant companies and organizations, or regularly checking reputable industry news sources and publications.
Methodology
Step 1 - Identification of Relevant Samples Size from Population Database


Step 2 - Approaches for Defining Global Market Size (Value, Volume* & Price*)

Note*: In applicable scenarios
Step 3 - Data Sources
Primary Research
- Web Analytics
- Survey Reports
- Research Institute
- Latest Research Reports
- Opinion Leaders
Secondary Research
- Annual Reports
- White Paper
- Latest Press Release
- Industry Association
- Paid Database
- Investor Presentations

Step 4 - Data Triangulation
Involves using different sources of information in order to increase the validity of a study
These sources are likely to be stakeholders in a program - participants, other researchers, program staff, other community members, and so on.
Then we put all data in single framework & apply various statistical tools to find out the dynamic on the market.
During the analysis stage, feedback from the stakeholder groups would be compared to determine areas of agreement as well as areas of divergence
