

Key Insights
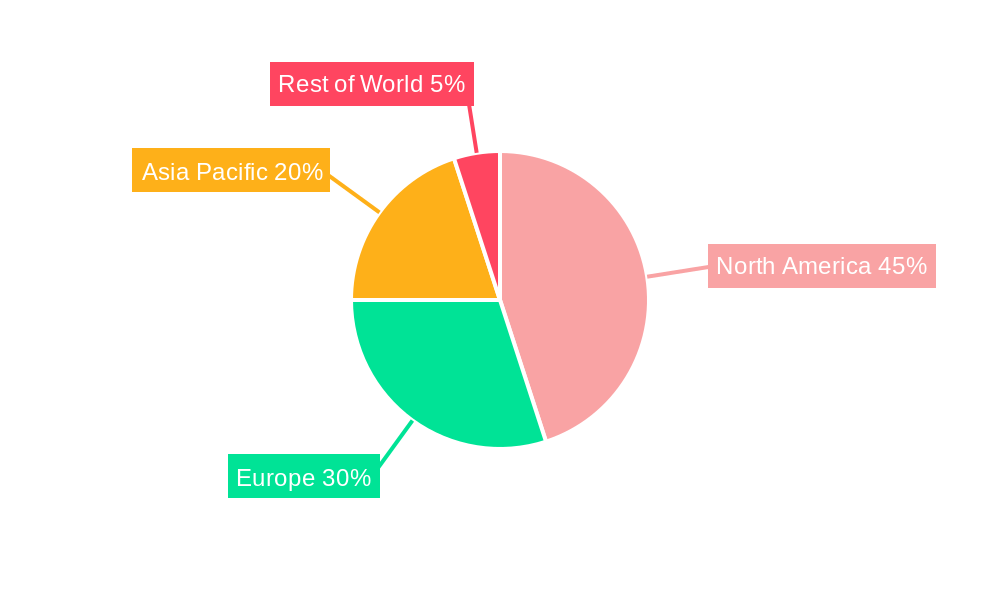
The label-free array systems market is experiencing robust growth, driven by the increasing demand for high-throughput screening in drug discovery and the rising adoption of advanced technologies like surface plasmon resonance (SPR) and bio layer interferometry (BLI). The market's expansion is fueled by several key factors. Firstly, the pharmaceutical and biotechnology industries are heavily investing in research and development to accelerate drug discovery processes. Label-free array systems significantly contribute to this acceleration by enabling faster and more efficient analysis of biomolecular interactions. Secondly, the technological advancements in miniaturization and automation of these systems are making them more accessible and cost-effective for a broader range of research applications. This includes expanding applications beyond traditional drug discovery into areas such as protein engineering, diagnostics, and agricultural research. The market is segmented by end-user (Contract Research Organizations, Agricultural Research Institutes, R&D Laboratories, and others), technology (SPR, BLI, Cellular Dielectric Spectroscopy, and others), and application (drug discovery, protein interface analysis, antibody characterization, protein complex analysis, and others). North America currently holds a significant market share due to the concentration of pharmaceutical companies and research institutions, but the Asia-Pacific region is projected to exhibit the highest growth rate due to rising investments in biotechnology and expanding R&D infrastructure. Competitive factors include the presence of established players like ThermoFisher Scientific and PerkinElmer alongside emerging companies offering innovative solutions.
Despite the positive growth trajectory, the market faces some challenges. The high initial investment cost for these systems can be a barrier to entry for smaller research institutions and laboratories. Furthermore, the need for specialized expertise to operate and maintain these sophisticated instruments presents another hurdle. However, ongoing technological innovation focused on user-friendliness and cost reduction is gradually mitigating these limitations. The continued advancements in label-free array technology are expected to further drive market expansion over the forecast period, potentially exceeding the provided 6.20% CAGR as new applications emerge and existing applications are enhanced. This continuous improvement will contribute to the widespread adoption of label-free array systems across diverse research sectors and solidify their position as indispensable tools in biomolecular interaction analysis.
Label-free Array Systems Market: A Comprehensive Analysis (2019-2033)
This comprehensive report provides an in-depth analysis of the Label-free Array Systems market, offering invaluable insights for stakeholders across the pharmaceutical, biotechnology, and agricultural research sectors. Covering the period from 2019 to 2033, with a base year of 2025 and a forecast period of 2025-2033, this report meticulously examines market dynamics, competitive landscapes, technological advancements, and future growth potential. The market is projected to reach xx Million by 2033, exhibiting a CAGR of xx% during the forecast period.
Label-free Array Systems Market Market Structure & Competitive Landscape
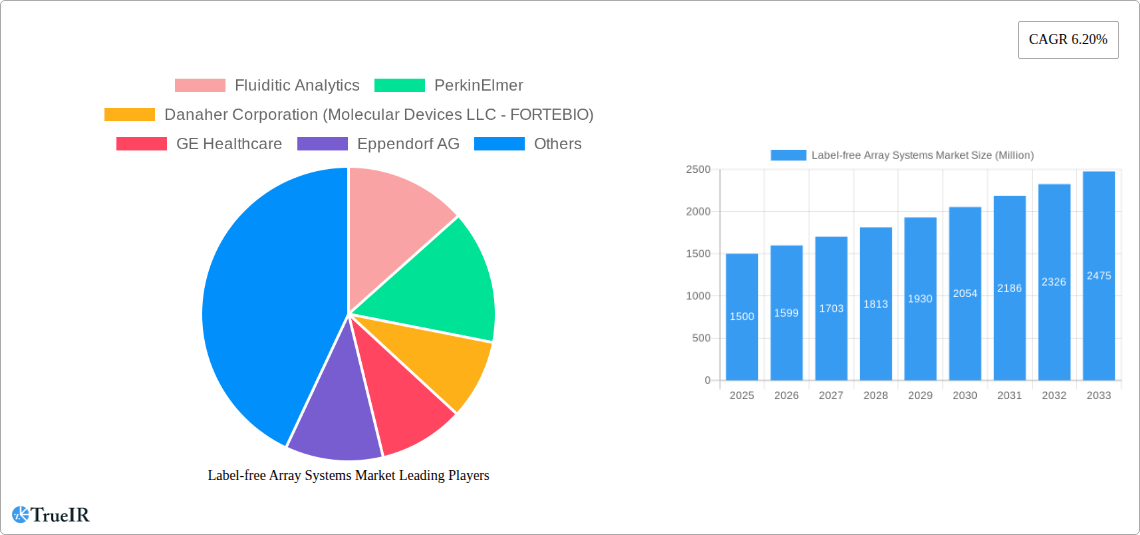
The Label-free Array Systems market exhibits a moderately concentrated structure, with key players like PerkinElmer, Danaher Corporation (Molecular Devices LLC - FORTEBIO), GE Healthcare, Eppendorf AG, ThermoFisher Scientific, Bio-rad Laboratories, Bruker Corporation, Corning Incorporated, Shimadzu Corporation, and Fluiditic Analytics holding significant market share. The Herfindahl-Hirschman Index (HHI) is estimated at xx, indicating a moderately competitive landscape.
- Innovation Drivers: Continuous advancements in biosensor technologies, miniaturization, and automation are driving market growth. The development of high-throughput screening platforms and improved data analysis tools is further fueling market expansion.
- Regulatory Impacts: Stringent regulatory approvals for new diagnostic and therapeutic applications influence market dynamics. Compliance with international standards and guidelines necessitates significant investment in quality control and validation processes.
- Product Substitutes: While label-free array systems offer unique advantages, competing technologies such as ELISA and other label-based assays present alternative solutions. The choice often depends on specific application requirements and budget constraints.
- End-User Segmentation: The market is segmented by end-users including Contract Research Organizations (CROs), Agricultural Research Institutes, R&D Laboratories, and other end-users. CROs represent a significant portion of the market due to their high throughput testing requirements.
- M&A Trends: The past five years have witnessed xx mergers and acquisitions in the Label-free Array Systems market, primarily driven by strategic alliances and expansion into new technologies and geographical markets. The total value of these transactions is estimated at xx Million.
Label-free Array Systems Market Market Trends & Opportunities
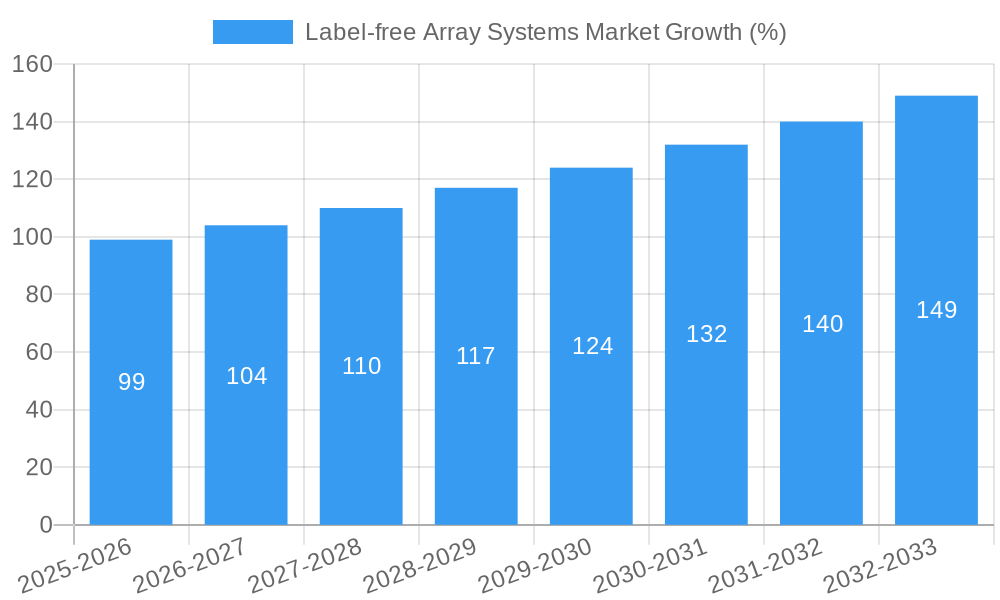
The Label-free Array Systems market is experiencing robust growth, driven by the increasing demand for high-throughput screening in drug discovery, personalized medicine, and agricultural research. The market size reached xx Million in 2024 and is projected to reach xx Million by 2033, exhibiting a significant Compound Annual Growth Rate (CAGR) of xx%. This growth is fueled by several key factors:
The increasing prevalence of chronic diseases, coupled with the rising demand for faster and more efficient drug discovery processes, is driving the adoption of label-free array systems. Technological advancements, such as the development of more sensitive and versatile biosensors, are enabling the detection of subtle biomolecular interactions, thus improving the accuracy and efficiency of drug development. Furthermore, the growing adoption of automation and miniaturization techniques has resulted in higher throughput and reduced costs, making label-free array systems more accessible to researchers and pharmaceutical companies. The market penetration rate for label-free array systems in the drug discovery segment is estimated at xx%, with significant potential for future growth in other applications, such as agricultural research and diagnostics. Competitive dynamics are characterized by intense innovation, strategic partnerships, and mergers and acquisitions, leading to continuous improvements in technology and the expansion of market offerings.
Dominant Markets & Segments in Label-free Array Systems Market
The North American region currently dominates the Label-free Array Systems market, driven by robust funding for research and development, a well-established pharmaceutical industry, and the presence of major market players. Within this region, the United States holds the largest market share.
- Key Growth Drivers in North America:
- Strong government support for biomedical research.
- High concentration of pharmaceutical and biotechnology companies.
- Well-developed healthcare infrastructure.
- Significant investments in R&D within the region.
Segment Dominance:
- End User: Contract Research Organizations (CROs) constitute the largest end-user segment, owing to their high volume testing needs and adoption of advanced technologies for efficient drug development.
- Technology: Surface Plasmon Resonance (SPR) currently holds the largest market share among available technologies due to its widespread adoption and established reliability in biomolecular interaction studies.
- Application: Drug discovery is the dominant application area, driven by the significant need for high-throughput screening and precise characterization of drug candidates in the pharmaceutical industry.
Label-free Array Systems Market Product Analysis
Recent product innovations focus on improved sensitivity, higher throughput, and integrated data analysis capabilities. Miniaturization and automation are key trends, leading to cost-effective and user-friendly systems. New label-free array systems are increasingly incorporating advanced functionalities like multiplexing, enabling the simultaneous analysis of numerous interactions. These advancements enhance the efficiency and versatility of these systems, broadening their applicability across various research areas. Competitive advantages stem from superior sensitivity, ease of use, data analysis capabilities, and cost-effectiveness.
Key Drivers, Barriers & Challenges in Label-free Array Systems Market
Key Drivers:
The rising prevalence of chronic diseases, coupled with the expanding demand for personalized medicine, is driving the growth of the label-free array systems market. Furthermore, technological advancements such as improved sensitivity, higher throughput, and user-friendly interfaces are significantly impacting adoption rates. Increased government funding for biomedical research and the development of efficient drug discovery methods also provide significant impetus to market growth.
Challenges:
High initial investment costs and the complexity of data analysis pose significant challenges. Furthermore, stringent regulatory approvals for new applications and the presence of substitute technologies create competitive pressure. Supply chain disruptions can also impact the availability and pricing of components, thus influencing overall market dynamics. Estimates indicate that supply chain challenges have resulted in a xx% increase in the cost of some key components during the past year.
Growth Drivers in the Label-free Array Systems Market Market
Technological advancements, increasing demand from the pharmaceutical industry, growing investments in R&D, and supportive government policies are primary growth drivers. The development of more sensitive and versatile biosensors has significantly enhanced the capabilities of label-free array systems, driving their adoption in various applications.
Challenges Impacting Label-free Array Systems Market Growth
High capital expenditure, complex data analysis, regulatory hurdles, and the availability of alternative technologies are key barriers. The need for skilled personnel to operate and interpret data from these systems also presents a challenge. Furthermore, supply chain vulnerabilities can disrupt the availability of essential components, impacting the production and delivery of these systems.
Key Players Shaping the Label-free Array Systems Market Market
- Fluiditic Analytics
- PerkinElmer
- Danaher Corporation (Molecular Devices LLC - FORTEBIO)
- GE Healthcare
- Eppendorf AG
- ThermoFisher Scientific
- Bio-rad Laboratories
- Bruker Corporation
- Corning Incorporated
- Shimadzu Corporation
Significant Label-free Array Systems Market Industry Milestones
- 2020: Launch of a new high-throughput label-free array system by PerkinElmer, significantly improving screening capabilities.
- 2021: Acquisition of a smaller biosensor company by Danaher Corporation, expanding its portfolio of label-free technologies.
- 2022: Introduction of a novel biosensor technology based on cellular dielectric spectroscopy by a smaller company, expanding the scope of label-free applications.
- 2023: FDA approval of a diagnostic test using label-free array systems for early detection of a specific disease.
Future Outlook for Label-free Array Systems Market Market
The Label-free Array Systems market is poised for substantial growth driven by technological innovation, increasing research funding, and expanding applications across various sectors. Strategic partnerships and further consolidation through mergers and acquisitions are expected to reshape the competitive landscape. The development of more user-friendly and cost-effective systems will expand the market’s accessibility, fueling significant market expansion in the coming years.
Label-free Array Systems Market Segmentation
-
1. Technology
- 1.1. Surface Plasmon Resonance
- 1.2. Bio Layer Interferometry
- 1.3. Cellular Dielectric Spectroscopy
- 1.4. Other Technologies
-
2. Application
- 2.1. Drug Discovery
- 2.2. Protein Interface Analysis
- 2.3. Antibody Characterization and Development
- 2.4. Protein Complex and Cascade Analysis
- 2.5. Other Applications
-
3. End User
- 3.1. Contract Research Organizations
- 3.2. Agricultural Research Institutes
- 3.3. R&D Laboratories
- 3.4. Other End Users
Label-free Array Systems Market Segmentation By Geography
-
1. North America
- 1.1. United States
- 1.2. Canada
- 1.3. Mexico
-
2. Europe
- 2.1. Germany
- 2.2. United Kingdom
- 2.3. France
- 2.4. Italy
- 2.5. Spain
- 2.6. Rest of Europe
-
3. Asia Pacific
- 3.1. China
- 3.2. Japan
- 3.3. India
- 3.4. Australia
- 3.5. South Korea
- 3.6. Rest of Asia Pacific
- 4. Middle East
-
5. GCC
- 5.1. South Africa
- 5.2. Rest of Middle East
-
6. South America
- 6.1. Brazil
- 6.2. Argentina
- 6.3. Rest of South America
Label-free Array Systems Market REPORT HIGHLIGHTS
| Aspects | Details |
|---|---|
| Study Period | 2019-2033 |
| Base Year | 2024 |
| Estimated Year | 2025 |
| Forecast Period | 2025-2033 |
| Historical Period | 2019-2024 |
| Growth Rate | CAGR of 6.20% from 2019-2033 |
| Segmentation |
|
Table of Contents
- 1. Introduction
- 1.1. Research Scope
- 1.2. Market Segmentation
- 1.3. Research Methodology
- 1.4. Definitions and Assumptions
- 2. Executive Summary
- 2.1. Introduction
- 3. Market Dynamics
- 3.1. Introduction
- 3.2. Market Drivers
- 3.2.1. ; Advantages over Labeled Detection Techniques; Increase in the R&D Expenditure of Pharmaceutical and Biotechnology Companies; Technological Advancements in Label-free Technologies
- 3.3. Market Restrains
- 3.3.1. ; High Instrumentation Costs; Lack of Awareness
- 3.4. Market Trends
- 3.4.1. The Surface Plasmon Resonance Technology Segment is Expected to the Exhibit the Fastest Growth During the Forecast Period
- 4. Market Factor Analysis
- 4.1. Porters Five Forces
- 4.2. Supply/Value Chain
- 4.3. PESTEL analysis
- 4.4. Market Entropy
- 4.5. Patent/Trademark Analysis
- 5. Global Label-free Array Systems Market Analysis, Insights and Forecast, 2019-2031
- 5.1. Market Analysis, Insights and Forecast - by Technology
- 5.1.1. Surface Plasmon Resonance
- 5.1.2. Bio Layer Interferometry
- 5.1.3. Cellular Dielectric Spectroscopy
- 5.1.4. Other Technologies
- 5.2. Market Analysis, Insights and Forecast - by Application
- 5.2.1. Drug Discovery
- 5.2.2. Protein Interface Analysis
- 5.2.3. Antibody Characterization and Development
- 5.2.4. Protein Complex and Cascade Analysis
- 5.2.5. Other Applications
- 5.3. Market Analysis, Insights and Forecast - by End User
- 5.3.1. Contract Research Organizations
- 5.3.2. Agricultural Research Institutes
- 5.3.3. R&D Laboratories
- 5.3.4. Other End Users
- 5.4. Market Analysis, Insights and Forecast - by Region
- 5.4.1. North America
- 5.4.2. Europe
- 5.4.3. Asia Pacific
- 5.4.4. Middle East
- 5.4.5. GCC
- 5.4.6. South America
- 5.1. Market Analysis, Insights and Forecast - by Technology
- 6. North America Label-free Array Systems Market Analysis, Insights and Forecast, 2019-2031
- 6.1. Market Analysis, Insights and Forecast - by Technology
- 6.1.1. Surface Plasmon Resonance
- 6.1.2. Bio Layer Interferometry
- 6.1.3. Cellular Dielectric Spectroscopy
- 6.1.4. Other Technologies
- 6.2. Market Analysis, Insights and Forecast - by Application
- 6.2.1. Drug Discovery
- 6.2.2. Protein Interface Analysis
- 6.2.3. Antibody Characterization and Development
- 6.2.4. Protein Complex and Cascade Analysis
- 6.2.5. Other Applications
- 6.3. Market Analysis, Insights and Forecast - by End User
- 6.3.1. Contract Research Organizations
- 6.3.2. Agricultural Research Institutes
- 6.3.3. R&D Laboratories
- 6.3.4. Other End Users
- 6.1. Market Analysis, Insights and Forecast - by Technology
- 7. Europe Label-free Array Systems Market Analysis, Insights and Forecast, 2019-2031
- 7.1. Market Analysis, Insights and Forecast - by Technology
- 7.1.1. Surface Plasmon Resonance
- 7.1.2. Bio Layer Interferometry
- 7.1.3. Cellular Dielectric Spectroscopy
- 7.1.4. Other Technologies
- 7.2. Market Analysis, Insights and Forecast - by Application
- 7.2.1. Drug Discovery
- 7.2.2. Protein Interface Analysis
- 7.2.3. Antibody Characterization and Development
- 7.2.4. Protein Complex and Cascade Analysis
- 7.2.5. Other Applications
- 7.3. Market Analysis, Insights and Forecast - by End User
- 7.3.1. Contract Research Organizations
- 7.3.2. Agricultural Research Institutes
- 7.3.3. R&D Laboratories
- 7.3.4. Other End Users
- 7.1. Market Analysis, Insights and Forecast - by Technology
- 8. Asia Pacific Label-free Array Systems Market Analysis, Insights and Forecast, 2019-2031
- 8.1. Market Analysis, Insights and Forecast - by Technology
- 8.1.1. Surface Plasmon Resonance
- 8.1.2. Bio Layer Interferometry
- 8.1.3. Cellular Dielectric Spectroscopy
- 8.1.4. Other Technologies
- 8.2. Market Analysis, Insights and Forecast - by Application
- 8.2.1. Drug Discovery
- 8.2.2. Protein Interface Analysis
- 8.2.3. Antibody Characterization and Development
- 8.2.4. Protein Complex and Cascade Analysis
- 8.2.5. Other Applications
- 8.3. Market Analysis, Insights and Forecast - by End User
- 8.3.1. Contract Research Organizations
- 8.3.2. Agricultural Research Institutes
- 8.3.3. R&D Laboratories
- 8.3.4. Other End Users
- 8.1. Market Analysis, Insights and Forecast - by Technology
- 9. Middle East Label-free Array Systems Market Analysis, Insights and Forecast, 2019-2031
- 9.1. Market Analysis, Insights and Forecast - by Technology
- 9.1.1. Surface Plasmon Resonance
- 9.1.2. Bio Layer Interferometry
- 9.1.3. Cellular Dielectric Spectroscopy
- 9.1.4. Other Technologies
- 9.2. Market Analysis, Insights and Forecast - by Application
- 9.2.1. Drug Discovery
- 9.2.2. Protein Interface Analysis
- 9.2.3. Antibody Characterization and Development
- 9.2.4. Protein Complex and Cascade Analysis
- 9.2.5. Other Applications
- 9.3. Market Analysis, Insights and Forecast - by End User
- 9.3.1. Contract Research Organizations
- 9.3.2. Agricultural Research Institutes
- 9.3.3. R&D Laboratories
- 9.3.4. Other End Users
- 9.1. Market Analysis, Insights and Forecast - by Technology
- 10. GCC Label-free Array Systems Market Analysis, Insights and Forecast, 2019-2031
- 10.1. Market Analysis, Insights and Forecast - by Technology
- 10.1.1. Surface Plasmon Resonance
- 10.1.2. Bio Layer Interferometry
- 10.1.3. Cellular Dielectric Spectroscopy
- 10.1.4. Other Technologies
- 10.2. Market Analysis, Insights and Forecast - by Application
- 10.2.1. Drug Discovery
- 10.2.2. Protein Interface Analysis
- 10.2.3. Antibody Characterization and Development
- 10.2.4. Protein Complex and Cascade Analysis
- 10.2.5. Other Applications
- 10.3. Market Analysis, Insights and Forecast - by End User
- 10.3.1. Contract Research Organizations
- 10.3.2. Agricultural Research Institutes
- 10.3.3. R&D Laboratories
- 10.3.4. Other End Users
- 10.1. Market Analysis, Insights and Forecast - by Technology
- 11. South America Label-free Array Systems Market Analysis, Insights and Forecast, 2019-2031
- 11.1. Market Analysis, Insights and Forecast - by Technology
- 11.1.1. Surface Plasmon Resonance
- 11.1.2. Bio Layer Interferometry
- 11.1.3. Cellular Dielectric Spectroscopy
- 11.1.4. Other Technologies
- 11.2. Market Analysis, Insights and Forecast - by Application
- 11.2.1. Drug Discovery
- 11.2.2. Protein Interface Analysis
- 11.2.3. Antibody Characterization and Development
- 11.2.4. Protein Complex and Cascade Analysis
- 11.2.5. Other Applications
- 11.3. Market Analysis, Insights and Forecast - by End User
- 11.3.1. Contract Research Organizations
- 11.3.2. Agricultural Research Institutes
- 11.3.3. R&D Laboratories
- 11.3.4. Other End Users
- 11.1. Market Analysis, Insights and Forecast - by Technology
- 12. North America Label-free Array Systems Market Analysis, Insights and Forecast, 2019-2031
- 12.1. Market Analysis, Insights and Forecast - By Country/Sub-region
- 12.1.1 United States
- 12.1.2 Canada
- 12.1.3 Mexico
- 13. Europe Label-free Array Systems Market Analysis, Insights and Forecast, 2019-2031
- 13.1. Market Analysis, Insights and Forecast - By Country/Sub-region
- 13.1.1 Germany
- 13.1.2 United Kingdom
- 13.1.3 France
- 13.1.4 Italy
- 13.1.5 Spain
- 13.1.6 Rest of Europe
- 14. Asia Pacific Label-free Array Systems Market Analysis, Insights and Forecast, 2019-2031
- 14.1. Market Analysis, Insights and Forecast - By Country/Sub-region
- 14.1.1 China
- 14.1.2 Japan
- 14.1.3 India
- 14.1.4 Australia
- 14.1.5 South Korea
- 14.1.6 Rest of Asia Pacific
- 15. Middle East Label-free Array Systems Market Analysis, Insights and Forecast, 2019-2031
- 15.1. Market Analysis, Insights and Forecast - By Country/Sub-region
- 15.1.1.
- 16. GCC Label-free Array Systems Market Analysis, Insights and Forecast, 2019-2031
- 16.1. Market Analysis, Insights and Forecast - By Country/Sub-region
- 16.1.1 South Africa
- 16.1.2 Rest of Middle East
- 17. South America Label-free Array Systems Market Analysis, Insights and Forecast, 2019-2031
- 17.1. Market Analysis, Insights and Forecast - By Country/Sub-region
- 17.1.1 Brazil
- 17.1.2 Argentina
- 17.1.3 Rest of South America
- 18. Competitive Analysis
- 18.1. Global Market Share Analysis 2024
- 18.2. Company Profiles
- 18.2.1 Fluiditic Analytics
- 18.2.1.1. Overview
- 18.2.1.2. Products
- 18.2.1.3. SWOT Analysis
- 18.2.1.4. Recent Developments
- 18.2.1.5. Financials (Based on Availability)
- 18.2.2 PerkinElmer
- 18.2.2.1. Overview
- 18.2.2.2. Products
- 18.2.2.3. SWOT Analysis
- 18.2.2.4. Recent Developments
- 18.2.2.5. Financials (Based on Availability)
- 18.2.3 Danaher Corporation (Molecular Devices LLC - FORTEBIO)
- 18.2.3.1. Overview
- 18.2.3.2. Products
- 18.2.3.3. SWOT Analysis
- 18.2.3.4. Recent Developments
- 18.2.3.5. Financials (Based on Availability)
- 18.2.4 GE Healthcare
- 18.2.4.1. Overview
- 18.2.4.2. Products
- 18.2.4.3. SWOT Analysis
- 18.2.4.4. Recent Developments
- 18.2.4.5. Financials (Based on Availability)
- 18.2.5 Eppendorf AG
- 18.2.5.1. Overview
- 18.2.5.2. Products
- 18.2.5.3. SWOT Analysis
- 18.2.5.4. Recent Developments
- 18.2.5.5. Financials (Based on Availability)
- 18.2.6 ThermoFisher Scientific
- 18.2.6.1. Overview
- 18.2.6.2. Products
- 18.2.6.3. SWOT Analysis
- 18.2.6.4. Recent Developments
- 18.2.6.5. Financials (Based on Availability)
- 18.2.7 Bio-rad Laboratories
- 18.2.7.1. Overview
- 18.2.7.2. Products
- 18.2.7.3. SWOT Analysis
- 18.2.7.4. Recent Developments
- 18.2.7.5. Financials (Based on Availability)
- 18.2.8 Bruker Corporation
- 18.2.8.1. Overview
- 18.2.8.2. Products
- 18.2.8.3. SWOT Analysis
- 18.2.8.4. Recent Developments
- 18.2.8.5. Financials (Based on Availability)
- 18.2.9 Corning Incorporated
- 18.2.9.1. Overview
- 18.2.9.2. Products
- 18.2.9.3. SWOT Analysis
- 18.2.9.4. Recent Developments
- 18.2.9.5. Financials (Based on Availability)
- 18.2.10 Shimadzu Corporation
- 18.2.10.1. Overview
- 18.2.10.2. Products
- 18.2.10.3. SWOT Analysis
- 18.2.10.4. Recent Developments
- 18.2.10.5. Financials (Based on Availability)
- 18.2.1 Fluiditic Analytics
List of Figures
- Figure 1: Global Label-free Array Systems Market Revenue Breakdown (Million, %) by Region 2024 & 2032
- Figure 2: North America Label-free Array Systems Market Revenue (Million), by Country 2024 & 2032
- Figure 3: North America Label-free Array Systems Market Revenue Share (%), by Country 2024 & 2032
- Figure 4: Europe Label-free Array Systems Market Revenue (Million), by Country 2024 & 2032
- Figure 5: Europe Label-free Array Systems Market Revenue Share (%), by Country 2024 & 2032
- Figure 6: Asia Pacific Label-free Array Systems Market Revenue (Million), by Country 2024 & 2032
- Figure 7: Asia Pacific Label-free Array Systems Market Revenue Share (%), by Country 2024 & 2032
- Figure 8: Middle East Label-free Array Systems Market Revenue (Million), by Country 2024 & 2032
- Figure 9: Middle East Label-free Array Systems Market Revenue Share (%), by Country 2024 & 2032
- Figure 10: GCC Label-free Array Systems Market Revenue (Million), by Country 2024 & 2032
- Figure 11: GCC Label-free Array Systems Market Revenue Share (%), by Country 2024 & 2032
- Figure 12: South America Label-free Array Systems Market Revenue (Million), by Country 2024 & 2032
- Figure 13: South America Label-free Array Systems Market Revenue Share (%), by Country 2024 & 2032
- Figure 14: North America Label-free Array Systems Market Revenue (Million), by Technology 2024 & 2032
- Figure 15: North America Label-free Array Systems Market Revenue Share (%), by Technology 2024 & 2032
- Figure 16: North America Label-free Array Systems Market Revenue (Million), by Application 2024 & 2032
- Figure 17: North America Label-free Array Systems Market Revenue Share (%), by Application 2024 & 2032
- Figure 18: North America Label-free Array Systems Market Revenue (Million), by End User 2024 & 2032
- Figure 19: North America Label-free Array Systems Market Revenue Share (%), by End User 2024 & 2032
- Figure 20: North America Label-free Array Systems Market Revenue (Million), by Country 2024 & 2032
- Figure 21: North America Label-free Array Systems Market Revenue Share (%), by Country 2024 & 2032
- Figure 22: Europe Label-free Array Systems Market Revenue (Million), by Technology 2024 & 2032
- Figure 23: Europe Label-free Array Systems Market Revenue Share (%), by Technology 2024 & 2032
- Figure 24: Europe Label-free Array Systems Market Revenue (Million), by Application 2024 & 2032
- Figure 25: Europe Label-free Array Systems Market Revenue Share (%), by Application 2024 & 2032
- Figure 26: Europe Label-free Array Systems Market Revenue (Million), by End User 2024 & 2032
- Figure 27: Europe Label-free Array Systems Market Revenue Share (%), by End User 2024 & 2032
- Figure 28: Europe Label-free Array Systems Market Revenue (Million), by Country 2024 & 2032
- Figure 29: Europe Label-free Array Systems Market Revenue Share (%), by Country 2024 & 2032
- Figure 30: Asia Pacific Label-free Array Systems Market Revenue (Million), by Technology 2024 & 2032
- Figure 31: Asia Pacific Label-free Array Systems Market Revenue Share (%), by Technology 2024 & 2032
- Figure 32: Asia Pacific Label-free Array Systems Market Revenue (Million), by Application 2024 & 2032
- Figure 33: Asia Pacific Label-free Array Systems Market Revenue Share (%), by Application 2024 & 2032
- Figure 34: Asia Pacific Label-free Array Systems Market Revenue (Million), by End User 2024 & 2032
- Figure 35: Asia Pacific Label-free Array Systems Market Revenue Share (%), by End User 2024 & 2032
- Figure 36: Asia Pacific Label-free Array Systems Market Revenue (Million), by Country 2024 & 2032
- Figure 37: Asia Pacific Label-free Array Systems Market Revenue Share (%), by Country 2024 & 2032
- Figure 38: Middle East Label-free Array Systems Market Revenue (Million), by Technology 2024 & 2032
- Figure 39: Middle East Label-free Array Systems Market Revenue Share (%), by Technology 2024 & 2032
- Figure 40: Middle East Label-free Array Systems Market Revenue (Million), by Application 2024 & 2032
- Figure 41: Middle East Label-free Array Systems Market Revenue Share (%), by Application 2024 & 2032
- Figure 42: Middle East Label-free Array Systems Market Revenue (Million), by End User 2024 & 2032
- Figure 43: Middle East Label-free Array Systems Market Revenue Share (%), by End User 2024 & 2032
- Figure 44: Middle East Label-free Array Systems Market Revenue (Million), by Country 2024 & 2032
- Figure 45: Middle East Label-free Array Systems Market Revenue Share (%), by Country 2024 & 2032
- Figure 46: GCC Label-free Array Systems Market Revenue (Million), by Technology 2024 & 2032
- Figure 47: GCC Label-free Array Systems Market Revenue Share (%), by Technology 2024 & 2032
- Figure 48: GCC Label-free Array Systems Market Revenue (Million), by Application 2024 & 2032
- Figure 49: GCC Label-free Array Systems Market Revenue Share (%), by Application 2024 & 2032
- Figure 50: GCC Label-free Array Systems Market Revenue (Million), by End User 2024 & 2032
- Figure 51: GCC Label-free Array Systems Market Revenue Share (%), by End User 2024 & 2032
- Figure 52: GCC Label-free Array Systems Market Revenue (Million), by Country 2024 & 2032
- Figure 53: GCC Label-free Array Systems Market Revenue Share (%), by Country 2024 & 2032
- Figure 54: South America Label-free Array Systems Market Revenue (Million), by Technology 2024 & 2032
- Figure 55: South America Label-free Array Systems Market Revenue Share (%), by Technology 2024 & 2032
- Figure 56: South America Label-free Array Systems Market Revenue (Million), by Application 2024 & 2032
- Figure 57: South America Label-free Array Systems Market Revenue Share (%), by Application 2024 & 2032
- Figure 58: South America Label-free Array Systems Market Revenue (Million), by End User 2024 & 2032
- Figure 59: South America Label-free Array Systems Market Revenue Share (%), by End User 2024 & 2032
- Figure 60: South America Label-free Array Systems Market Revenue (Million), by Country 2024 & 2032
- Figure 61: South America Label-free Array Systems Market Revenue Share (%), by Country 2024 & 2032
List of Tables
- Table 1: Global Label-free Array Systems Market Revenue Million Forecast, by Region 2019 & 2032
- Table 2: Global Label-free Array Systems Market Revenue Million Forecast, by Technology 2019 & 2032
- Table 3: Global Label-free Array Systems Market Revenue Million Forecast, by Application 2019 & 2032
- Table 4: Global Label-free Array Systems Market Revenue Million Forecast, by End User 2019 & 2032
- Table 5: Global Label-free Array Systems Market Revenue Million Forecast, by Region 2019 & 2032
- Table 6: Global Label-free Array Systems Market Revenue Million Forecast, by Country 2019 & 2032
- Table 7: United States Label-free Array Systems Market Revenue (Million) Forecast, by Application 2019 & 2032
- Table 8: Canada Label-free Array Systems Market Revenue (Million) Forecast, by Application 2019 & 2032
- Table 9: Mexico Label-free Array Systems Market Revenue (Million) Forecast, by Application 2019 & 2032
- Table 10: Global Label-free Array Systems Market Revenue Million Forecast, by Country 2019 & 2032
- Table 11: Germany Label-free Array Systems Market Revenue (Million) Forecast, by Application 2019 & 2032
- Table 12: United Kingdom Label-free Array Systems Market Revenue (Million) Forecast, by Application 2019 & 2032
- Table 13: France Label-free Array Systems Market Revenue (Million) Forecast, by Application 2019 & 2032
- Table 14: Italy Label-free Array Systems Market Revenue (Million) Forecast, by Application 2019 & 2032
- Table 15: Spain Label-free Array Systems Market Revenue (Million) Forecast, by Application 2019 & 2032
- Table 16: Rest of Europe Label-free Array Systems Market Revenue (Million) Forecast, by Application 2019 & 2032
- Table 17: Global Label-free Array Systems Market Revenue Million Forecast, by Country 2019 & 2032
- Table 18: China Label-free Array Systems Market Revenue (Million) Forecast, by Application 2019 & 2032
- Table 19: Japan Label-free Array Systems Market Revenue (Million) Forecast, by Application 2019 & 2032
- Table 20: India Label-free Array Systems Market Revenue (Million) Forecast, by Application 2019 & 2032
- Table 21: Australia Label-free Array Systems Market Revenue (Million) Forecast, by Application 2019 & 2032
- Table 22: South Korea Label-free Array Systems Market Revenue (Million) Forecast, by Application 2019 & 2032
- Table 23: Rest of Asia Pacific Label-free Array Systems Market Revenue (Million) Forecast, by Application 2019 & 2032
- Table 24: Global Label-free Array Systems Market Revenue Million Forecast, by Country 2019 & 2032
- Table 25: Label-free Array Systems Market Revenue (Million) Forecast, by Application 2019 & 2032
- Table 26: Global Label-free Array Systems Market Revenue Million Forecast, by Country 2019 & 2032
- Table 27: South Africa Label-free Array Systems Market Revenue (Million) Forecast, by Application 2019 & 2032
- Table 28: Rest of Middle East Label-free Array Systems Market Revenue (Million) Forecast, by Application 2019 & 2032
- Table 29: Global Label-free Array Systems Market Revenue Million Forecast, by Country 2019 & 2032
- Table 30: Brazil Label-free Array Systems Market Revenue (Million) Forecast, by Application 2019 & 2032
- Table 31: Argentina Label-free Array Systems Market Revenue (Million) Forecast, by Application 2019 & 2032
- Table 32: Rest of South America Label-free Array Systems Market Revenue (Million) Forecast, by Application 2019 & 2032
- Table 33: Global Label-free Array Systems Market Revenue Million Forecast, by Technology 2019 & 2032
- Table 34: Global Label-free Array Systems Market Revenue Million Forecast, by Application 2019 & 2032
- Table 35: Global Label-free Array Systems Market Revenue Million Forecast, by End User 2019 & 2032
- Table 36: Global Label-free Array Systems Market Revenue Million Forecast, by Country 2019 & 2032
- Table 37: United States Label-free Array Systems Market Revenue (Million) Forecast, by Application 2019 & 2032
- Table 38: Canada Label-free Array Systems Market Revenue (Million) Forecast, by Application 2019 & 2032
- Table 39: Mexico Label-free Array Systems Market Revenue (Million) Forecast, by Application 2019 & 2032
- Table 40: Global Label-free Array Systems Market Revenue Million Forecast, by Technology 2019 & 2032
- Table 41: Global Label-free Array Systems Market Revenue Million Forecast, by Application 2019 & 2032
- Table 42: Global Label-free Array Systems Market Revenue Million Forecast, by End User 2019 & 2032
- Table 43: Global Label-free Array Systems Market Revenue Million Forecast, by Country 2019 & 2032
- Table 44: Germany Label-free Array Systems Market Revenue (Million) Forecast, by Application 2019 & 2032
- Table 45: United Kingdom Label-free Array Systems Market Revenue (Million) Forecast, by Application 2019 & 2032
- Table 46: France Label-free Array Systems Market Revenue (Million) Forecast, by Application 2019 & 2032
- Table 47: Italy Label-free Array Systems Market Revenue (Million) Forecast, by Application 2019 & 2032
- Table 48: Spain Label-free Array Systems Market Revenue (Million) Forecast, by Application 2019 & 2032
- Table 49: Rest of Europe Label-free Array Systems Market Revenue (Million) Forecast, by Application 2019 & 2032
- Table 50: Global Label-free Array Systems Market Revenue Million Forecast, by Technology 2019 & 2032
- Table 51: Global Label-free Array Systems Market Revenue Million Forecast, by Application 2019 & 2032
- Table 52: Global Label-free Array Systems Market Revenue Million Forecast, by End User 2019 & 2032
- Table 53: Global Label-free Array Systems Market Revenue Million Forecast, by Country 2019 & 2032
- Table 54: China Label-free Array Systems Market Revenue (Million) Forecast, by Application 2019 & 2032
- Table 55: Japan Label-free Array Systems Market Revenue (Million) Forecast, by Application 2019 & 2032
- Table 56: India Label-free Array Systems Market Revenue (Million) Forecast, by Application 2019 & 2032
- Table 57: Australia Label-free Array Systems Market Revenue (Million) Forecast, by Application 2019 & 2032
- Table 58: South Korea Label-free Array Systems Market Revenue (Million) Forecast, by Application 2019 & 2032
- Table 59: Rest of Asia Pacific Label-free Array Systems Market Revenue (Million) Forecast, by Application 2019 & 2032
- Table 60: Global Label-free Array Systems Market Revenue Million Forecast, by Technology 2019 & 2032
- Table 61: Global Label-free Array Systems Market Revenue Million Forecast, by Application 2019 & 2032
- Table 62: Global Label-free Array Systems Market Revenue Million Forecast, by End User 2019 & 2032
- Table 63: Global Label-free Array Systems Market Revenue Million Forecast, by Country 2019 & 2032
- Table 64: Global Label-free Array Systems Market Revenue Million Forecast, by Technology 2019 & 2032
- Table 65: Global Label-free Array Systems Market Revenue Million Forecast, by Application 2019 & 2032
- Table 66: Global Label-free Array Systems Market Revenue Million Forecast, by End User 2019 & 2032
- Table 67: Global Label-free Array Systems Market Revenue Million Forecast, by Country 2019 & 2032
- Table 68: South Africa Label-free Array Systems Market Revenue (Million) Forecast, by Application 2019 & 2032
- Table 69: Rest of Middle East Label-free Array Systems Market Revenue (Million) Forecast, by Application 2019 & 2032
- Table 70: Global Label-free Array Systems Market Revenue Million Forecast, by Technology 2019 & 2032
- Table 71: Global Label-free Array Systems Market Revenue Million Forecast, by Application 2019 & 2032
- Table 72: Global Label-free Array Systems Market Revenue Million Forecast, by End User 2019 & 2032
- Table 73: Global Label-free Array Systems Market Revenue Million Forecast, by Country 2019 & 2032
- Table 74: Brazil Label-free Array Systems Market Revenue (Million) Forecast, by Application 2019 & 2032
- Table 75: Argentina Label-free Array Systems Market Revenue (Million) Forecast, by Application 2019 & 2032
- Table 76: Rest of South America Label-free Array Systems Market Revenue (Million) Forecast, by Application 2019 & 2032
Frequently Asked Questions
1. What is the projected Compound Annual Growth Rate (CAGR) of the Label-free Array Systems Market?
The projected CAGR is approximately 6.20%.
2. Which companies are prominent players in the Label-free Array Systems Market?
Key companies in the market include Fluiditic Analytics, PerkinElmer, Danaher Corporation (Molecular Devices LLC - FORTEBIO), GE Healthcare, Eppendorf AG, ThermoFisher Scientific, Bio-rad Laboratories, Bruker Corporation, Corning Incorporated, Shimadzu Corporation.
3. What are the main segments of the Label-free Array Systems Market?
The market segments include Technology, Application, End User.
4. Can you provide details about the market size?
The market size is estimated to be USD XX Million as of 2022.
5. What are some drivers contributing to market growth?
; Advantages over Labeled Detection Techniques; Increase in the R&D Expenditure of Pharmaceutical and Biotechnology Companies; Technological Advancements in Label-free Technologies.
6. What are the notable trends driving market growth?
The Surface Plasmon Resonance Technology Segment is Expected to the Exhibit the Fastest Growth During the Forecast Period.
7. Are there any restraints impacting market growth?
; High Instrumentation Costs; Lack of Awareness.
8. Can you provide examples of recent developments in the market?
N/A
9. What pricing options are available for accessing the report?
Pricing options include single-user, multi-user, and enterprise licenses priced at USD 4750, USD 5250, and USD 8750 respectively.
10. Is the market size provided in terms of value or volume?
The market size is provided in terms of value, measured in Million.
11. Are there any specific market keywords associated with the report?
Yes, the market keyword associated with the report is "Label-free Array Systems Market," which aids in identifying and referencing the specific market segment covered.
12. How do I determine which pricing option suits my needs best?
The pricing options vary based on user requirements and access needs. Individual users may opt for single-user licenses, while businesses requiring broader access may choose multi-user or enterprise licenses for cost-effective access to the report.
13. Are there any additional resources or data provided in the Label-free Array Systems Market report?
While the report offers comprehensive insights, it's advisable to review the specific contents or supplementary materials provided to ascertain if additional resources or data are available.
14. How can I stay updated on further developments or reports in the Label-free Array Systems Market?
To stay informed about further developments, trends, and reports in the Label-free Array Systems Market, consider subscribing to industry newsletters, following relevant companies and organizations, or regularly checking reputable industry news sources and publications.
Methodology
Step 1 - Identification of Relevant Samples Size from Population Database


Step 2 - Approaches for Defining Global Market Size (Value, Volume* & Price*)

Note*: In applicable scenarios
Step 3 - Data Sources
Primary Research
- Web Analytics
- Survey Reports
- Research Institute
- Latest Research Reports
- Opinion Leaders
Secondary Research
- Annual Reports
- White Paper
- Latest Press Release
- Industry Association
- Paid Database
- Investor Presentations

Step 4 - Data Triangulation
Involves using different sources of information in order to increase the validity of a study
These sources are likely to be stakeholders in a program - participants, other researchers, program staff, other community members, and so on.
Then we put all data in single framework & apply various statistical tools to find out the dynamic on the market.
During the analysis stage, feedback from the stakeholder groups would be compared to determine areas of agreement as well as areas of divergence
