

Key Insights
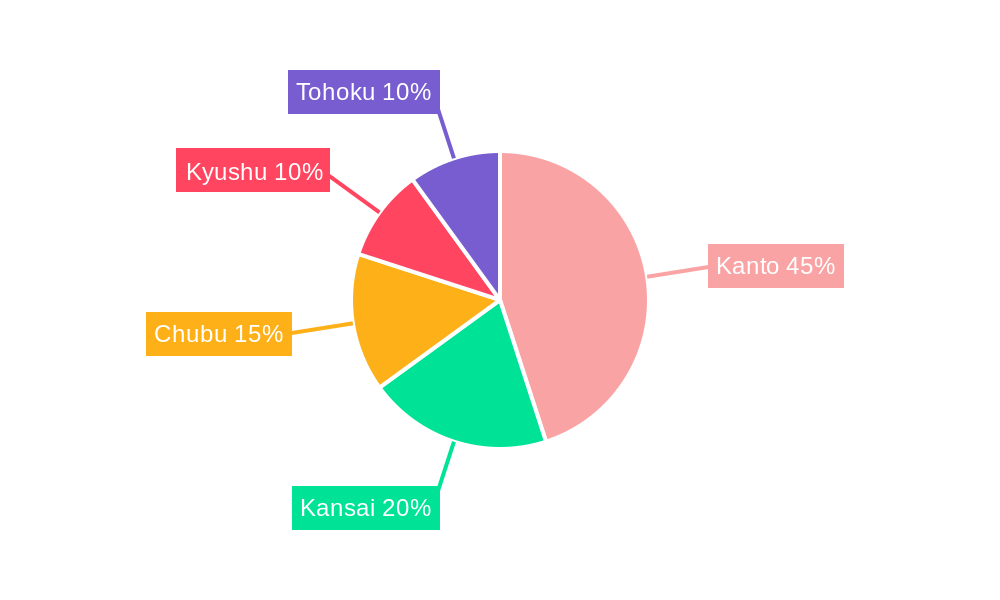
The Japanese Magnetic Resonance Imaging (MRI) market, valued at $668.09 million in 2025, is projected to experience robust growth, driven by a compound annual growth rate (CAGR) of 5.65% from 2025 to 2033. This expansion is fueled by several key factors. Technological advancements, including the development of higher-field strength MRI systems (High Field, Very High Field, and Ultra-high Field) offering improved image quality and diagnostic capabilities, are a primary driver. The rising prevalence of chronic diseases like cardiovascular conditions, neurological disorders, and cancer, necessitating advanced diagnostic imaging, significantly contributes to market growth. Furthermore, increasing government initiatives promoting healthcare infrastructure development and investments in advanced medical technology within Japan further stimulate demand. The aging population in Japan also plays a crucial role, as older individuals often require more frequent MRI scans. Segment-wise, high-field MRI systems are expected to dominate due to their superior image resolution. Within applications, oncology, neurology, and cardiology are likely to remain the largest segments, mirroring global trends. However, growth in musculoskeletal and gastroenterology applications is anticipated to be particularly strong due to the increasing prevalence of related conditions in Japan. Competition within the market is intense, with both domestic and international players such as Siemens Healthineers, GE Healthcare, and Canon Medical Systems Corporation vying for market share. Regional variations in market penetration exist, with the Kanto region (Tokyo and surrounding areas) expected to maintain a significant lead due to its higher population density and concentration of healthcare facilities.
The MRI market in Japan faces some challenges, albeit modest. Cost constraints associated with high-field MRI systems and the ongoing need for skilled professionals to operate and interpret the complex imaging data could potentially restrain growth to some degree. However, the overall positive trajectory suggests that the market's expansion will continue to outpace these challenges. Ongoing research and development efforts focusing on improved image processing techniques, artificial intelligence integration for faster and more accurate diagnosis, and more patient-friendly systems (e.g., open MRI systems) will likely further enhance market prospects. The continued focus on preventative healthcare and earlier disease detection in Japan further supports a positive outlook for the MRI market over the next decade.

Dynamic SEO-Optimized Report Description: Magnetic Resonance Imaging (MRI) Market in Japan (2019-2033)
This comprehensive report offers an in-depth analysis of the Magnetic Resonance Imaging (MRI) market in Japan, covering the period 2019-2033. It provides invaluable insights for stakeholders, including manufacturers, distributors, investors, and healthcare providers, seeking to understand the market's dynamics, growth potential, and competitive landscape. The report leverages extensive data analysis and industry expertise to deliver actionable intelligence, focusing on market size, segmentation, key players, and future trends. The Japanese MRI market is poised for significant growth, driven by technological advancements, increasing prevalence of chronic diseases, and government initiatives promoting healthcare infrastructure development. This report is a must-have for anyone navigating this dynamic and evolving market.
Magnetic Resonance Imaging Market in Japan Market Structure & Competitive Landscape
The Japanese MRI market presents a moderately concentrated competitive landscape, with a mix of established global and domestic players vying for market share. While the precise Herfindahl-Hirschman Index (HHI) for 2024 requires further specification (replace "xx" with the actual value), the market's moderately competitive nature is evident. Key drivers of innovation include the ongoing development of high-field strength MRI systems offering superior image resolution and speed, the adoption of advanced imaging techniques such as functional MRI (fMRI), diffusion tensor imaging (DTI), and perfusion imaging, and the increasing integration of AI-powered image analysis tools to enhance diagnostic accuracy and workflow efficiency. The stringent regulatory approval process overseen by the Japanese Ministry of Health, Labour and Welfare (MHLW) significantly influences market entry and the pace of product adoption. Furthermore, the market faces competitive pressure from substitute technologies, primarily computed tomography (CT) scans, although MRI remains indispensable for specific diagnostic applications requiring superior soft tissue contrast and anatomical detail.
Market segmentation by end-user reveals a diverse landscape encompassing hospitals, specialized clinics, dedicated diagnostic imaging centers, and research institutions. While mergers and acquisitions (M&A) activity has been relatively subdued in recent years, with a recorded value of xx Million USD in 2024 (replace "xx" with the actual value), strategic partnerships and collaborative ventures are gaining momentum, facilitating technology transfer, market expansion, and the development of innovative solutions. This collaborative approach is proving more prevalent than outright acquisitions.
- Market Concentration: Moderately concentrated, HHI (2024): [Insert Actual HHI Value]
- Innovation Drivers: High-field MRI, advanced imaging techniques (fMRI, DTI, perfusion), AI-powered image analysis, improved workflow efficiency.
- Regulatory Impacts: Stringent MHLW approvals, influencing market access and product launch timelines.
- Product Substitutes: CT scans, posing competitive pressure in certain applications.
- End-User Segmentation: Hospitals, clinics, diagnostic centers, research institutions, private practices.
- M&A & Partnership Trends: Low M&A volume ([Insert Actual Value] Million USD in 2024), increasing strategic partnerships and collaborations.
Magnetic Resonance Imaging Market in Japan Market Trends & Opportunities
The Japanese MRI market experienced a compound annual growth rate (CAGR) of xx% during the historical period (2019-2024), reaching a market value of xx Million USD in 2024. This growth is projected to continue at a CAGR of xx% during the forecast period (2025-2033), reaching xx Million USD by 2033. Technological advancements, such as the development of faster scan times, improved image quality, and increased accessibility of MRI systems, are driving market expansion. Consumer preferences are shifting towards minimally invasive procedures and accurate diagnostic tools, boosting demand for MRI services. The competitive landscape is characterized by both intense rivalry among established players and the emergence of new entrants with innovative technologies. Market penetration rates for MRI within specific healthcare settings (e.g., hospitals in metropolitan areas) remain relatively high, while there is considerable scope for increased penetration in rural areas and specialized clinics.

Dominant Markets & Segments in Magnetic Resonance Imaging Market in Japan
The Kanto region dominates the Japanese MRI market, driven by a high concentration of hospitals and diagnostic centers, alongside a robust healthcare infrastructure. Within the segmentation, high-field MRI systems (1.5T and 3T) hold the largest market share due to their superior image quality and diagnostic capabilities. The oncology and neurology applications are the key revenue generators due to the high prevalence of cancer and neurological disorders in Japan.
Key Growth Drivers:
- Strong Healthcare Infrastructure: Advanced medical facilities and skilled professionals are present, particularly in urban areas.
- High Prevalence of Chronic Diseases: Increased incidence of cancer, neurological disorders, and cardiovascular diseases drives demand.
- Government Initiatives: Investments in healthcare infrastructure and technological upgrades support market growth.
Market Dominance Analysis:
The high-field MRI segment's dominance stems from its superior image quality, crucial for complex diagnoses. Similarly, oncology and neurology applications drive significant market value due to the high prevalence of these conditions. The Kanto region’s dominance reflects the concentration of advanced medical facilities in the area.
Magnetic Resonance Imaging Market in Japan Product Analysis
Recent product innovations in the Japanese MRI market include faster scan times, improved image quality, and the incorporation of AI-powered image analysis. Open MRI systems are gaining traction due to their patient-friendly design, while ultra-high field systems are increasingly utilized for specialized research applications. These technological advancements enhance diagnostic accuracy, patient comfort, and overall workflow efficiency, making MRI systems more competitive against alternative imaging modalities.
Key Drivers, Barriers & Challenges in Magnetic Resonance Imaging Market in Japan
Key Drivers:
- Technological advancements like AI-powered image analysis, faster scan times, and improved image quality.
- Increasing prevalence of chronic diseases necessitating advanced diagnostics.
- Government initiatives promoting improved healthcare infrastructure and technological adoption.
Challenges and Restraints:
- High initial investment costs for MRI systems pose a significant barrier for smaller clinics and hospitals.
- Stringent regulatory approvals from the MHLW can delay product launches.
- Competition from alternative imaging techniques like CT scans impacts market growth. The estimated impact of regulatory hurdles on market growth is xx% in the next 5 years.
Growth Drivers in the Magnetic Resonance Imaging Market in Japan Market
The Japanese MRI market's expansion is fueled by a confluence of factors. Technological advancements, resulting in improved image quality, faster scan times, and enhanced diagnostic capabilities, are a primary driver. The rising prevalence of chronic diseases, such as cardiovascular disease, cancer, and neurological disorders, necessitates increased diagnostic capacity, directly benefiting the MRI market. Furthermore, supportive government policies and investments in healthcare infrastructure, aimed at enhancing healthcare accessibility and quality, contribute significantly to market growth. These investments often include upgrading existing facilities and expanding access to advanced diagnostic imaging technologies like MRI in underserved areas.
Challenges Impacting Magnetic Resonance Imaging Market in Japan Growth
Despite the positive growth trajectory, the Japanese MRI market encounters several challenges. The high capital investment required for purchasing and maintaining MRI systems presents a significant barrier to entry for smaller facilities and clinics, limiting wider adoption. The stringent regulatory approval process imposed by the MHLW can lead to delays in product launches and market entry for new technologies. Intense competition from established players, coupled with the presence of substitute technologies such as CT scans and other advanced imaging modalities, creates a highly dynamic and competitive market environment. The ongoing evolution of imaging technology also necessitates continuous investments in upgrades and new system acquisitions to maintain competitiveness and offer patients access to the most advanced diagnostic capabilities. Lastly, reimbursement policies and healthcare spending constraints can influence the affordability and accessibility of MRI services.
Key Players Shaping the Magnetic Resonance Imaging Market in Japan Market
- Siemens Healthineers
- GE Healthcare
- Elekta AB
- Neusoft Medical Systems Co Ltd
- Koninklijke Philips NV
- Canon Medical Systems Corporation
- United Imaging Healthcare Co Ltd
- Fujifilm Holdings Corporation
- Shenzhen anke high-tech co ltd
- Esaote SpA
Significant Magnetic Resonance Imaging Market in Japan Industry Milestones
- December 2021: Canon Medical Systems Corp. signed a licensing agreement with Resoundant Inc. for MRE technology integration into new MRI systems.
- November 2021: Canon Medical launched the Vantage Fortian, a new open-bore 1.5T MRI system with advanced productivity features.
Future Outlook for Magnetic Resonance Imaging Market in Japan Market
The Japanese MRI market is poised for continued robust growth, driven by a combination of factors. Ongoing technological innovations will lead to the development of even more sophisticated MRI systems with enhanced capabilities. The increasing healthcare spending, fueled by an aging population and rising prevalence of chronic diseases, creates a strong demand for advanced diagnostic imaging services. Strategic partnerships and collaborative initiatives will play a crucial role in driving innovation and market expansion. Investments in research and development (R&D) will be vital for maintaining a competitive edge and ensuring access to the latest technologies. A key focus on patient-centric solutions, incorporating improved user experiences and streamlined workflows, will enhance the overall value proposition of MRI services. Significant opportunities exist in expanding MRI access to underserved regions, ensuring equitable access to advanced diagnostic care. The integration of AI-powered analytics into MRI workflows promises to improve diagnostic accuracy, efficiency, and overall patient outcomes. The continued evolution of MRI technology and its integration with other healthcare information systems will significantly shape the future of this dynamic market.
Magnetic Resonance Imaging Market in Japan Segmentation
-
1. Architecture
- 1.1. Closed MRI Systems
- 1.2. Open MRI Systems
-
2. Field Strength
- 2.1. Low Field MRI Systems
- 2.2. High Field MRI Systems
- 2.3. Very Hig
-
3. Application
- 3.1. Oncology
- 3.2. Neurology
- 3.3. Cardiology
- 3.4. Gastroenterology
- 3.5. Musculoskeletal
- 3.6. Other Applications
Magnetic Resonance Imaging Market in Japan Segmentation By Geography
-
1. North America
- 1.1. United States
- 1.2. Canada
- 1.3. Mexico
-
2. South America
- 2.1. Brazil
- 2.2. Argentina
- 2.3. Rest of South America
-
3. Europe
- 3.1. United Kingdom
- 3.2. Germany
- 3.3. France
- 3.4. Italy
- 3.5. Spain
- 3.6. Russia
- 3.7. Benelux
- 3.8. Nordics
- 3.9. Rest of Europe
-
4. Middle East & Africa
- 4.1. Turkey
- 4.2. Israel
- 4.3. GCC
- 4.4. North Africa
- 4.5. South Africa
- 4.6. Rest of Middle East & Africa
-
5. Asia Pacific
- 5.1. China
- 5.2. India
- 5.3. Japan
- 5.4. South Korea
- 5.5. ASEAN
- 5.6. Oceania
- 5.7. Rest of Asia Pacific
Magnetic Resonance Imaging Market in Japan REPORT HIGHLIGHTS
| Aspects | Details |
|---|---|
| Study Period | 2019-2033 |
| Base Year | 2024 |
| Estimated Year | 2025 |
| Forecast Period | 2025-2033 |
| Historical Period | 2019-2024 |
| Growth Rate | CAGR of 5.65% from 2019-2033 |
| Segmentation |
|
Table of Contents
- 1. Introduction
- 1.1. Research Scope
- 1.2. Market Segmentation
- 1.3. Research Methodology
- 1.4. Definitions and Assumptions
- 2. Executive Summary
- 2.1. Introduction
- 3. Market Dynamics
- 3.1. Introduction
- 3.2. Market Drivers
- 3.2.1. Introduction of Hybrid MRI Systems; Availability of Universal Health Coverage
- 3.3. Market Restrains
- 3.3.1. High Cost of MRI Systems
- 3.4. Market Trends
- 3.4.1. Oncology Segment is Expected to Witness Significant Growth in Future
- 4. Market Factor Analysis
- 4.1. Porters Five Forces
- 4.2. Supply/Value Chain
- 4.3. PESTEL analysis
- 4.4. Market Entropy
- 4.5. Patent/Trademark Analysis
- 5. Global Magnetic Resonance Imaging Market in Japan Analysis, Insights and Forecast, 2019-2031
- 5.1. Market Analysis, Insights and Forecast - by Architecture
- 5.1.1. Closed MRI Systems
- 5.1.2. Open MRI Systems
- 5.2. Market Analysis, Insights and Forecast - by Field Strength
- 5.2.1. Low Field MRI Systems
- 5.2.2. High Field MRI Systems
- 5.2.3. Very Hig
- 5.3. Market Analysis, Insights and Forecast - by Application
- 5.3.1. Oncology
- 5.3.2. Neurology
- 5.3.3. Cardiology
- 5.3.4. Gastroenterology
- 5.3.5. Musculoskeletal
- 5.3.6. Other Applications
- 5.4. Market Analysis, Insights and Forecast - by Region
- 5.4.1. North America
- 5.4.2. South America
- 5.4.3. Europe
- 5.4.4. Middle East & Africa
- 5.4.5. Asia Pacific
- 5.1. Market Analysis, Insights and Forecast - by Architecture
- 6. North America Magnetic Resonance Imaging Market in Japan Analysis, Insights and Forecast, 2019-2031
- 6.1. Market Analysis, Insights and Forecast - by Architecture
- 6.1.1. Closed MRI Systems
- 6.1.2. Open MRI Systems
- 6.2. Market Analysis, Insights and Forecast - by Field Strength
- 6.2.1. Low Field MRI Systems
- 6.2.2. High Field MRI Systems
- 6.2.3. Very Hig
- 6.3. Market Analysis, Insights and Forecast - by Application
- 6.3.1. Oncology
- 6.3.2. Neurology
- 6.3.3. Cardiology
- 6.3.4. Gastroenterology
- 6.3.5. Musculoskeletal
- 6.3.6. Other Applications
- 6.1. Market Analysis, Insights and Forecast - by Architecture
- 7. South America Magnetic Resonance Imaging Market in Japan Analysis, Insights and Forecast, 2019-2031
- 7.1. Market Analysis, Insights and Forecast - by Architecture
- 7.1.1. Closed MRI Systems
- 7.1.2. Open MRI Systems
- 7.2. Market Analysis, Insights and Forecast - by Field Strength
- 7.2.1. Low Field MRI Systems
- 7.2.2. High Field MRI Systems
- 7.2.3. Very Hig
- 7.3. Market Analysis, Insights and Forecast - by Application
- 7.3.1. Oncology
- 7.3.2. Neurology
- 7.3.3. Cardiology
- 7.3.4. Gastroenterology
- 7.3.5. Musculoskeletal
- 7.3.6. Other Applications
- 7.1. Market Analysis, Insights and Forecast - by Architecture
- 8. Europe Magnetic Resonance Imaging Market in Japan Analysis, Insights and Forecast, 2019-2031
- 8.1. Market Analysis, Insights and Forecast - by Architecture
- 8.1.1. Closed MRI Systems
- 8.1.2. Open MRI Systems
- 8.2. Market Analysis, Insights and Forecast - by Field Strength
- 8.2.1. Low Field MRI Systems
- 8.2.2. High Field MRI Systems
- 8.2.3. Very Hig
- 8.3. Market Analysis, Insights and Forecast - by Application
- 8.3.1. Oncology
- 8.3.2. Neurology
- 8.3.3. Cardiology
- 8.3.4. Gastroenterology
- 8.3.5. Musculoskeletal
- 8.3.6. Other Applications
- 8.1. Market Analysis, Insights and Forecast - by Architecture
- 9. Middle East & Africa Magnetic Resonance Imaging Market in Japan Analysis, Insights and Forecast, 2019-2031
- 9.1. Market Analysis, Insights and Forecast - by Architecture
- 9.1.1. Closed MRI Systems
- 9.1.2. Open MRI Systems
- 9.2. Market Analysis, Insights and Forecast - by Field Strength
- 9.2.1. Low Field MRI Systems
- 9.2.2. High Field MRI Systems
- 9.2.3. Very Hig
- 9.3. Market Analysis, Insights and Forecast - by Application
- 9.3.1. Oncology
- 9.3.2. Neurology
- 9.3.3. Cardiology
- 9.3.4. Gastroenterology
- 9.3.5. Musculoskeletal
- 9.3.6. Other Applications
- 9.1. Market Analysis, Insights and Forecast - by Architecture
- 10. Asia Pacific Magnetic Resonance Imaging Market in Japan Analysis, Insights and Forecast, 2019-2031
- 10.1. Market Analysis, Insights and Forecast - by Architecture
- 10.1.1. Closed MRI Systems
- 10.1.2. Open MRI Systems
- 10.2. Market Analysis, Insights and Forecast - by Field Strength
- 10.2.1. Low Field MRI Systems
- 10.2.2. High Field MRI Systems
- 10.2.3. Very Hig
- 10.3. Market Analysis, Insights and Forecast - by Application
- 10.3.1. Oncology
- 10.3.2. Neurology
- 10.3.3. Cardiology
- 10.3.4. Gastroenterology
- 10.3.5. Musculoskeletal
- 10.3.6. Other Applications
- 10.1. Market Analysis, Insights and Forecast - by Architecture
- 11. Kanto Magnetic Resonance Imaging Market in Japan Analysis, Insights and Forecast, 2019-2031
- 12. Kansai Magnetic Resonance Imaging Market in Japan Analysis, Insights and Forecast, 2019-2031
- 13. Chubu Magnetic Resonance Imaging Market in Japan Analysis, Insights and Forecast, 2019-2031
- 14. Kyushu Magnetic Resonance Imaging Market in Japan Analysis, Insights and Forecast, 2019-2031
- 15. Tohoku Magnetic Resonance Imaging Market in Japan Analysis, Insights and Forecast, 2019-2031
- 16. Competitive Analysis
- 16.1. Global Market Share Analysis 2024
- 16.2. Company Profiles
- 16.2.1 Shenzhen anke high-tech co ltd
- 16.2.1.1. Overview
- 16.2.1.2. Products
- 16.2.1.3. SWOT Analysis
- 16.2.1.4. Recent Developments
- 16.2.1.5. Financials (Based on Availability)
- 16.2.2 Esaote SpA
- 16.2.2.1. Overview
- 16.2.2.2. Products
- 16.2.2.3. SWOT Analysis
- 16.2.2.4. Recent Developments
- 16.2.2.5. Financials (Based on Availability)
- 16.2.3 Siemens Healthineers
- 16.2.3.1. Overview
- 16.2.3.2. Products
- 16.2.3.3. SWOT Analysis
- 16.2.3.4. Recent Developments
- 16.2.3.5. Financials (Based on Availability)
- 16.2.4 GE Healthcare
- 16.2.4.1. Overview
- 16.2.4.2. Products
- 16.2.4.3. SWOT Analysis
- 16.2.4.4. Recent Developments
- 16.2.4.5. Financials (Based on Availability)
- 16.2.5 Elekta AB
- 16.2.5.1. Overview
- 16.2.5.2. Products
- 16.2.5.3. SWOT Analysis
- 16.2.5.4. Recent Developments
- 16.2.5.5. Financials (Based on Availability)
- 16.2.6 Neusoft Medical Systems Co Ltd
- 16.2.6.1. Overview
- 16.2.6.2. Products
- 16.2.6.3. SWOT Analysis
- 16.2.6.4. Recent Developments
- 16.2.6.5. Financials (Based on Availability)
- 16.2.7 Koninklijke Philips NV
- 16.2.7.1. Overview
- 16.2.7.2. Products
- 16.2.7.3. SWOT Analysis
- 16.2.7.4. Recent Developments
- 16.2.7.5. Financials (Based on Availability)
- 16.2.8 Canon Medical Systems Corporation
- 16.2.8.1. Overview
- 16.2.8.2. Products
- 16.2.8.3. SWOT Analysis
- 16.2.8.4. Recent Developments
- 16.2.8.5. Financials (Based on Availability)
- 16.2.9 United Imaging Healthcare Co Ltd
- 16.2.9.1. Overview
- 16.2.9.2. Products
- 16.2.9.3. SWOT Analysis
- 16.2.9.4. Recent Developments
- 16.2.9.5. Financials (Based on Availability)
- 16.2.10 Fujifilm Holdings Corporation
- 16.2.10.1. Overview
- 16.2.10.2. Products
- 16.2.10.3. SWOT Analysis
- 16.2.10.4. Recent Developments
- 16.2.10.5. Financials (Based on Availability)
- 16.2.1 Shenzhen anke high-tech co ltd
List of Figures
- Figure 1: Global Magnetic Resonance Imaging Market in Japan Revenue Breakdown (Million, %) by Region 2024 & 2032
- Figure 2: Japan Magnetic Resonance Imaging Market in Japan Revenue (Million), by Country 2024 & 2032
- Figure 3: Japan Magnetic Resonance Imaging Market in Japan Revenue Share (%), by Country 2024 & 2032
- Figure 4: North America Magnetic Resonance Imaging Market in Japan Revenue (Million), by Architecture 2024 & 2032
- Figure 5: North America Magnetic Resonance Imaging Market in Japan Revenue Share (%), by Architecture 2024 & 2032
- Figure 6: North America Magnetic Resonance Imaging Market in Japan Revenue (Million), by Field Strength 2024 & 2032
- Figure 7: North America Magnetic Resonance Imaging Market in Japan Revenue Share (%), by Field Strength 2024 & 2032
- Figure 8: North America Magnetic Resonance Imaging Market in Japan Revenue (Million), by Application 2024 & 2032
- Figure 9: North America Magnetic Resonance Imaging Market in Japan Revenue Share (%), by Application 2024 & 2032
- Figure 10: North America Magnetic Resonance Imaging Market in Japan Revenue (Million), by Country 2024 & 2032
- Figure 11: North America Magnetic Resonance Imaging Market in Japan Revenue Share (%), by Country 2024 & 2032
- Figure 12: South America Magnetic Resonance Imaging Market in Japan Revenue (Million), by Architecture 2024 & 2032
- Figure 13: South America Magnetic Resonance Imaging Market in Japan Revenue Share (%), by Architecture 2024 & 2032
- Figure 14: South America Magnetic Resonance Imaging Market in Japan Revenue (Million), by Field Strength 2024 & 2032
- Figure 15: South America Magnetic Resonance Imaging Market in Japan Revenue Share (%), by Field Strength 2024 & 2032
- Figure 16: South America Magnetic Resonance Imaging Market in Japan Revenue (Million), by Application 2024 & 2032
- Figure 17: South America Magnetic Resonance Imaging Market in Japan Revenue Share (%), by Application 2024 & 2032
- Figure 18: South America Magnetic Resonance Imaging Market in Japan Revenue (Million), by Country 2024 & 2032
- Figure 19: South America Magnetic Resonance Imaging Market in Japan Revenue Share (%), by Country 2024 & 2032
- Figure 20: Europe Magnetic Resonance Imaging Market in Japan Revenue (Million), by Architecture 2024 & 2032
- Figure 21: Europe Magnetic Resonance Imaging Market in Japan Revenue Share (%), by Architecture 2024 & 2032
- Figure 22: Europe Magnetic Resonance Imaging Market in Japan Revenue (Million), by Field Strength 2024 & 2032
- Figure 23: Europe Magnetic Resonance Imaging Market in Japan Revenue Share (%), by Field Strength 2024 & 2032
- Figure 24: Europe Magnetic Resonance Imaging Market in Japan Revenue (Million), by Application 2024 & 2032
- Figure 25: Europe Magnetic Resonance Imaging Market in Japan Revenue Share (%), by Application 2024 & 2032
- Figure 26: Europe Magnetic Resonance Imaging Market in Japan Revenue (Million), by Country 2024 & 2032
- Figure 27: Europe Magnetic Resonance Imaging Market in Japan Revenue Share (%), by Country 2024 & 2032
- Figure 28: Middle East & Africa Magnetic Resonance Imaging Market in Japan Revenue (Million), by Architecture 2024 & 2032
- Figure 29: Middle East & Africa Magnetic Resonance Imaging Market in Japan Revenue Share (%), by Architecture 2024 & 2032
- Figure 30: Middle East & Africa Magnetic Resonance Imaging Market in Japan Revenue (Million), by Field Strength 2024 & 2032
- Figure 31: Middle East & Africa Magnetic Resonance Imaging Market in Japan Revenue Share (%), by Field Strength 2024 & 2032
- Figure 32: Middle East & Africa Magnetic Resonance Imaging Market in Japan Revenue (Million), by Application 2024 & 2032
- Figure 33: Middle East & Africa Magnetic Resonance Imaging Market in Japan Revenue Share (%), by Application 2024 & 2032
- Figure 34: Middle East & Africa Magnetic Resonance Imaging Market in Japan Revenue (Million), by Country 2024 & 2032
- Figure 35: Middle East & Africa Magnetic Resonance Imaging Market in Japan Revenue Share (%), by Country 2024 & 2032
- Figure 36: Asia Pacific Magnetic Resonance Imaging Market in Japan Revenue (Million), by Architecture 2024 & 2032
- Figure 37: Asia Pacific Magnetic Resonance Imaging Market in Japan Revenue Share (%), by Architecture 2024 & 2032
- Figure 38: Asia Pacific Magnetic Resonance Imaging Market in Japan Revenue (Million), by Field Strength 2024 & 2032
- Figure 39: Asia Pacific Magnetic Resonance Imaging Market in Japan Revenue Share (%), by Field Strength 2024 & 2032
- Figure 40: Asia Pacific Magnetic Resonance Imaging Market in Japan Revenue (Million), by Application 2024 & 2032
- Figure 41: Asia Pacific Magnetic Resonance Imaging Market in Japan Revenue Share (%), by Application 2024 & 2032
- Figure 42: Asia Pacific Magnetic Resonance Imaging Market in Japan Revenue (Million), by Country 2024 & 2032
- Figure 43: Asia Pacific Magnetic Resonance Imaging Market in Japan Revenue Share (%), by Country 2024 & 2032
List of Tables
- Table 1: Global Magnetic Resonance Imaging Market in Japan Revenue Million Forecast, by Region 2019 & 2032
- Table 2: Global Magnetic Resonance Imaging Market in Japan Revenue Million Forecast, by Architecture 2019 & 2032
- Table 3: Global Magnetic Resonance Imaging Market in Japan Revenue Million Forecast, by Field Strength 2019 & 2032
- Table 4: Global Magnetic Resonance Imaging Market in Japan Revenue Million Forecast, by Application 2019 & 2032
- Table 5: Global Magnetic Resonance Imaging Market in Japan Revenue Million Forecast, by Region 2019 & 2032
- Table 6: Global Magnetic Resonance Imaging Market in Japan Revenue Million Forecast, by Country 2019 & 2032
- Table 7: Kanto Magnetic Resonance Imaging Market in Japan Revenue (Million) Forecast, by Application 2019 & 2032
- Table 8: Kansai Magnetic Resonance Imaging Market in Japan Revenue (Million) Forecast, by Application 2019 & 2032
- Table 9: Chubu Magnetic Resonance Imaging Market in Japan Revenue (Million) Forecast, by Application 2019 & 2032
- Table 10: Kyushu Magnetic Resonance Imaging Market in Japan Revenue (Million) Forecast, by Application 2019 & 2032
- Table 11: Tohoku Magnetic Resonance Imaging Market in Japan Revenue (Million) Forecast, by Application 2019 & 2032
- Table 12: Global Magnetic Resonance Imaging Market in Japan Revenue Million Forecast, by Architecture 2019 & 2032
- Table 13: Global Magnetic Resonance Imaging Market in Japan Revenue Million Forecast, by Field Strength 2019 & 2032
- Table 14: Global Magnetic Resonance Imaging Market in Japan Revenue Million Forecast, by Application 2019 & 2032
- Table 15: Global Magnetic Resonance Imaging Market in Japan Revenue Million Forecast, by Country 2019 & 2032
- Table 16: United States Magnetic Resonance Imaging Market in Japan Revenue (Million) Forecast, by Application 2019 & 2032
- Table 17: Canada Magnetic Resonance Imaging Market in Japan Revenue (Million) Forecast, by Application 2019 & 2032
- Table 18: Mexico Magnetic Resonance Imaging Market in Japan Revenue (Million) Forecast, by Application 2019 & 2032
- Table 19: Global Magnetic Resonance Imaging Market in Japan Revenue Million Forecast, by Architecture 2019 & 2032
- Table 20: Global Magnetic Resonance Imaging Market in Japan Revenue Million Forecast, by Field Strength 2019 & 2032
- Table 21: Global Magnetic Resonance Imaging Market in Japan Revenue Million Forecast, by Application 2019 & 2032
- Table 22: Global Magnetic Resonance Imaging Market in Japan Revenue Million Forecast, by Country 2019 & 2032
- Table 23: Brazil Magnetic Resonance Imaging Market in Japan Revenue (Million) Forecast, by Application 2019 & 2032
- Table 24: Argentina Magnetic Resonance Imaging Market in Japan Revenue (Million) Forecast, by Application 2019 & 2032
- Table 25: Rest of South America Magnetic Resonance Imaging Market in Japan Revenue (Million) Forecast, by Application 2019 & 2032
- Table 26: Global Magnetic Resonance Imaging Market in Japan Revenue Million Forecast, by Architecture 2019 & 2032
- Table 27: Global Magnetic Resonance Imaging Market in Japan Revenue Million Forecast, by Field Strength 2019 & 2032
- Table 28: Global Magnetic Resonance Imaging Market in Japan Revenue Million Forecast, by Application 2019 & 2032
- Table 29: Global Magnetic Resonance Imaging Market in Japan Revenue Million Forecast, by Country 2019 & 2032
- Table 30: United Kingdom Magnetic Resonance Imaging Market in Japan Revenue (Million) Forecast, by Application 2019 & 2032
- Table 31: Germany Magnetic Resonance Imaging Market in Japan Revenue (Million) Forecast, by Application 2019 & 2032
- Table 32: France Magnetic Resonance Imaging Market in Japan Revenue (Million) Forecast, by Application 2019 & 2032
- Table 33: Italy Magnetic Resonance Imaging Market in Japan Revenue (Million) Forecast, by Application 2019 & 2032
- Table 34: Spain Magnetic Resonance Imaging Market in Japan Revenue (Million) Forecast, by Application 2019 & 2032
- Table 35: Russia Magnetic Resonance Imaging Market in Japan Revenue (Million) Forecast, by Application 2019 & 2032
- Table 36: Benelux Magnetic Resonance Imaging Market in Japan Revenue (Million) Forecast, by Application 2019 & 2032
- Table 37: Nordics Magnetic Resonance Imaging Market in Japan Revenue (Million) Forecast, by Application 2019 & 2032
- Table 38: Rest of Europe Magnetic Resonance Imaging Market in Japan Revenue (Million) Forecast, by Application 2019 & 2032
- Table 39: Global Magnetic Resonance Imaging Market in Japan Revenue Million Forecast, by Architecture 2019 & 2032
- Table 40: Global Magnetic Resonance Imaging Market in Japan Revenue Million Forecast, by Field Strength 2019 & 2032
- Table 41: Global Magnetic Resonance Imaging Market in Japan Revenue Million Forecast, by Application 2019 & 2032
- Table 42: Global Magnetic Resonance Imaging Market in Japan Revenue Million Forecast, by Country 2019 & 2032
- Table 43: Turkey Magnetic Resonance Imaging Market in Japan Revenue (Million) Forecast, by Application 2019 & 2032
- Table 44: Israel Magnetic Resonance Imaging Market in Japan Revenue (Million) Forecast, by Application 2019 & 2032
- Table 45: GCC Magnetic Resonance Imaging Market in Japan Revenue (Million) Forecast, by Application 2019 & 2032
- Table 46: North Africa Magnetic Resonance Imaging Market in Japan Revenue (Million) Forecast, by Application 2019 & 2032
- Table 47: South Africa Magnetic Resonance Imaging Market in Japan Revenue (Million) Forecast, by Application 2019 & 2032
- Table 48: Rest of Middle East & Africa Magnetic Resonance Imaging Market in Japan Revenue (Million) Forecast, by Application 2019 & 2032
- Table 49: Global Magnetic Resonance Imaging Market in Japan Revenue Million Forecast, by Architecture 2019 & 2032
- Table 50: Global Magnetic Resonance Imaging Market in Japan Revenue Million Forecast, by Field Strength 2019 & 2032
- Table 51: Global Magnetic Resonance Imaging Market in Japan Revenue Million Forecast, by Application 2019 & 2032
- Table 52: Global Magnetic Resonance Imaging Market in Japan Revenue Million Forecast, by Country 2019 & 2032
- Table 53: China Magnetic Resonance Imaging Market in Japan Revenue (Million) Forecast, by Application 2019 & 2032
- Table 54: India Magnetic Resonance Imaging Market in Japan Revenue (Million) Forecast, by Application 2019 & 2032
- Table 55: Japan Magnetic Resonance Imaging Market in Japan Revenue (Million) Forecast, by Application 2019 & 2032
- Table 56: South Korea Magnetic Resonance Imaging Market in Japan Revenue (Million) Forecast, by Application 2019 & 2032
- Table 57: ASEAN Magnetic Resonance Imaging Market in Japan Revenue (Million) Forecast, by Application 2019 & 2032
- Table 58: Oceania Magnetic Resonance Imaging Market in Japan Revenue (Million) Forecast, by Application 2019 & 2032
- Table 59: Rest of Asia Pacific Magnetic Resonance Imaging Market in Japan Revenue (Million) Forecast, by Application 2019 & 2032
Frequently Asked Questions
1. What is the projected Compound Annual Growth Rate (CAGR) of the Magnetic Resonance Imaging Market in Japan?
The projected CAGR is approximately 5.65%.
2. Which companies are prominent players in the Magnetic Resonance Imaging Market in Japan?
Key companies in the market include Shenzhen anke high-tech co ltd, Esaote SpA, Siemens Healthineers, GE Healthcare, Elekta AB, Neusoft Medical Systems Co Ltd, Koninklijke Philips NV, Canon Medical Systems Corporation, United Imaging Healthcare Co Ltd, Fujifilm Holdings Corporation.
3. What are the main segments of the Magnetic Resonance Imaging Market in Japan?
The market segments include Architecture, Field Strength, Application.
4. Can you provide details about the market size?
The market size is estimated to be USD 668.09 Million as of 2022.
5. What are some drivers contributing to market growth?
Introduction of Hybrid MRI Systems; Availability of Universal Health Coverage.
6. What are the notable trends driving market growth?
Oncology Segment is Expected to Witness Significant Growth in Future.
7. Are there any restraints impacting market growth?
High Cost of MRI Systems.
8. Can you provide examples of recent developments in the market?
In December 2021, Canon Medical Systems Corp, l, a Japan-based company, signed a licensing arrangement with Resoundant Inc. to include its technology in Canon's newest line of magnetic resonance imaging. Although research is underway to use Resoundant's MRE technology to scan other soft organs and brains.
9. What pricing options are available for accessing the report?
Pricing options include single-user, multi-user, and enterprise licenses priced at USD 3800, USD 4500, and USD 5800 respectively.
10. Is the market size provided in terms of value or volume?
The market size is provided in terms of value, measured in Million.
11. Are there any specific market keywords associated with the report?
Yes, the market keyword associated with the report is "Magnetic Resonance Imaging Market in Japan," which aids in identifying and referencing the specific market segment covered.
12. How do I determine which pricing option suits my needs best?
The pricing options vary based on user requirements and access needs. Individual users may opt for single-user licenses, while businesses requiring broader access may choose multi-user or enterprise licenses for cost-effective access to the report.
13. Are there any additional resources or data provided in the Magnetic Resonance Imaging Market in Japan report?
While the report offers comprehensive insights, it's advisable to review the specific contents or supplementary materials provided to ascertain if additional resources or data are available.
14. How can I stay updated on further developments or reports in the Magnetic Resonance Imaging Market in Japan?
To stay informed about further developments, trends, and reports in the Magnetic Resonance Imaging Market in Japan, consider subscribing to industry newsletters, following relevant companies and organizations, or regularly checking reputable industry news sources and publications.
Methodology
Step 1 - Identification of Relevant Samples Size from Population Database


Step 2 - Approaches for Defining Global Market Size (Value, Volume* & Price*)

Note*: In applicable scenarios
Step 3 - Data Sources
Primary Research
- Web Analytics
- Survey Reports
- Research Institute
- Latest Research Reports
- Opinion Leaders
Secondary Research
- Annual Reports
- White Paper
- Latest Press Release
- Industry Association
- Paid Database
- Investor Presentations

Step 4 - Data Triangulation
Involves using different sources of information in order to increase the validity of a study
These sources are likely to be stakeholders in a program - participants, other researchers, program staff, other community members, and so on.
Then we put all data in single framework & apply various statistical tools to find out the dynamic on the market.
During the analysis stage, feedback from the stakeholder groups would be compared to determine areas of agreement as well as areas of divergence
