

Key Insights
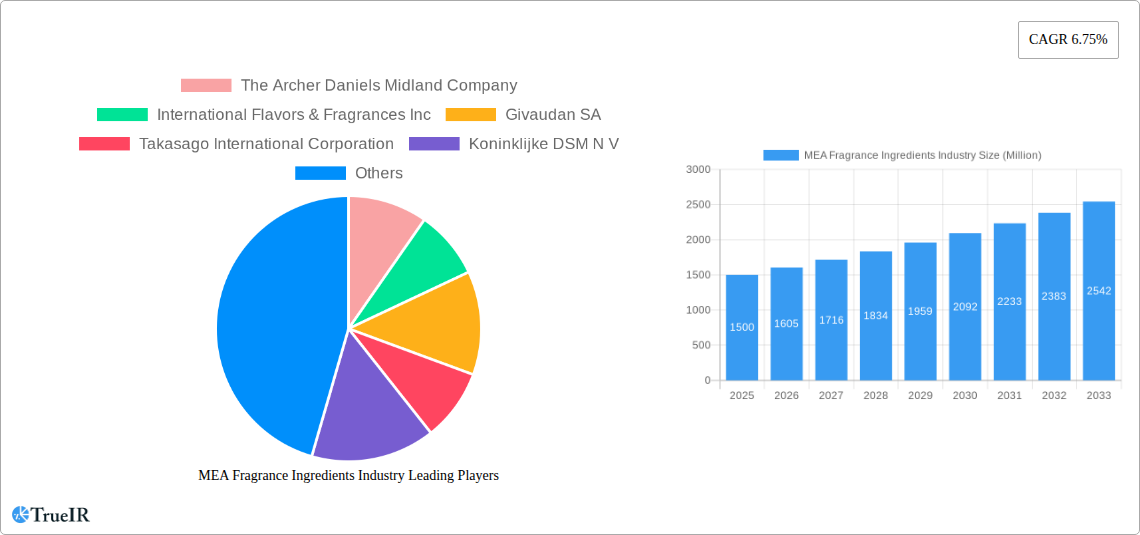
The Middle East and Africa (MEA) fragrance ingredients market is experiencing robust growth, projected to reach a substantial size driven by the booming cosmetics and personal care sectors, along with the increasing demand for high-quality fragrances in the food and beverage industries. The market's Compound Annual Growth Rate (CAGR) of 6.75% from 2019 to 2024 indicates a steady upward trajectory. Key drivers include rising disposable incomes, a growing young population with increased spending power on luxury goods, and a surge in popularity of personalized fragrances. The UAE, Saudi Arabia, and Egypt are significant contributors to the market's growth, reflecting their advanced economies and established consumer markets. Synthetic fragrance ingredients currently dominate the market due to their cost-effectiveness and versatility, while the natural segment is witnessing a steady growth fuelled by increasing consumer preference for natural and organic products. However, fluctuating raw material prices and stringent regulations regarding fragrance ingredient composition pose significant challenges. Segmentation by application highlights the food and beverage sector as a major end-use segment, followed by the beauty and personal care industry, which is expected to drive further expansion. Major players such as Archer Daniels Midland, International Flavors & Fragrances, and Givaudan are leveraging their established presence and innovation to capture market share. The forecast period of 2025-2033 projects continued growth, driven by the factors mentioned above, along with anticipated market expansions in other MEA countries. The shift towards sustainable and ethically sourced ingredients is also expected to influence market trends in the coming years.
The MEA fragrance ingredients market presents compelling opportunities for both established players and new entrants. Strategic partnerships, product innovation focusing on natural and sustainable options, and effective marketing campaigns targeting the growing consumer base are critical success factors. Understanding evolving consumer preferences and regulatory landscapes will be essential for companies aiming to capitalize on the market's growth potential. Focusing on specific niche markets within the larger fragrance industry, such as premium or specialized fragrances, could further enhance profitability and competitiveness. Furthermore, exploring emerging technologies in fragrance development and utilizing data-driven approaches to marketing will enable companies to achieve a sustained competitive advantage.
MEA Fragrance Ingredients Industry: A Comprehensive Market Report (2019-2033)
This dynamic report provides a comprehensive analysis of the MEA (Middle East and Africa) Fragrance Ingredients market, offering invaluable insights for industry stakeholders. Covering the period 2019-2033, with a focus on 2025, this study delves into market size, growth drivers, competitive dynamics, and future trends. Benefit from detailed segmentation by country (UAE, Saudi Arabia, Egypt, South Africa, Rest of MEA), ingredient type (synthetic, natural), and application (food, beverages, beauty & personal care, perfumes, others). Unlock actionable intelligence to navigate this rapidly evolving market.
MEA Fragrance Ingredients Industry Market Structure & Competitive Landscape
The MEA fragrance ingredients market exhibits a moderately concentrated structure, with several multinational giants alongside regional players. Key players include The Archer Daniels Midland Company, International Flavors & Fragrances Inc, Givaudan SA, Takasago International Corporation, Koninklijke DSM N.V, MANE SA, Kerry Group PLC, Symrise AG, Sensient Technologies Corporation, and Solvay SA. However, the market also accommodates numerous smaller, specialized companies, particularly in the natural ingredients segment.
- Market Concentration: The Herfindahl-Hirschman Index (HHI) is estimated at xx, suggesting a moderately concentrated market. This concentration is driven by the significant investments required for research, development, and global distribution networks.
- Innovation Drivers: The demand for novel and sustainable fragrance ingredients, particularly natural and organic options, fuels ongoing innovation. This trend is further fueled by the increasing popularity of natural and organic personal care products in the region.
- Regulatory Impacts: Stringent regulations regarding ingredient safety and labeling in various MEA countries impact the market. Compliance costs influence the profitability of smaller players.
- Product Substitutes: The availability of synthetic alternatives and the growing interest in natural ingredients create a competitive landscape. This necessitates ongoing innovation to maintain competitiveness.
- End-User Segmentation: The major end-use segments are beauty and personal care, perfumes, and food and beverages, each showing unique growth trajectories.
- M&A Trends: The fragrance industry has witnessed considerable M&A activity in recent years, as evidenced by DSM and Firmenich’s combination in 2022. The total value of M&A transactions in the MEA region during the historical period (2019-2024) is estimated at $xx Million. This consolidation trend reflects the pursuit of economies of scale and diversified product portfolios.
MEA Fragrance Ingredients Industry Market Trends & Opportunities
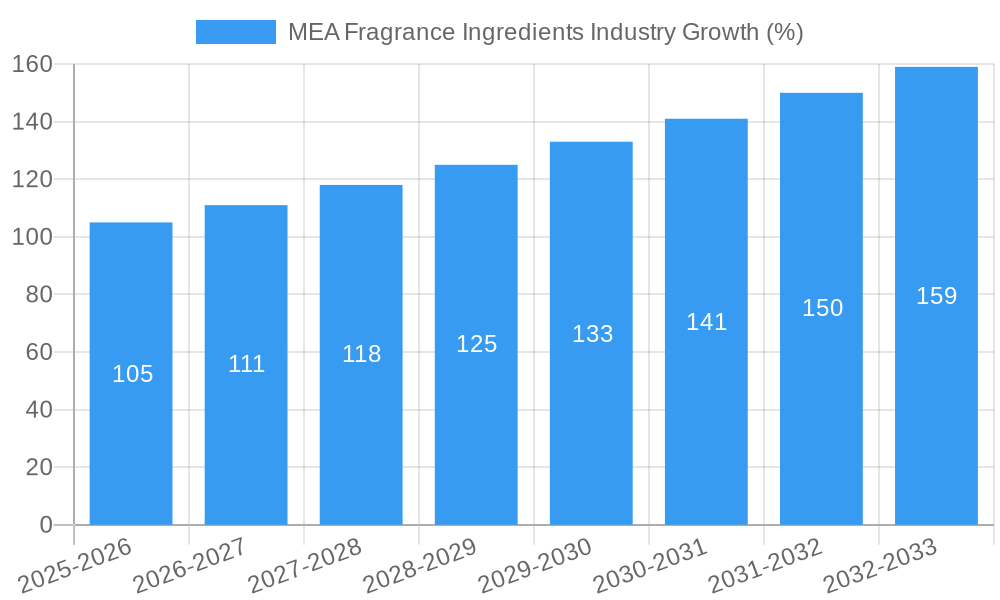
The MEA fragrance ingredients market is experiencing robust growth, driven by rising disposable incomes, changing consumer preferences, and the flourishing beauty and personal care sector. The market size was valued at $xx Million in 2024 and is projected to reach $xx Million by 2033, exhibiting a CAGR of xx% during the forecast period (2025-2033).
This expansion is fueled by several key factors:
- Technological advancements: The development of innovative fragrance technologies, such as encapsulation and microencapsulation, enhances product performance and shelf life, driving market expansion.
- Evolving consumer preferences: The increasing preference for natural and sustainable fragrance ingredients presents significant opportunities for manufacturers specializing in organic and ethically sourced products. Consumer demand for customized fragrances also adds to market complexity.
- Competitive dynamics: Intense competition drives product differentiation and pricing strategies, shaping the market dynamics.
- Market penetration rates: The penetration of fragrance ingredients in various end-use sectors, especially in the food and beverage industry, is increasing rapidly due to improved consumer awareness. The penetration rate for natural fragrances is also experiencing significant growth.
- Regional disparities: Growth rates vary across different MEA countries, influenced by economic development and regulatory environments.
Dominant Markets & Segments in MEA Fragrance Ingredients Industry
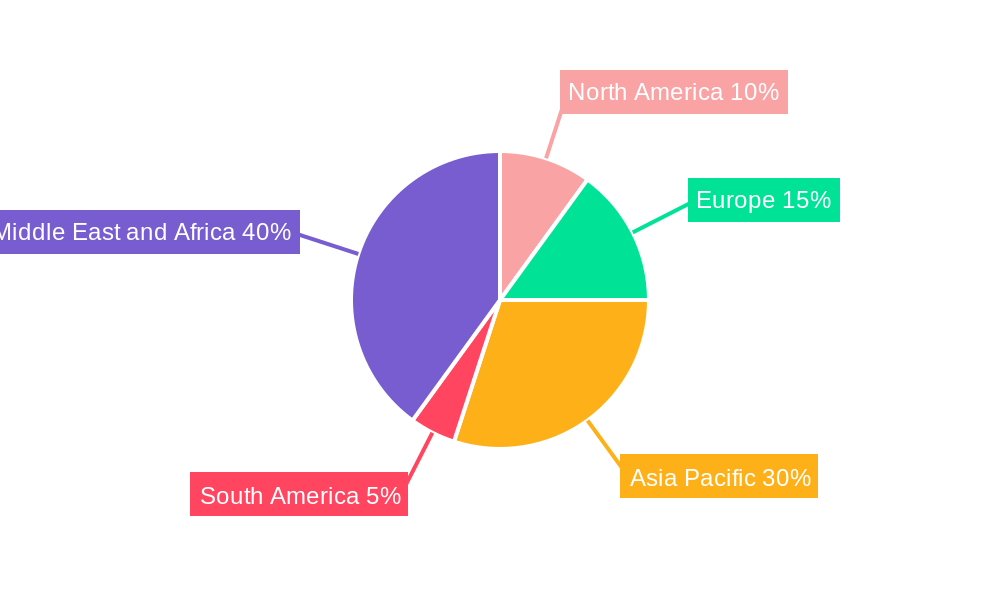
The MEA fragrance ingredients market is characterized by significant regional disparities. While the UAE and Saudi Arabia represent the largest markets due to their advanced economies and burgeoning personal care industries, other countries, such as Egypt and South Africa, are experiencing substantial growth potential.
Leading Regions/Countries: The UAE and Saudi Arabia collectively account for approximately xx% of the total MEA market. Their well-established infrastructure, significant investments in the personal care industry, and increased disposable income levels are key growth drivers. South Africa's developing economy offers considerable future growth prospects.
Leading Segments:
- Type: Synthetic ingredients currently dominate the market share due to their cost-effectiveness and versatility. However, the demand for natural ingredients is rising rapidly due to changing consumer preferences.
- Application: The beauty and personal care segment is currently the largest consumer of fragrance ingredients. However, the food and beverage industry presents significant growth potential, fueled by increasing demand for flavored products.
Key Growth Drivers:
- UAE & Saudi Arabia: Strong economic growth, significant investments in infrastructure, and a large consumer base.
- Egypt & South Africa: Rising disposable incomes, increasing awareness of personal care and hygiene, and expanding middle class.
MEA Fragrance Ingredients Industry Product Analysis
The MEA fragrance ingredients market showcases a wide array of products, ranging from basic fragrance compounds to complex blends tailored for specific applications. Technological advancements are driving innovation, with a focus on developing sustainable, eco-friendly, and high-performance ingredients. The trend towards customization and personalized fragrances is also prominent, pushing the boundaries of product development. Competition is fierce, demanding continuous innovation and value addition to secure a competitive edge.
Key Drivers, Barriers & Challenges in MEA Fragrance Ingredients Industry
Key Drivers:
- Rising disposable incomes: Increased purchasing power fuels demand for fragrance-based products across all segments.
- Growing beauty and personal care sector: The increasing popularity of cosmetics, perfumes, and personal care products drives demand for fragrance ingredients.
- Technological innovations: Advances in fragrance technology lead to new product offerings with enhanced performance.
Challenges and Restraints:
- Regulatory hurdles: Strict regulations related to safety and labeling impact cost and time to market. Varied regulations across different countries add to compliance complexity.
- Supply chain disruptions: Global supply chain volatility can affect the availability and pricing of raw materials. This is exacerbated by regional geopolitical factors.
- Competitive pressures: The market's competitive intensity puts pressure on profit margins, requiring ongoing innovation and cost optimization. The entry of new players increases competition.
Growth Drivers in the MEA Fragrance Ingredients Industry Market
The MEA fragrance ingredients market is boosted by several significant growth drivers. These include expanding consumer bases with rising disposable incomes, the flourishing beauty and personal care industry, technological innovations that provide superior fragrance formulations, and government initiatives promoting domestic manufacturing. The increasing demand for natural and sustainable fragrance ingredients also drives market growth.
Challenges Impacting MEA Fragrance Ingredients Industry Growth
Several challenges hinder the MEA fragrance ingredients industry's growth. These include stringent regulatory compliance requirements that raise costs and complexity, volatile global supply chains leading to raw material shortages and price fluctuations, and intense competition from established and emerging players. Geopolitical instability and varying regulatory frameworks across different countries in the region further complicate market expansion.
Key Players Shaping the MEA Fragrance Ingredients Industry Market
- The Archer Daniels Midland Company
- International Flavors & Fragrances Inc
- Givaudan SA
- Takasago International Corporation
- Koninklijke DSM N.V
- MANE SA
- Kerry Group PLC
- Symrise AG
- Sensient Technologies Corporation
- Solvay SA
- *List Not Exhaustive
Significant MEA Fragrance Ingredients Industry Milestones
- May 2022: DSM and Firmenich announced a business combination agreement, creating a leading player in nutrition, beauty, and well-being. This significantly reshaped the industry landscape.
- February 2022: Archer Daniels Midland Company acquired Comhan, a South African flavor distribution company, expanding its reach in the African market.
- January 2022: Kerry opened a new state-of-the-art facility in Saudi Arabia, strengthening its position in the MENAT region.
Future Outlook for MEA Fragrance Ingredients Industry Market
The MEA fragrance ingredients market is poised for continued growth, driven by sustained economic expansion, evolving consumer preferences, and ongoing technological advancements. Strategic opportunities exist in developing sustainable and natural ingredients, catering to the increasing demand for eco-friendly products. The market's future hinges on navigating regulatory complexities and adapting to changing consumer preferences, particularly the growing popularity of customized fragrance experiences.
MEA Fragrance Ingredients Industry Segmentation
-
1. Type
- 1.1. Synthetic
- 1.2. Natural
-
2. Application
-
2.1. Food
- 2.1.1. Savory Food
- 2.1.2. Dairy Products
- 2.1.3. Bakery and Confectionery
- 2.1.4. Meat and Meat Products
- 2.1.5. Others
- 2.2. Beverages
- 2.3. Beauty and Personal Care
- 2.4. Perfumes
-
2.1. Food
MEA Fragrance Ingredients Industry Segmentation By Geography
-
1. North America
- 1.1. United States
- 1.2. Canada
- 1.3. Mexico
-
2. South America
- 2.1. Brazil
- 2.2. Argentina
- 2.3. Rest of South America
-
3. Europe
- 3.1. United Kingdom
- 3.2. Germany
- 3.3. France
- 3.4. Italy
- 3.5. Spain
- 3.6. Russia
- 3.7. Benelux
- 3.8. Nordics
- 3.9. Rest of Europe
-
4. Middle East & Africa
- 4.1. Turkey
- 4.2. Israel
- 4.3. GCC
- 4.4. North Africa
- 4.5. South Africa
- 4.6. Rest of Middle East & Africa
-
5. Asia Pacific
- 5.1. China
- 5.2. India
- 5.3. Japan
- 5.4. South Korea
- 5.5. ASEAN
- 5.6. Oceania
- 5.7. Rest of Asia Pacific
MEA Fragrance Ingredients Industry REPORT HIGHLIGHTS
| Aspects | Details |
|---|---|
| Study Period | 2019-2033 |
| Base Year | 2024 |
| Estimated Year | 2025 |
| Forecast Period | 2025-2033 |
| Historical Period | 2019-2024 |
| Growth Rate | CAGR of 6.75% from 2019-2033 |
| Segmentation |
|
Table of Contents
- 1. Introduction
- 1.1. Research Scope
- 1.2. Market Segmentation
- 1.3. Research Methodology
- 1.4. Definitions and Assumptions
- 2. Executive Summary
- 2.1. Introduction
- 3. Market Dynamics
- 3.1. Introduction
- 3.2. Market Drivers
- 3.2.1. Demand for Convenient Ready-to-Eat Food Products; Growing Affinity Toward Ethnic and Organic Frozen Ready Meals
- 3.3. Market Restrains
- 3.3.1. Rising Concerns Over Food Safety and Quality
- 3.4. Market Trends
- 3.4.1. Growing Demand for Natural Ingredients in the Region
- 4. Market Factor Analysis
- 4.1. Porters Five Forces
- 4.2. Supply/Value Chain
- 4.3. PESTEL analysis
- 4.4. Market Entropy
- 4.5. Patent/Trademark Analysis
- 5. Global MEA Fragrance Ingredients Industry Analysis, Insights and Forecast, 2019-2031
- 5.1. Market Analysis, Insights and Forecast - by Type
- 5.1.1. Synthetic
- 5.1.2. Natural
- 5.2. Market Analysis, Insights and Forecast - by Application
- 5.2.1. Food
- 5.2.1.1. Savory Food
- 5.2.1.2. Dairy Products
- 5.2.1.3. Bakery and Confectionery
- 5.2.1.4. Meat and Meat Products
- 5.2.1.5. Others
- 5.2.2. Beverages
- 5.2.3. Beauty and Personal Care
- 5.2.4. Perfumes
- 5.2.1. Food
- 5.3. Market Analysis, Insights and Forecast - by Region
- 5.3.1. North America
- 5.3.2. South America
- 5.3.3. Europe
- 5.3.4. Middle East & Africa
- 5.3.5. Asia Pacific
- 5.1. Market Analysis, Insights and Forecast - by Type
- 6. North America MEA Fragrance Ingredients Industry Analysis, Insights and Forecast, 2019-2031
- 6.1. Market Analysis, Insights and Forecast - by Type
- 6.1.1. Synthetic
- 6.1.2. Natural
- 6.2. Market Analysis, Insights and Forecast - by Application
- 6.2.1. Food
- 6.2.1.1. Savory Food
- 6.2.1.2. Dairy Products
- 6.2.1.3. Bakery and Confectionery
- 6.2.1.4. Meat and Meat Products
- 6.2.1.5. Others
- 6.2.2. Beverages
- 6.2.3. Beauty and Personal Care
- 6.2.4. Perfumes
- 6.2.1. Food
- 6.1. Market Analysis, Insights and Forecast - by Type
- 7. South America MEA Fragrance Ingredients Industry Analysis, Insights and Forecast, 2019-2031
- 7.1. Market Analysis, Insights and Forecast - by Type
- 7.1.1. Synthetic
- 7.1.2. Natural
- 7.2. Market Analysis, Insights and Forecast - by Application
- 7.2.1. Food
- 7.2.1.1. Savory Food
- 7.2.1.2. Dairy Products
- 7.2.1.3. Bakery and Confectionery
- 7.2.1.4. Meat and Meat Products
- 7.2.1.5. Others
- 7.2.2. Beverages
- 7.2.3. Beauty and Personal Care
- 7.2.4. Perfumes
- 7.2.1. Food
- 7.1. Market Analysis, Insights and Forecast - by Type
- 8. Europe MEA Fragrance Ingredients Industry Analysis, Insights and Forecast, 2019-2031
- 8.1. Market Analysis, Insights and Forecast - by Type
- 8.1.1. Synthetic
- 8.1.2. Natural
- 8.2. Market Analysis, Insights and Forecast - by Application
- 8.2.1. Food
- 8.2.1.1. Savory Food
- 8.2.1.2. Dairy Products
- 8.2.1.3. Bakery and Confectionery
- 8.2.1.4. Meat and Meat Products
- 8.2.1.5. Others
- 8.2.2. Beverages
- 8.2.3. Beauty and Personal Care
- 8.2.4. Perfumes
- 8.2.1. Food
- 8.1. Market Analysis, Insights and Forecast - by Type
- 9. Middle East & Africa MEA Fragrance Ingredients Industry Analysis, Insights and Forecast, 2019-2031
- 9.1. Market Analysis, Insights and Forecast - by Type
- 9.1.1. Synthetic
- 9.1.2. Natural
- 9.2. Market Analysis, Insights and Forecast - by Application
- 9.2.1. Food
- 9.2.1.1. Savory Food
- 9.2.1.2. Dairy Products
- 9.2.1.3. Bakery and Confectionery
- 9.2.1.4. Meat and Meat Products
- 9.2.1.5. Others
- 9.2.2. Beverages
- 9.2.3. Beauty and Personal Care
- 9.2.4. Perfumes
- 9.2.1. Food
- 9.1. Market Analysis, Insights and Forecast - by Type
- 10. Asia Pacific MEA Fragrance Ingredients Industry Analysis, Insights and Forecast, 2019-2031
- 10.1. Market Analysis, Insights and Forecast - by Type
- 10.1.1. Synthetic
- 10.1.2. Natural
- 10.2. Market Analysis, Insights and Forecast - by Application
- 10.2.1. Food
- 10.2.1.1. Savory Food
- 10.2.1.2. Dairy Products
- 10.2.1.3. Bakery and Confectionery
- 10.2.1.4. Meat and Meat Products
- 10.2.1.5. Others
- 10.2.2. Beverages
- 10.2.3. Beauty and Personal Care
- 10.2.4. Perfumes
- 10.2.1. Food
- 10.1. Market Analysis, Insights and Forecast - by Type
- 11. North America MEA Fragrance Ingredients Industry Analysis, Insights and Forecast, 2019-2031
- 11.1. Market Analysis, Insights and Forecast - By Country/Sub-region
- 11.1.1 United States
- 11.1.2 Canada
- 11.1.3 Mexico
- 11.1.4 Rest of North America
- 12. Europe MEA Fragrance Ingredients Industry Analysis, Insights and Forecast, 2019-2031
- 12.1. Market Analysis, Insights and Forecast - By Country/Sub-region
- 12.1.1 Spain
- 12.1.2 United Kingdom
- 12.1.3 Germany
- 12.1.4 France
- 12.1.5 Italy
- 12.1.6 Russia
- 12.1.7 Rest of Europe
- 13. Asia Pacific MEA Fragrance Ingredients Industry Analysis, Insights and Forecast, 2019-2031
- 13.1. Market Analysis, Insights and Forecast - By Country/Sub-region
- 13.1.1 China
- 13.1.2 Japan
- 13.1.3 India
- 13.1.4 Australia
- 13.1.5 Rest of Asia Pacific
- 14. South America MEA Fragrance Ingredients Industry Analysis, Insights and Forecast, 2019-2031
- 14.1. Market Analysis, Insights and Forecast - By Country/Sub-region
- 14.1.1 Brazil
- 14.1.2 Argentina
- 14.1.3 Rest of South America
- 15. Middle East and Africa MEA Fragrance Ingredients Industry Analysis, Insights and Forecast, 2019-2031
- 15.1. Market Analysis, Insights and Forecast - By Country/Sub-region
- 15.1.1 South Africa
- 15.1.2 Saudi Arabia
- 15.1.3 Rest of Middle East and Africa
- 16. Competitive Analysis
- 16.1. Global Market Share Analysis 2024
- 16.2. Company Profiles
- 16.2.1 The Archer Daniels Midland Company
- 16.2.1.1. Overview
- 16.2.1.2. Products
- 16.2.1.3. SWOT Analysis
- 16.2.1.4. Recent Developments
- 16.2.1.5. Financials (Based on Availability)
- 16.2.2 International Flavors & Fragrances Inc
- 16.2.2.1. Overview
- 16.2.2.2. Products
- 16.2.2.3. SWOT Analysis
- 16.2.2.4. Recent Developments
- 16.2.2.5. Financials (Based on Availability)
- 16.2.3 Givaudan SA
- 16.2.3.1. Overview
- 16.2.3.2. Products
- 16.2.3.3. SWOT Analysis
- 16.2.3.4. Recent Developments
- 16.2.3.5. Financials (Based on Availability)
- 16.2.4 Takasago International Corporation
- 16.2.4.1. Overview
- 16.2.4.2. Products
- 16.2.4.3. SWOT Analysis
- 16.2.4.4. Recent Developments
- 16.2.4.5. Financials (Based on Availability)
- 16.2.5 Koninklijke DSM N V
- 16.2.5.1. Overview
- 16.2.5.2. Products
- 16.2.5.3. SWOT Analysis
- 16.2.5.4. Recent Developments
- 16.2.5.5. Financials (Based on Availability)
- 16.2.6 MANE SA
- 16.2.6.1. Overview
- 16.2.6.2. Products
- 16.2.6.3. SWOT Analysis
- 16.2.6.4. Recent Developments
- 16.2.6.5. Financials (Based on Availability)
- 16.2.7 Kerry Group PLC
- 16.2.7.1. Overview
- 16.2.7.2. Products
- 16.2.7.3. SWOT Analysis
- 16.2.7.4. Recent Developments
- 16.2.7.5. Financials (Based on Availability)
- 16.2.8 Symrise AG
- 16.2.8.1. Overview
- 16.2.8.2. Products
- 16.2.8.3. SWOT Analysis
- 16.2.8.4. Recent Developments
- 16.2.8.5. Financials (Based on Availability)
- 16.2.9 Sensient Technologies Corporation
- 16.2.9.1. Overview
- 16.2.9.2. Products
- 16.2.9.3. SWOT Analysis
- 16.2.9.4. Recent Developments
- 16.2.9.5. Financials (Based on Availability)
- 16.2.10 Solvay SA*List Not Exhaustive
- 16.2.10.1. Overview
- 16.2.10.2. Products
- 16.2.10.3. SWOT Analysis
- 16.2.10.4. Recent Developments
- 16.2.10.5. Financials (Based on Availability)
- 16.2.1 The Archer Daniels Midland Company
List of Figures
- Figure 1: Global MEA Fragrance Ingredients Industry Revenue Breakdown (Million, %) by Region 2024 & 2032
- Figure 2: North America MEA Fragrance Ingredients Industry Revenue (Million), by Country 2024 & 2032
- Figure 3: North America MEA Fragrance Ingredients Industry Revenue Share (%), by Country 2024 & 2032
- Figure 4: Europe MEA Fragrance Ingredients Industry Revenue (Million), by Country 2024 & 2032
- Figure 5: Europe MEA Fragrance Ingredients Industry Revenue Share (%), by Country 2024 & 2032
- Figure 6: Asia Pacific MEA Fragrance Ingredients Industry Revenue (Million), by Country 2024 & 2032
- Figure 7: Asia Pacific MEA Fragrance Ingredients Industry Revenue Share (%), by Country 2024 & 2032
- Figure 8: South America MEA Fragrance Ingredients Industry Revenue (Million), by Country 2024 & 2032
- Figure 9: South America MEA Fragrance Ingredients Industry Revenue Share (%), by Country 2024 & 2032
- Figure 10: Middle East and Africa MEA Fragrance Ingredients Industry Revenue (Million), by Country 2024 & 2032
- Figure 11: Middle East and Africa MEA Fragrance Ingredients Industry Revenue Share (%), by Country 2024 & 2032
- Figure 12: North America MEA Fragrance Ingredients Industry Revenue (Million), by Type 2024 & 2032
- Figure 13: North America MEA Fragrance Ingredients Industry Revenue Share (%), by Type 2024 & 2032
- Figure 14: North America MEA Fragrance Ingredients Industry Revenue (Million), by Application 2024 & 2032
- Figure 15: North America MEA Fragrance Ingredients Industry Revenue Share (%), by Application 2024 & 2032
- Figure 16: North America MEA Fragrance Ingredients Industry Revenue (Million), by Country 2024 & 2032
- Figure 17: North America MEA Fragrance Ingredients Industry Revenue Share (%), by Country 2024 & 2032
- Figure 18: South America MEA Fragrance Ingredients Industry Revenue (Million), by Type 2024 & 2032
- Figure 19: South America MEA Fragrance Ingredients Industry Revenue Share (%), by Type 2024 & 2032
- Figure 20: South America MEA Fragrance Ingredients Industry Revenue (Million), by Application 2024 & 2032
- Figure 21: South America MEA Fragrance Ingredients Industry Revenue Share (%), by Application 2024 & 2032
- Figure 22: South America MEA Fragrance Ingredients Industry Revenue (Million), by Country 2024 & 2032
- Figure 23: South America MEA Fragrance Ingredients Industry Revenue Share (%), by Country 2024 & 2032
- Figure 24: Europe MEA Fragrance Ingredients Industry Revenue (Million), by Type 2024 & 2032
- Figure 25: Europe MEA Fragrance Ingredients Industry Revenue Share (%), by Type 2024 & 2032
- Figure 26: Europe MEA Fragrance Ingredients Industry Revenue (Million), by Application 2024 & 2032
- Figure 27: Europe MEA Fragrance Ingredients Industry Revenue Share (%), by Application 2024 & 2032
- Figure 28: Europe MEA Fragrance Ingredients Industry Revenue (Million), by Country 2024 & 2032
- Figure 29: Europe MEA Fragrance Ingredients Industry Revenue Share (%), by Country 2024 & 2032
- Figure 30: Middle East & Africa MEA Fragrance Ingredients Industry Revenue (Million), by Type 2024 & 2032
- Figure 31: Middle East & Africa MEA Fragrance Ingredients Industry Revenue Share (%), by Type 2024 & 2032
- Figure 32: Middle East & Africa MEA Fragrance Ingredients Industry Revenue (Million), by Application 2024 & 2032
- Figure 33: Middle East & Africa MEA Fragrance Ingredients Industry Revenue Share (%), by Application 2024 & 2032
- Figure 34: Middle East & Africa MEA Fragrance Ingredients Industry Revenue (Million), by Country 2024 & 2032
- Figure 35: Middle East & Africa MEA Fragrance Ingredients Industry Revenue Share (%), by Country 2024 & 2032
- Figure 36: Asia Pacific MEA Fragrance Ingredients Industry Revenue (Million), by Type 2024 & 2032
- Figure 37: Asia Pacific MEA Fragrance Ingredients Industry Revenue Share (%), by Type 2024 & 2032
- Figure 38: Asia Pacific MEA Fragrance Ingredients Industry Revenue (Million), by Application 2024 & 2032
- Figure 39: Asia Pacific MEA Fragrance Ingredients Industry Revenue Share (%), by Application 2024 & 2032
- Figure 40: Asia Pacific MEA Fragrance Ingredients Industry Revenue (Million), by Country 2024 & 2032
- Figure 41: Asia Pacific MEA Fragrance Ingredients Industry Revenue Share (%), by Country 2024 & 2032
List of Tables
- Table 1: Global MEA Fragrance Ingredients Industry Revenue Million Forecast, by Region 2019 & 2032
- Table 2: Global MEA Fragrance Ingredients Industry Revenue Million Forecast, by Type 2019 & 2032
- Table 3: Global MEA Fragrance Ingredients Industry Revenue Million Forecast, by Application 2019 & 2032
- Table 4: Global MEA Fragrance Ingredients Industry Revenue Million Forecast, by Region 2019 & 2032
- Table 5: Global MEA Fragrance Ingredients Industry Revenue Million Forecast, by Country 2019 & 2032
- Table 6: United States MEA Fragrance Ingredients Industry Revenue (Million) Forecast, by Application 2019 & 2032
- Table 7: Canada MEA Fragrance Ingredients Industry Revenue (Million) Forecast, by Application 2019 & 2032
- Table 8: Mexico MEA Fragrance Ingredients Industry Revenue (Million) Forecast, by Application 2019 & 2032
- Table 9: Rest of North America MEA Fragrance Ingredients Industry Revenue (Million) Forecast, by Application 2019 & 2032
- Table 10: Global MEA Fragrance Ingredients Industry Revenue Million Forecast, by Country 2019 & 2032
- Table 11: Spain MEA Fragrance Ingredients Industry Revenue (Million) Forecast, by Application 2019 & 2032
- Table 12: United Kingdom MEA Fragrance Ingredients Industry Revenue (Million) Forecast, by Application 2019 & 2032
- Table 13: Germany MEA Fragrance Ingredients Industry Revenue (Million) Forecast, by Application 2019 & 2032
- Table 14: France MEA Fragrance Ingredients Industry Revenue (Million) Forecast, by Application 2019 & 2032
- Table 15: Italy MEA Fragrance Ingredients Industry Revenue (Million) Forecast, by Application 2019 & 2032
- Table 16: Russia MEA Fragrance Ingredients Industry Revenue (Million) Forecast, by Application 2019 & 2032
- Table 17: Rest of Europe MEA Fragrance Ingredients Industry Revenue (Million) Forecast, by Application 2019 & 2032
- Table 18: Global MEA Fragrance Ingredients Industry Revenue Million Forecast, by Country 2019 & 2032
- Table 19: China MEA Fragrance Ingredients Industry Revenue (Million) Forecast, by Application 2019 & 2032
- Table 20: Japan MEA Fragrance Ingredients Industry Revenue (Million) Forecast, by Application 2019 & 2032
- Table 21: India MEA Fragrance Ingredients Industry Revenue (Million) Forecast, by Application 2019 & 2032
- Table 22: Australia MEA Fragrance Ingredients Industry Revenue (Million) Forecast, by Application 2019 & 2032
- Table 23: Rest of Asia Pacific MEA Fragrance Ingredients Industry Revenue (Million) Forecast, by Application 2019 & 2032
- Table 24: Global MEA Fragrance Ingredients Industry Revenue Million Forecast, by Country 2019 & 2032
- Table 25: Brazil MEA Fragrance Ingredients Industry Revenue (Million) Forecast, by Application 2019 & 2032
- Table 26: Argentina MEA Fragrance Ingredients Industry Revenue (Million) Forecast, by Application 2019 & 2032
- Table 27: Rest of South America MEA Fragrance Ingredients Industry Revenue (Million) Forecast, by Application 2019 & 2032
- Table 28: Global MEA Fragrance Ingredients Industry Revenue Million Forecast, by Country 2019 & 2032
- Table 29: South Africa MEA Fragrance Ingredients Industry Revenue (Million) Forecast, by Application 2019 & 2032
- Table 30: Saudi Arabia MEA Fragrance Ingredients Industry Revenue (Million) Forecast, by Application 2019 & 2032
- Table 31: Rest of Middle East and Africa MEA Fragrance Ingredients Industry Revenue (Million) Forecast, by Application 2019 & 2032
- Table 32: Global MEA Fragrance Ingredients Industry Revenue Million Forecast, by Type 2019 & 2032
- Table 33: Global MEA Fragrance Ingredients Industry Revenue Million Forecast, by Application 2019 & 2032
- Table 34: Global MEA Fragrance Ingredients Industry Revenue Million Forecast, by Country 2019 & 2032
- Table 35: United States MEA Fragrance Ingredients Industry Revenue (Million) Forecast, by Application 2019 & 2032
- Table 36: Canada MEA Fragrance Ingredients Industry Revenue (Million) Forecast, by Application 2019 & 2032
- Table 37: Mexico MEA Fragrance Ingredients Industry Revenue (Million) Forecast, by Application 2019 & 2032
- Table 38: Global MEA Fragrance Ingredients Industry Revenue Million Forecast, by Type 2019 & 2032
- Table 39: Global MEA Fragrance Ingredients Industry Revenue Million Forecast, by Application 2019 & 2032
- Table 40: Global MEA Fragrance Ingredients Industry Revenue Million Forecast, by Country 2019 & 2032
- Table 41: Brazil MEA Fragrance Ingredients Industry Revenue (Million) Forecast, by Application 2019 & 2032
- Table 42: Argentina MEA Fragrance Ingredients Industry Revenue (Million) Forecast, by Application 2019 & 2032
- Table 43: Rest of South America MEA Fragrance Ingredients Industry Revenue (Million) Forecast, by Application 2019 & 2032
- Table 44: Global MEA Fragrance Ingredients Industry Revenue Million Forecast, by Type 2019 & 2032
- Table 45: Global MEA Fragrance Ingredients Industry Revenue Million Forecast, by Application 2019 & 2032
- Table 46: Global MEA Fragrance Ingredients Industry Revenue Million Forecast, by Country 2019 & 2032
- Table 47: United Kingdom MEA Fragrance Ingredients Industry Revenue (Million) Forecast, by Application 2019 & 2032
- Table 48: Germany MEA Fragrance Ingredients Industry Revenue (Million) Forecast, by Application 2019 & 2032
- Table 49: France MEA Fragrance Ingredients Industry Revenue (Million) Forecast, by Application 2019 & 2032
- Table 50: Italy MEA Fragrance Ingredients Industry Revenue (Million) Forecast, by Application 2019 & 2032
- Table 51: Spain MEA Fragrance Ingredients Industry Revenue (Million) Forecast, by Application 2019 & 2032
- Table 52: Russia MEA Fragrance Ingredients Industry Revenue (Million) Forecast, by Application 2019 & 2032
- Table 53: Benelux MEA Fragrance Ingredients Industry Revenue (Million) Forecast, by Application 2019 & 2032
- Table 54: Nordics MEA Fragrance Ingredients Industry Revenue (Million) Forecast, by Application 2019 & 2032
- Table 55: Rest of Europe MEA Fragrance Ingredients Industry Revenue (Million) Forecast, by Application 2019 & 2032
- Table 56: Global MEA Fragrance Ingredients Industry Revenue Million Forecast, by Type 2019 & 2032
- Table 57: Global MEA Fragrance Ingredients Industry Revenue Million Forecast, by Application 2019 & 2032
- Table 58: Global MEA Fragrance Ingredients Industry Revenue Million Forecast, by Country 2019 & 2032
- Table 59: Turkey MEA Fragrance Ingredients Industry Revenue (Million) Forecast, by Application 2019 & 2032
- Table 60: Israel MEA Fragrance Ingredients Industry Revenue (Million) Forecast, by Application 2019 & 2032
- Table 61: GCC MEA Fragrance Ingredients Industry Revenue (Million) Forecast, by Application 2019 & 2032
- Table 62: North Africa MEA Fragrance Ingredients Industry Revenue (Million) Forecast, by Application 2019 & 2032
- Table 63: South Africa MEA Fragrance Ingredients Industry Revenue (Million) Forecast, by Application 2019 & 2032
- Table 64: Rest of Middle East & Africa MEA Fragrance Ingredients Industry Revenue (Million) Forecast, by Application 2019 & 2032
- Table 65: Global MEA Fragrance Ingredients Industry Revenue Million Forecast, by Type 2019 & 2032
- Table 66: Global MEA Fragrance Ingredients Industry Revenue Million Forecast, by Application 2019 & 2032
- Table 67: Global MEA Fragrance Ingredients Industry Revenue Million Forecast, by Country 2019 & 2032
- Table 68: China MEA Fragrance Ingredients Industry Revenue (Million) Forecast, by Application 2019 & 2032
- Table 69: India MEA Fragrance Ingredients Industry Revenue (Million) Forecast, by Application 2019 & 2032
- Table 70: Japan MEA Fragrance Ingredients Industry Revenue (Million) Forecast, by Application 2019 & 2032
- Table 71: South Korea MEA Fragrance Ingredients Industry Revenue (Million) Forecast, by Application 2019 & 2032
- Table 72: ASEAN MEA Fragrance Ingredients Industry Revenue (Million) Forecast, by Application 2019 & 2032
- Table 73: Oceania MEA Fragrance Ingredients Industry Revenue (Million) Forecast, by Application 2019 & 2032
- Table 74: Rest of Asia Pacific MEA Fragrance Ingredients Industry Revenue (Million) Forecast, by Application 2019 & 2032
Frequently Asked Questions
1. What is the projected Compound Annual Growth Rate (CAGR) of the MEA Fragrance Ingredients Industry?
The projected CAGR is approximately 6.75%.
2. Which companies are prominent players in the MEA Fragrance Ingredients Industry?
Key companies in the market include The Archer Daniels Midland Company, International Flavors & Fragrances Inc, Givaudan SA, Takasago International Corporation, Koninklijke DSM N V, MANE SA, Kerry Group PLC, Symrise AG, Sensient Technologies Corporation, Solvay SA*List Not Exhaustive.
3. What are the main segments of the MEA Fragrance Ingredients Industry?
The market segments include Type, Application.
4. Can you provide details about the market size?
The market size is estimated to be USD XX Million as of 2022.
5. What are some drivers contributing to market growth?
Demand for Convenient Ready-to-Eat Food Products; Growing Affinity Toward Ethnic and Organic Frozen Ready Meals.
6. What are the notable trends driving market growth?
Growing Demand for Natural Ingredients in the Region.
7. Are there any restraints impacting market growth?
Rising Concerns Over Food Safety and Quality.
8. Can you provide examples of recent developments in the market?
In May 2022, DSM and Firmenich announced they entered a business combination agreement to establish the leading creation and innovation partner in nutrition, beauty, and well-being ("DSM-Firmenich"). The combination will combine Firmenich's unique leading Perfumery and Taste businesses, world-class science platforms, and co-creation capabilities with DSM's outstanding Health and Nutrition portfolio and renowned scientific expertise.
9. What pricing options are available for accessing the report?
Pricing options include single-user, multi-user, and enterprise licenses priced at USD 4750, USD 5250, and USD 8750 respectively.
10. Is the market size provided in terms of value or volume?
The market size is provided in terms of value, measured in Million.
11. Are there any specific market keywords associated with the report?
Yes, the market keyword associated with the report is "MEA Fragrance Ingredients Industry," which aids in identifying and referencing the specific market segment covered.
12. How do I determine which pricing option suits my needs best?
The pricing options vary based on user requirements and access needs. Individual users may opt for single-user licenses, while businesses requiring broader access may choose multi-user or enterprise licenses for cost-effective access to the report.
13. Are there any additional resources or data provided in the MEA Fragrance Ingredients Industry report?
While the report offers comprehensive insights, it's advisable to review the specific contents or supplementary materials provided to ascertain if additional resources or data are available.
14. How can I stay updated on further developments or reports in the MEA Fragrance Ingredients Industry?
To stay informed about further developments, trends, and reports in the MEA Fragrance Ingredients Industry, consider subscribing to industry newsletters, following relevant companies and organizations, or regularly checking reputable industry news sources and publications.
Methodology
Step 1 - Identification of Relevant Samples Size from Population Database


Step 2 - Approaches for Defining Global Market Size (Value, Volume* & Price*)

Note*: In applicable scenarios
Step 3 - Data Sources
Primary Research
- Web Analytics
- Survey Reports
- Research Institute
- Latest Research Reports
- Opinion Leaders
Secondary Research
- Annual Reports
- White Paper
- Latest Press Release
- Industry Association
- Paid Database
- Investor Presentations

Step 4 - Data Triangulation
Involves using different sources of information in order to increase the validity of a study
These sources are likely to be stakeholders in a program - participants, other researchers, program staff, other community members, and so on.
Then we put all data in single framework & apply various statistical tools to find out the dynamic on the market.
During the analysis stage, feedback from the stakeholder groups would be compared to determine areas of agreement as well as areas of divergence
