

Key Insights
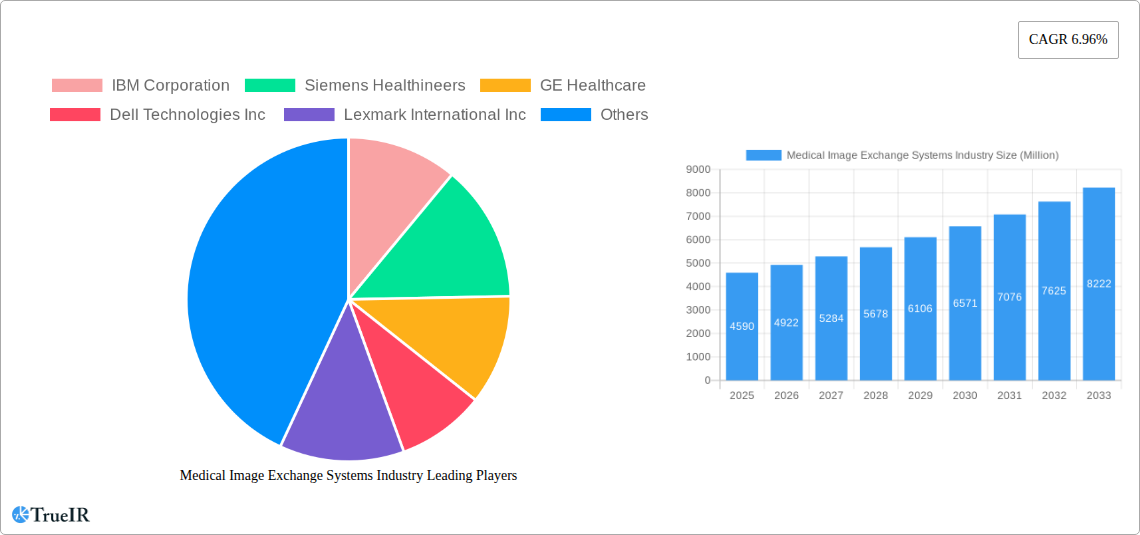
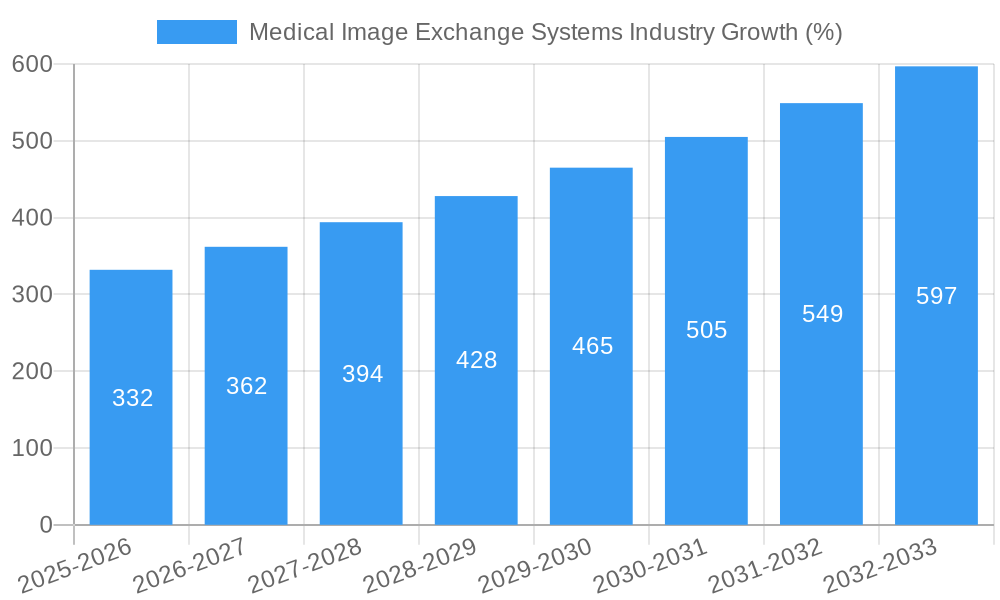
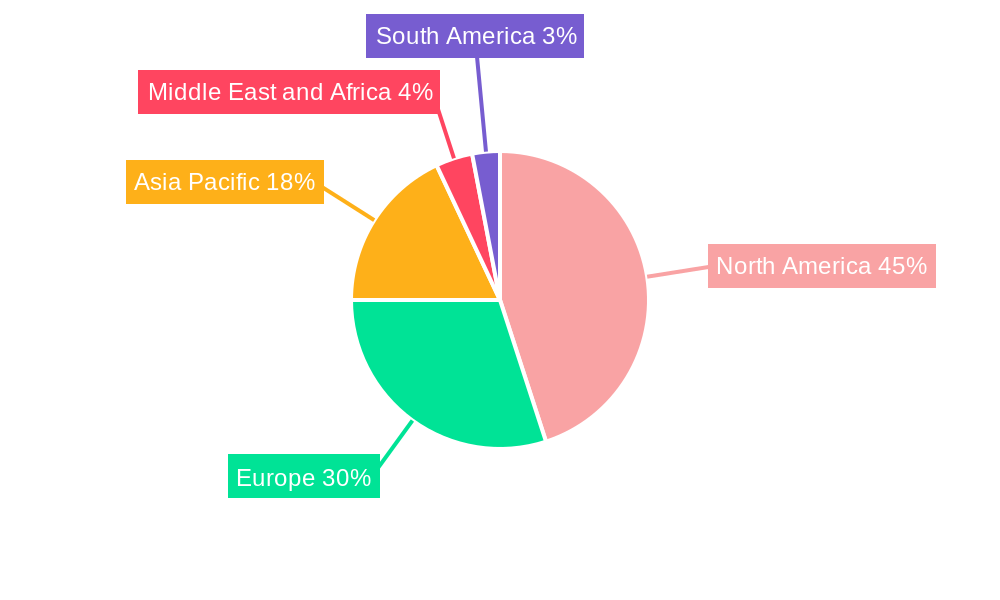
The medical image exchange systems market, valued at $4.59 billion in 2025, is projected to experience robust growth, driven by the increasing adoption of telehealth, the rising prevalence of chronic diseases requiring frequent imaging, and the growing demand for improved interoperability within healthcare systems. The market's Compound Annual Growth Rate (CAGR) of 6.96% from 2025 to 2033 indicates a significant expansion, fueled by technological advancements such as cloud-based solutions and artificial intelligence (AI) integration for enhanced image analysis and faster diagnostic capabilities. Key segments include Vendor Neutral Archives (VNAs) and Picture Archiving and Communication Systems (PACS), with hospitals and diagnostic centers representing the largest end-user segments. The competitive landscape includes established players like IBM, Siemens Healthineers, and GE Healthcare, alongside specialized software providers like BridgeHead Software and Novarad. North America currently holds a dominant market share due to advanced healthcare infrastructure and high technology adoption, however, Asia-Pacific is anticipated to exhibit the fastest growth rate due to increasing healthcare investments and expanding healthcare IT infrastructure. Regulatory pressures for data security and interoperability are expected to influence market growth, promoting the adoption of compliant and secure image exchange solutions. Future growth will depend on the continued expansion of telehealth, the increasing integration of AI in image analysis, and the development of innovative solutions that address the challenges of data security and interoperability across diverse healthcare systems.
The competitive landscape will continue to evolve with mergers, acquisitions, and the emergence of innovative solutions. Companies are focusing on developing solutions that offer improved scalability, security, and interoperability to meet the growing demands of healthcare providers. The market’s expansion will also be impacted by factors such as the cost of implementation and maintenance of these systems, along with the need for skilled professionals to manage and operate them. However, the long-term benefits in terms of improved patient care, enhanced diagnostic accuracy, and streamlined workflows will likely outweigh these challenges, ensuring continued growth within the medical image exchange systems market.
Medical Image Exchange Systems Industry: A Comprehensive Market Report (2019-2033)
This dynamic report provides a comprehensive analysis of the Medical Image Exchange Systems industry, offering invaluable insights for stakeholders seeking to navigate this rapidly evolving market. With a study period spanning 2019-2033, a base year of 2025, and a forecast period of 2025-2033, this report leverages extensive data analysis to predict future trends and opportunities. The market is projected to reach xx Million by 2033, exhibiting a CAGR of xx% during the forecast period.
Medical Image Exchange Systems Industry Market Structure & Competitive Landscape
The Medical Image Exchange Systems market is characterized by a moderately concentrated competitive landscape, with several key players vying for market share. The top 10 companies, including IBM Corporation, Siemens Healthineers, GE Healthcare, Dell Technologies Inc, Lexmark International Inc, BridgeHead Software, Koninklijke Philips NV, Carestream Health Inc (Onex Corporation), McKesson Corporation, and Novarad Corporation, hold a significant portion of the market. However, the emergence of smaller, agile companies specializing in niche solutions is also impacting the competitive dynamic. The Herfindahl-Hirschman Index (HHI) for the industry is estimated at xx, indicating a moderately concentrated market.
Key factors shaping the market structure:
- Innovation Drivers: Continuous advancements in technologies like AI, cloud computing, and big data analytics are driving product innovation and creating new opportunities.
- Regulatory Impacts: Stringent data privacy regulations (e.g., HIPAA) and interoperability standards influence market development and vendor strategies.
- Product Substitutes: The emergence of alternative technologies for image storage and transmission presents challenges to existing players.
- End-User Segmentation: The market is segmented by end-users such as Hospitals, Diagnostic Centers, and Ambulatory Surgery Centers, each with specific needs and purchasing patterns.
- M&A Trends: Consolidation within the industry through mergers and acquisitions (M&A) is expected to continue, with an estimated xx Million in M&A activity in 2024.
Medical Image Exchange Systems Industry Market Trends & Opportunities
The Medical Image Exchange Systems market is experiencing robust growth, driven by factors such as the rising prevalence of chronic diseases, technological advancements, and increasing demand for efficient healthcare solutions. The market size was valued at xx Million in 2024 and is projected to reach xx Million by 2033. Key trends shaping the market include:
- Technological Shifts: The adoption of cloud-based solutions, AI-powered image analysis, and advanced data security measures is reshaping the market landscape. The market penetration rate for cloud-based PACS systems is expected to reach xx% by 2033.
- Consumer Preferences: Healthcare providers increasingly favor vendor-neutral archives (VNAs) for enhanced interoperability and flexibility.
- Competitive Dynamics: The market is characterized by intense competition among established players and new entrants, leading to continuous innovation and price pressures.
Dominant Markets & Segments in Medical Image Exchange Systems Industry
The North American region currently dominates the Medical Image Exchange Systems market, driven by factors such as high healthcare expenditure, advanced technological infrastructure, and favorable regulatory environment. Within the segments:
End-User Dominance:
- Hospitals: The hospital segment holds the largest market share due to their high volume of image data and the need for sophisticated image management systems.
- Diagnostic Centers: Rapid growth in this segment is fueled by the increasing number of diagnostic imaging procedures.
- Ambulatory Surgery Centers: This segment exhibits moderate growth, driven by the increasing preference for outpatient surgeries.
System Dominance:
- Picture Archiving and Communication Systems (PACS): PACS remains a dominant system, although its market share is being challenged by VNAs and other integrated solutions.
- Vendor Neutral Archive (VNA): The adoption of VNAs is rapidly increasing due to their interoperability and flexibility.
- Other Systems: This segment includes specialized systems tailored for specific applications.
Key Growth Drivers:
- Advanced healthcare infrastructure
- Favorable government policies promoting interoperability and electronic health records (EHR) adoption
- Rising adoption of telemedicine
Medical Image Exchange Systems Industry Product Analysis
Significant product innovation in this sector revolves around cloud-based PACS systems, vendor-neutral archives (VNAs), and AI-driven image analytics. These advancements are improving image accessibility, enhancing diagnostic accuracy, and streamlining workflows. The market is witnessing a gradual shift towards integrated, interoperable solutions that break down data silos across healthcare organizations. This trend offers significant competitive advantages for vendors offering advanced, integrated platforms.
Key Drivers, Barriers & Challenges in Medical Image Exchange Systems Industry
Key Drivers:
The increasing volume of medical images generated, coupled with the need for efficient storage, retrieval, and analysis, is driving market growth. Government initiatives promoting interoperability, along with the adoption of cloud-based solutions and AI-powered diagnostics, are further fueling expansion.
Key Challenges:
High initial investment costs, integration complexities, data security concerns, and the need to maintain compliance with stringent regulations pose challenges to market growth. Supply chain disruptions have also impacted the availability of certain components, affecting product pricing and delivery times. Estimates suggest that supply chain issues caused a xx% delay in project implementations in 2024.
Growth Drivers in the Medical Image Exchange Systems Industry Market
Technological advancements (AI, cloud computing), increasing government investments in healthcare IT infrastructure, and a rising focus on improving healthcare interoperability are key drivers. The increasing volume of medical imaging data further fuels the demand for efficient and secure image exchange systems.
Challenges Impacting Medical Image Exchange Systems Industry Growth
Regulatory hurdles surrounding data privacy and interoperability, high initial investment costs associated with system implementation and upgrades, and intense competition among existing players pose significant challenges. Supply chain disruptions and the cybersecurity risk associated with handling sensitive patient data also present obstacles to market expansion.
Key Players Shaping the Medical Image Exchange Systems Industry Market
- IBM Corporation
- Siemens Healthineers
- GE Healthcare
- Dell Technologies Inc
- Lexmark International Inc
- BridgeHead Software
- Koninklijke Philips NV
- Carestream Health Inc (Onex Corporation)
- McKesson Corporation
- Novarad Corporation
- Agfa-Gevaert Group
- Fujifilm Holdings Corporation
Significant Medical Image Exchange Systems Industry Industry Milestones
- March 2022: Intelerad Medical Systems launched its new Enterprise Imaging and Informatics Suite at the 2022 HIMSS Global Health Conference & Exhibition. This launch significantly impacted the market by offering a vendor-neutral solution for integrating vital patient data across the healthcare ecosystem.
- March 2022: Philips introduced cloud-enabled enterprise imaging informatics and analytics solutions. The Philips Health Suite Interoperability launch strengthened their position in the cloud-based solutions market, improving workflow efficiency for many healthcare providers.
Future Outlook for Medical Image Exchange Systems Industry Market
The Medical Image Exchange Systems market is poised for continued growth, driven by technological innovation, increasing demand for efficient healthcare solutions, and government initiatives promoting interoperability. The market presents significant opportunities for vendors offering integrated, cloud-based solutions, particularly those incorporating AI-powered image analysis. Strategic partnerships and acquisitions will continue to reshape the competitive landscape.
Medical Image Exchange Systems Industry Segmentation
-
1. System
- 1.1. Vendor Neutral Archive
- 1.2. Picture Archiving and Communications System (PACS)
- 1.3. Other Systems
-
2. End-User
- 2.1. Hospitals
- 2.2. Diagnostic Centers
- 2.3. Ambulatory Surgery Centers
Medical Image Exchange Systems Industry Segmentation By Geography
-
1. North America
- 1.1. United States
- 1.2. Canada
- 1.3. Mexico
-
2. Europe
- 2.1. Germany
- 2.2. United Kingdom
- 2.3. France
- 2.4. Italy
- 2.5. Spain
- 2.6. Rest of Europe
-
3. Asia Pacific
- 3.1. China
- 3.2. Japan
- 3.3. India
- 3.4. Australia
- 3.5. South Korea
- 3.6. Rest of Asia Pacific
-
4. Middle East and Africa
- 4.1. GCC
- 4.2. South Africa
- 4.3. Rest of Middle East and Africa
-
5. South America
- 5.1. Brazil
- 5.2. Argentina
- 5.3. Rest of South America
Medical Image Exchange Systems Industry REPORT HIGHLIGHTS
| Aspects | Details |
|---|---|
| Study Period | 2019-2033 |
| Base Year | 2024 |
| Estimated Year | 2025 |
| Forecast Period | 2025-2033 |
| Historical Period | 2019-2024 |
| Growth Rate | CAGR of 6.96% from 2019-2033 |
| Segmentation |
|
Table of Contents
- 1. Introduction
- 1.1. Research Scope
- 1.2. Market Segmentation
- 1.3. Research Methodology
- 1.4. Definitions and Assumptions
- 2. Executive Summary
- 2.1. Introduction
- 3. Market Dynamics
- 3.1. Introduction
- 3.2. Market Drivers
- 3.2.1. Technological Innovations in the Diagnostic Imaging and Image Management; Rising Prevalence of Chronic Diseases; Emergence of Big Data in Healthcare
- 3.3. Market Restrains
- 3.3.1. Cost Associated With Implementation of Medical Imaging Management Solutions; Decrease In the Supply of SPECT and PET Systems due to the Shortage of Radioisotopes
- 3.4. Market Trends
- 3.4.1. Picture Archiving and Communications Systems (PACS) is Expected to Record Notable CAGR in the Market During the Forecast Period
- 4. Market Factor Analysis
- 4.1. Porters Five Forces
- 4.2. Supply/Value Chain
- 4.3. PESTEL analysis
- 4.4. Market Entropy
- 4.5. Patent/Trademark Analysis
- 5. Global Medical Image Exchange Systems Industry Analysis, Insights and Forecast, 2019-2031
- 5.1. Market Analysis, Insights and Forecast - by System
- 5.1.1. Vendor Neutral Archive
- 5.1.2. Picture Archiving and Communications System (PACS)
- 5.1.3. Other Systems
- 5.2. Market Analysis, Insights and Forecast - by End-User
- 5.2.1. Hospitals
- 5.2.2. Diagnostic Centers
- 5.2.3. Ambulatory Surgery Centers
- 5.3. Market Analysis, Insights and Forecast - by Region
- 5.3.1. North America
- 5.3.2. Europe
- 5.3.3. Asia Pacific
- 5.3.4. Middle East and Africa
- 5.3.5. South America
- 5.1. Market Analysis, Insights and Forecast - by System
- 6. North America Medical Image Exchange Systems Industry Analysis, Insights and Forecast, 2019-2031
- 6.1. Market Analysis, Insights and Forecast - by System
- 6.1.1. Vendor Neutral Archive
- 6.1.2. Picture Archiving and Communications System (PACS)
- 6.1.3. Other Systems
- 6.2. Market Analysis, Insights and Forecast - by End-User
- 6.2.1. Hospitals
- 6.2.2. Diagnostic Centers
- 6.2.3. Ambulatory Surgery Centers
- 6.1. Market Analysis, Insights and Forecast - by System
- 7. Europe Medical Image Exchange Systems Industry Analysis, Insights and Forecast, 2019-2031
- 7.1. Market Analysis, Insights and Forecast - by System
- 7.1.1. Vendor Neutral Archive
- 7.1.2. Picture Archiving and Communications System (PACS)
- 7.1.3. Other Systems
- 7.2. Market Analysis, Insights and Forecast - by End-User
- 7.2.1. Hospitals
- 7.2.2. Diagnostic Centers
- 7.2.3. Ambulatory Surgery Centers
- 7.1. Market Analysis, Insights and Forecast - by System
- 8. Asia Pacific Medical Image Exchange Systems Industry Analysis, Insights and Forecast, 2019-2031
- 8.1. Market Analysis, Insights and Forecast - by System
- 8.1.1. Vendor Neutral Archive
- 8.1.2. Picture Archiving and Communications System (PACS)
- 8.1.3. Other Systems
- 8.2. Market Analysis, Insights and Forecast - by End-User
- 8.2.1. Hospitals
- 8.2.2. Diagnostic Centers
- 8.2.3. Ambulatory Surgery Centers
- 8.1. Market Analysis, Insights and Forecast - by System
- 9. Middle East and Africa Medical Image Exchange Systems Industry Analysis, Insights and Forecast, 2019-2031
- 9.1. Market Analysis, Insights and Forecast - by System
- 9.1.1. Vendor Neutral Archive
- 9.1.2. Picture Archiving and Communications System (PACS)
- 9.1.3. Other Systems
- 9.2. Market Analysis, Insights and Forecast - by End-User
- 9.2.1. Hospitals
- 9.2.2. Diagnostic Centers
- 9.2.3. Ambulatory Surgery Centers
- 9.1. Market Analysis, Insights and Forecast - by System
- 10. South America Medical Image Exchange Systems Industry Analysis, Insights and Forecast, 2019-2031
- 10.1. Market Analysis, Insights and Forecast - by System
- 10.1.1. Vendor Neutral Archive
- 10.1.2. Picture Archiving and Communications System (PACS)
- 10.1.3. Other Systems
- 10.2. Market Analysis, Insights and Forecast - by End-User
- 10.2.1. Hospitals
- 10.2.2. Diagnostic Centers
- 10.2.3. Ambulatory Surgery Centers
- 10.1. Market Analysis, Insights and Forecast - by System
- 11. North America Medical Image Exchange Systems Industry Analysis, Insights and Forecast, 2019-2031
- 11.1. Market Analysis, Insights and Forecast - By Country/Sub-region
- 11.1.1 United States
- 11.1.2 Canada
- 11.1.3 Mexico
- 12. Europe Medical Image Exchange Systems Industry Analysis, Insights and Forecast, 2019-2031
- 12.1. Market Analysis, Insights and Forecast - By Country/Sub-region
- 12.1.1 Germany
- 12.1.2 United Kingdom
- 12.1.3 France
- 12.1.4 Italy
- 12.1.5 Spain
- 12.1.6 Rest of Europe
- 13. Asia Pacific Medical Image Exchange Systems Industry Analysis, Insights and Forecast, 2019-2031
- 13.1. Market Analysis, Insights and Forecast - By Country/Sub-region
- 13.1.1 China
- 13.1.2 Japan
- 13.1.3 India
- 13.1.4 Australia
- 13.1.5 South Korea
- 13.1.6 Rest of Asia Pacific
- 14. Middle East and Africa Medical Image Exchange Systems Industry Analysis, Insights and Forecast, 2019-2031
- 14.1. Market Analysis, Insights and Forecast - By Country/Sub-region
- 14.1.1 GCC
- 14.1.2 South Africa
- 14.1.3 Rest of Middle East and Africa
- 15. South America Medical Image Exchange Systems Industry Analysis, Insights and Forecast, 2019-2031
- 15.1. Market Analysis, Insights and Forecast - By Country/Sub-region
- 15.1.1 Brazil
- 15.1.2 Argentina
- 15.1.3 Rest of South America
- 16. Competitive Analysis
- 16.1. Global Market Share Analysis 2024
- 16.2. Company Profiles
- 16.2.1 IBM Corporation
- 16.2.1.1. Overview
- 16.2.1.2. Products
- 16.2.1.3. SWOT Analysis
- 16.2.1.4. Recent Developments
- 16.2.1.5. Financials (Based on Availability)
- 16.2.2 Siemens Healthineers
- 16.2.2.1. Overview
- 16.2.2.2. Products
- 16.2.2.3. SWOT Analysis
- 16.2.2.4. Recent Developments
- 16.2.2.5. Financials (Based on Availability)
- 16.2.3 GE Healthcare
- 16.2.3.1. Overview
- 16.2.3.2. Products
- 16.2.3.3. SWOT Analysis
- 16.2.3.4. Recent Developments
- 16.2.3.5. Financials (Based on Availability)
- 16.2.4 Dell Technologies Inc
- 16.2.4.1. Overview
- 16.2.4.2. Products
- 16.2.4.3. SWOT Analysis
- 16.2.4.4. Recent Developments
- 16.2.4.5. Financials (Based on Availability)
- 16.2.5 Lexmark International Inc
- 16.2.5.1. Overview
- 16.2.5.2. Products
- 16.2.5.3. SWOT Analysis
- 16.2.5.4. Recent Developments
- 16.2.5.5. Financials (Based on Availability)
- 16.2.6 BridgeHead Software
- 16.2.6.1. Overview
- 16.2.6.2. Products
- 16.2.6.3. SWOT Analysis
- 16.2.6.4. Recent Developments
- 16.2.6.5. Financials (Based on Availability)
- 16.2.7 Koninklijke Philips NV
- 16.2.7.1. Overview
- 16.2.7.2. Products
- 16.2.7.3. SWOT Analysis
- 16.2.7.4. Recent Developments
- 16.2.7.5. Financials (Based on Availability)
- 16.2.8 Carestream Health Inc (Onex Corporation)
- 16.2.8.1. Overview
- 16.2.8.2. Products
- 16.2.8.3. SWOT Analysis
- 16.2.8.4. Recent Developments
- 16.2.8.5. Financials (Based on Availability)
- 16.2.9 McKesson Corporation
- 16.2.9.1. Overview
- 16.2.9.2. Products
- 16.2.9.3. SWOT Analysis
- 16.2.9.4. Recent Developments
- 16.2.9.5. Financials (Based on Availability)
- 16.2.10 Novarad Corporation
- 16.2.10.1. Overview
- 16.2.10.2. Products
- 16.2.10.3. SWOT Analysis
- 16.2.10.4. Recent Developments
- 16.2.10.5. Financials (Based on Availability)
- 16.2.11 Agfa-Gevaert Group
- 16.2.11.1. Overview
- 16.2.11.2. Products
- 16.2.11.3. SWOT Analysis
- 16.2.11.4. Recent Developments
- 16.2.11.5. Financials (Based on Availability)
- 16.2.12 Fujifilm Holdings Corporation
- 16.2.12.1. Overview
- 16.2.12.2. Products
- 16.2.12.3. SWOT Analysis
- 16.2.12.4. Recent Developments
- 16.2.12.5. Financials (Based on Availability)
- 16.2.1 IBM Corporation
List of Figures
- Figure 1: Global Medical Image Exchange Systems Industry Revenue Breakdown (Million, %) by Region 2024 & 2032
- Figure 2: Global Medical Image Exchange Systems Industry Volume Breakdown (K Unit, %) by Region 2024 & 2032
- Figure 3: North America Medical Image Exchange Systems Industry Revenue (Million), by Country 2024 & 2032
- Figure 4: North America Medical Image Exchange Systems Industry Volume (K Unit), by Country 2024 & 2032
- Figure 5: North America Medical Image Exchange Systems Industry Revenue Share (%), by Country 2024 & 2032
- Figure 6: North America Medical Image Exchange Systems Industry Volume Share (%), by Country 2024 & 2032
- Figure 7: Europe Medical Image Exchange Systems Industry Revenue (Million), by Country 2024 & 2032
- Figure 8: Europe Medical Image Exchange Systems Industry Volume (K Unit), by Country 2024 & 2032
- Figure 9: Europe Medical Image Exchange Systems Industry Revenue Share (%), by Country 2024 & 2032
- Figure 10: Europe Medical Image Exchange Systems Industry Volume Share (%), by Country 2024 & 2032
- Figure 11: Asia Pacific Medical Image Exchange Systems Industry Revenue (Million), by Country 2024 & 2032
- Figure 12: Asia Pacific Medical Image Exchange Systems Industry Volume (K Unit), by Country 2024 & 2032
- Figure 13: Asia Pacific Medical Image Exchange Systems Industry Revenue Share (%), by Country 2024 & 2032
- Figure 14: Asia Pacific Medical Image Exchange Systems Industry Volume Share (%), by Country 2024 & 2032
- Figure 15: Middle East and Africa Medical Image Exchange Systems Industry Revenue (Million), by Country 2024 & 2032
- Figure 16: Middle East and Africa Medical Image Exchange Systems Industry Volume (K Unit), by Country 2024 & 2032
- Figure 17: Middle East and Africa Medical Image Exchange Systems Industry Revenue Share (%), by Country 2024 & 2032
- Figure 18: Middle East and Africa Medical Image Exchange Systems Industry Volume Share (%), by Country 2024 & 2032
- Figure 19: South America Medical Image Exchange Systems Industry Revenue (Million), by Country 2024 & 2032
- Figure 20: South America Medical Image Exchange Systems Industry Volume (K Unit), by Country 2024 & 2032
- Figure 21: South America Medical Image Exchange Systems Industry Revenue Share (%), by Country 2024 & 2032
- Figure 22: South America Medical Image Exchange Systems Industry Volume Share (%), by Country 2024 & 2032
- Figure 23: North America Medical Image Exchange Systems Industry Revenue (Million), by System 2024 & 2032
- Figure 24: North America Medical Image Exchange Systems Industry Volume (K Unit), by System 2024 & 2032
- Figure 25: North America Medical Image Exchange Systems Industry Revenue Share (%), by System 2024 & 2032
- Figure 26: North America Medical Image Exchange Systems Industry Volume Share (%), by System 2024 & 2032
- Figure 27: North America Medical Image Exchange Systems Industry Revenue (Million), by End-User 2024 & 2032
- Figure 28: North America Medical Image Exchange Systems Industry Volume (K Unit), by End-User 2024 & 2032
- Figure 29: North America Medical Image Exchange Systems Industry Revenue Share (%), by End-User 2024 & 2032
- Figure 30: North America Medical Image Exchange Systems Industry Volume Share (%), by End-User 2024 & 2032
- Figure 31: North America Medical Image Exchange Systems Industry Revenue (Million), by Country 2024 & 2032
- Figure 32: North America Medical Image Exchange Systems Industry Volume (K Unit), by Country 2024 & 2032
- Figure 33: North America Medical Image Exchange Systems Industry Revenue Share (%), by Country 2024 & 2032
- Figure 34: North America Medical Image Exchange Systems Industry Volume Share (%), by Country 2024 & 2032
- Figure 35: Europe Medical Image Exchange Systems Industry Revenue (Million), by System 2024 & 2032
- Figure 36: Europe Medical Image Exchange Systems Industry Volume (K Unit), by System 2024 & 2032
- Figure 37: Europe Medical Image Exchange Systems Industry Revenue Share (%), by System 2024 & 2032
- Figure 38: Europe Medical Image Exchange Systems Industry Volume Share (%), by System 2024 & 2032
- Figure 39: Europe Medical Image Exchange Systems Industry Revenue (Million), by End-User 2024 & 2032
- Figure 40: Europe Medical Image Exchange Systems Industry Volume (K Unit), by End-User 2024 & 2032
- Figure 41: Europe Medical Image Exchange Systems Industry Revenue Share (%), by End-User 2024 & 2032
- Figure 42: Europe Medical Image Exchange Systems Industry Volume Share (%), by End-User 2024 & 2032
- Figure 43: Europe Medical Image Exchange Systems Industry Revenue (Million), by Country 2024 & 2032
- Figure 44: Europe Medical Image Exchange Systems Industry Volume (K Unit), by Country 2024 & 2032
- Figure 45: Europe Medical Image Exchange Systems Industry Revenue Share (%), by Country 2024 & 2032
- Figure 46: Europe Medical Image Exchange Systems Industry Volume Share (%), by Country 2024 & 2032
- Figure 47: Asia Pacific Medical Image Exchange Systems Industry Revenue (Million), by System 2024 & 2032
- Figure 48: Asia Pacific Medical Image Exchange Systems Industry Volume (K Unit), by System 2024 & 2032
- Figure 49: Asia Pacific Medical Image Exchange Systems Industry Revenue Share (%), by System 2024 & 2032
- Figure 50: Asia Pacific Medical Image Exchange Systems Industry Volume Share (%), by System 2024 & 2032
- Figure 51: Asia Pacific Medical Image Exchange Systems Industry Revenue (Million), by End-User 2024 & 2032
- Figure 52: Asia Pacific Medical Image Exchange Systems Industry Volume (K Unit), by End-User 2024 & 2032
- Figure 53: Asia Pacific Medical Image Exchange Systems Industry Revenue Share (%), by End-User 2024 & 2032
- Figure 54: Asia Pacific Medical Image Exchange Systems Industry Volume Share (%), by End-User 2024 & 2032
- Figure 55: Asia Pacific Medical Image Exchange Systems Industry Revenue (Million), by Country 2024 & 2032
- Figure 56: Asia Pacific Medical Image Exchange Systems Industry Volume (K Unit), by Country 2024 & 2032
- Figure 57: Asia Pacific Medical Image Exchange Systems Industry Revenue Share (%), by Country 2024 & 2032
- Figure 58: Asia Pacific Medical Image Exchange Systems Industry Volume Share (%), by Country 2024 & 2032
- Figure 59: Middle East and Africa Medical Image Exchange Systems Industry Revenue (Million), by System 2024 & 2032
- Figure 60: Middle East and Africa Medical Image Exchange Systems Industry Volume (K Unit), by System 2024 & 2032
- Figure 61: Middle East and Africa Medical Image Exchange Systems Industry Revenue Share (%), by System 2024 & 2032
- Figure 62: Middle East and Africa Medical Image Exchange Systems Industry Volume Share (%), by System 2024 & 2032
- Figure 63: Middle East and Africa Medical Image Exchange Systems Industry Revenue (Million), by End-User 2024 & 2032
- Figure 64: Middle East and Africa Medical Image Exchange Systems Industry Volume (K Unit), by End-User 2024 & 2032
- Figure 65: Middle East and Africa Medical Image Exchange Systems Industry Revenue Share (%), by End-User 2024 & 2032
- Figure 66: Middle East and Africa Medical Image Exchange Systems Industry Volume Share (%), by End-User 2024 & 2032
- Figure 67: Middle East and Africa Medical Image Exchange Systems Industry Revenue (Million), by Country 2024 & 2032
- Figure 68: Middle East and Africa Medical Image Exchange Systems Industry Volume (K Unit), by Country 2024 & 2032
- Figure 69: Middle East and Africa Medical Image Exchange Systems Industry Revenue Share (%), by Country 2024 & 2032
- Figure 70: Middle East and Africa Medical Image Exchange Systems Industry Volume Share (%), by Country 2024 & 2032
- Figure 71: South America Medical Image Exchange Systems Industry Revenue (Million), by System 2024 & 2032
- Figure 72: South America Medical Image Exchange Systems Industry Volume (K Unit), by System 2024 & 2032
- Figure 73: South America Medical Image Exchange Systems Industry Revenue Share (%), by System 2024 & 2032
- Figure 74: South America Medical Image Exchange Systems Industry Volume Share (%), by System 2024 & 2032
- Figure 75: South America Medical Image Exchange Systems Industry Revenue (Million), by End-User 2024 & 2032
- Figure 76: South America Medical Image Exchange Systems Industry Volume (K Unit), by End-User 2024 & 2032
- Figure 77: South America Medical Image Exchange Systems Industry Revenue Share (%), by End-User 2024 & 2032
- Figure 78: South America Medical Image Exchange Systems Industry Volume Share (%), by End-User 2024 & 2032
- Figure 79: South America Medical Image Exchange Systems Industry Revenue (Million), by Country 2024 & 2032
- Figure 80: South America Medical Image Exchange Systems Industry Volume (K Unit), by Country 2024 & 2032
- Figure 81: South America Medical Image Exchange Systems Industry Revenue Share (%), by Country 2024 & 2032
- Figure 82: South America Medical Image Exchange Systems Industry Volume Share (%), by Country 2024 & 2032
List of Tables
- Table 1: Global Medical Image Exchange Systems Industry Revenue Million Forecast, by Region 2019 & 2032
- Table 2: Global Medical Image Exchange Systems Industry Volume K Unit Forecast, by Region 2019 & 2032
- Table 3: Global Medical Image Exchange Systems Industry Revenue Million Forecast, by System 2019 & 2032
- Table 4: Global Medical Image Exchange Systems Industry Volume K Unit Forecast, by System 2019 & 2032
- Table 5: Global Medical Image Exchange Systems Industry Revenue Million Forecast, by End-User 2019 & 2032
- Table 6: Global Medical Image Exchange Systems Industry Volume K Unit Forecast, by End-User 2019 & 2032
- Table 7: Global Medical Image Exchange Systems Industry Revenue Million Forecast, by Region 2019 & 2032
- Table 8: Global Medical Image Exchange Systems Industry Volume K Unit Forecast, by Region 2019 & 2032
- Table 9: Global Medical Image Exchange Systems Industry Revenue Million Forecast, by Country 2019 & 2032
- Table 10: Global Medical Image Exchange Systems Industry Volume K Unit Forecast, by Country 2019 & 2032
- Table 11: United States Medical Image Exchange Systems Industry Revenue (Million) Forecast, by Application 2019 & 2032
- Table 12: United States Medical Image Exchange Systems Industry Volume (K Unit) Forecast, by Application 2019 & 2032
- Table 13: Canada Medical Image Exchange Systems Industry Revenue (Million) Forecast, by Application 2019 & 2032
- Table 14: Canada Medical Image Exchange Systems Industry Volume (K Unit) Forecast, by Application 2019 & 2032
- Table 15: Mexico Medical Image Exchange Systems Industry Revenue (Million) Forecast, by Application 2019 & 2032
- Table 16: Mexico Medical Image Exchange Systems Industry Volume (K Unit) Forecast, by Application 2019 & 2032
- Table 17: Global Medical Image Exchange Systems Industry Revenue Million Forecast, by Country 2019 & 2032
- Table 18: Global Medical Image Exchange Systems Industry Volume K Unit Forecast, by Country 2019 & 2032
- Table 19: Germany Medical Image Exchange Systems Industry Revenue (Million) Forecast, by Application 2019 & 2032
- Table 20: Germany Medical Image Exchange Systems Industry Volume (K Unit) Forecast, by Application 2019 & 2032
- Table 21: United Kingdom Medical Image Exchange Systems Industry Revenue (Million) Forecast, by Application 2019 & 2032
- Table 22: United Kingdom Medical Image Exchange Systems Industry Volume (K Unit) Forecast, by Application 2019 & 2032
- Table 23: France Medical Image Exchange Systems Industry Revenue (Million) Forecast, by Application 2019 & 2032
- Table 24: France Medical Image Exchange Systems Industry Volume (K Unit) Forecast, by Application 2019 & 2032
- Table 25: Italy Medical Image Exchange Systems Industry Revenue (Million) Forecast, by Application 2019 & 2032
- Table 26: Italy Medical Image Exchange Systems Industry Volume (K Unit) Forecast, by Application 2019 & 2032
- Table 27: Spain Medical Image Exchange Systems Industry Revenue (Million) Forecast, by Application 2019 & 2032
- Table 28: Spain Medical Image Exchange Systems Industry Volume (K Unit) Forecast, by Application 2019 & 2032
- Table 29: Rest of Europe Medical Image Exchange Systems Industry Revenue (Million) Forecast, by Application 2019 & 2032
- Table 30: Rest of Europe Medical Image Exchange Systems Industry Volume (K Unit) Forecast, by Application 2019 & 2032
- Table 31: Global Medical Image Exchange Systems Industry Revenue Million Forecast, by Country 2019 & 2032
- Table 32: Global Medical Image Exchange Systems Industry Volume K Unit Forecast, by Country 2019 & 2032
- Table 33: China Medical Image Exchange Systems Industry Revenue (Million) Forecast, by Application 2019 & 2032
- Table 34: China Medical Image Exchange Systems Industry Volume (K Unit) Forecast, by Application 2019 & 2032
- Table 35: Japan Medical Image Exchange Systems Industry Revenue (Million) Forecast, by Application 2019 & 2032
- Table 36: Japan Medical Image Exchange Systems Industry Volume (K Unit) Forecast, by Application 2019 & 2032
- Table 37: India Medical Image Exchange Systems Industry Revenue (Million) Forecast, by Application 2019 & 2032
- Table 38: India Medical Image Exchange Systems Industry Volume (K Unit) Forecast, by Application 2019 & 2032
- Table 39: Australia Medical Image Exchange Systems Industry Revenue (Million) Forecast, by Application 2019 & 2032
- Table 40: Australia Medical Image Exchange Systems Industry Volume (K Unit) Forecast, by Application 2019 & 2032
- Table 41: South Korea Medical Image Exchange Systems Industry Revenue (Million) Forecast, by Application 2019 & 2032
- Table 42: South Korea Medical Image Exchange Systems Industry Volume (K Unit) Forecast, by Application 2019 & 2032
- Table 43: Rest of Asia Pacific Medical Image Exchange Systems Industry Revenue (Million) Forecast, by Application 2019 & 2032
- Table 44: Rest of Asia Pacific Medical Image Exchange Systems Industry Volume (K Unit) Forecast, by Application 2019 & 2032
- Table 45: Global Medical Image Exchange Systems Industry Revenue Million Forecast, by Country 2019 & 2032
- Table 46: Global Medical Image Exchange Systems Industry Volume K Unit Forecast, by Country 2019 & 2032
- Table 47: GCC Medical Image Exchange Systems Industry Revenue (Million) Forecast, by Application 2019 & 2032
- Table 48: GCC Medical Image Exchange Systems Industry Volume (K Unit) Forecast, by Application 2019 & 2032
- Table 49: South Africa Medical Image Exchange Systems Industry Revenue (Million) Forecast, by Application 2019 & 2032
- Table 50: South Africa Medical Image Exchange Systems Industry Volume (K Unit) Forecast, by Application 2019 & 2032
- Table 51: Rest of Middle East and Africa Medical Image Exchange Systems Industry Revenue (Million) Forecast, by Application 2019 & 2032
- Table 52: Rest of Middle East and Africa Medical Image Exchange Systems Industry Volume (K Unit) Forecast, by Application 2019 & 2032
- Table 53: Global Medical Image Exchange Systems Industry Revenue Million Forecast, by Country 2019 & 2032
- Table 54: Global Medical Image Exchange Systems Industry Volume K Unit Forecast, by Country 2019 & 2032
- Table 55: Brazil Medical Image Exchange Systems Industry Revenue (Million) Forecast, by Application 2019 & 2032
- Table 56: Brazil Medical Image Exchange Systems Industry Volume (K Unit) Forecast, by Application 2019 & 2032
- Table 57: Argentina Medical Image Exchange Systems Industry Revenue (Million) Forecast, by Application 2019 & 2032
- Table 58: Argentina Medical Image Exchange Systems Industry Volume (K Unit) Forecast, by Application 2019 & 2032
- Table 59: Rest of South America Medical Image Exchange Systems Industry Revenue (Million) Forecast, by Application 2019 & 2032
- Table 60: Rest of South America Medical Image Exchange Systems Industry Volume (K Unit) Forecast, by Application 2019 & 2032
- Table 61: Global Medical Image Exchange Systems Industry Revenue Million Forecast, by System 2019 & 2032
- Table 62: Global Medical Image Exchange Systems Industry Volume K Unit Forecast, by System 2019 & 2032
- Table 63: Global Medical Image Exchange Systems Industry Revenue Million Forecast, by End-User 2019 & 2032
- Table 64: Global Medical Image Exchange Systems Industry Volume K Unit Forecast, by End-User 2019 & 2032
- Table 65: Global Medical Image Exchange Systems Industry Revenue Million Forecast, by Country 2019 & 2032
- Table 66: Global Medical Image Exchange Systems Industry Volume K Unit Forecast, by Country 2019 & 2032
- Table 67: United States Medical Image Exchange Systems Industry Revenue (Million) Forecast, by Application 2019 & 2032
- Table 68: United States Medical Image Exchange Systems Industry Volume (K Unit) Forecast, by Application 2019 & 2032
- Table 69: Canada Medical Image Exchange Systems Industry Revenue (Million) Forecast, by Application 2019 & 2032
- Table 70: Canada Medical Image Exchange Systems Industry Volume (K Unit) Forecast, by Application 2019 & 2032
- Table 71: Mexico Medical Image Exchange Systems Industry Revenue (Million) Forecast, by Application 2019 & 2032
- Table 72: Mexico Medical Image Exchange Systems Industry Volume (K Unit) Forecast, by Application 2019 & 2032
- Table 73: Global Medical Image Exchange Systems Industry Revenue Million Forecast, by System 2019 & 2032
- Table 74: Global Medical Image Exchange Systems Industry Volume K Unit Forecast, by System 2019 & 2032
- Table 75: Global Medical Image Exchange Systems Industry Revenue Million Forecast, by End-User 2019 & 2032
- Table 76: Global Medical Image Exchange Systems Industry Volume K Unit Forecast, by End-User 2019 & 2032
- Table 77: Global Medical Image Exchange Systems Industry Revenue Million Forecast, by Country 2019 & 2032
- Table 78: Global Medical Image Exchange Systems Industry Volume K Unit Forecast, by Country 2019 & 2032
- Table 79: Germany Medical Image Exchange Systems Industry Revenue (Million) Forecast, by Application 2019 & 2032
- Table 80: Germany Medical Image Exchange Systems Industry Volume (K Unit) Forecast, by Application 2019 & 2032
- Table 81: United Kingdom Medical Image Exchange Systems Industry Revenue (Million) Forecast, by Application 2019 & 2032
- Table 82: United Kingdom Medical Image Exchange Systems Industry Volume (K Unit) Forecast, by Application 2019 & 2032
- Table 83: France Medical Image Exchange Systems Industry Revenue (Million) Forecast, by Application 2019 & 2032
- Table 84: France Medical Image Exchange Systems Industry Volume (K Unit) Forecast, by Application 2019 & 2032
- Table 85: Italy Medical Image Exchange Systems Industry Revenue (Million) Forecast, by Application 2019 & 2032
- Table 86: Italy Medical Image Exchange Systems Industry Volume (K Unit) Forecast, by Application 2019 & 2032
- Table 87: Spain Medical Image Exchange Systems Industry Revenue (Million) Forecast, by Application 2019 & 2032
- Table 88: Spain Medical Image Exchange Systems Industry Volume (K Unit) Forecast, by Application 2019 & 2032
- Table 89: Rest of Europe Medical Image Exchange Systems Industry Revenue (Million) Forecast, by Application 2019 & 2032
- Table 90: Rest of Europe Medical Image Exchange Systems Industry Volume (K Unit) Forecast, by Application 2019 & 2032
- Table 91: Global Medical Image Exchange Systems Industry Revenue Million Forecast, by System 2019 & 2032
- Table 92: Global Medical Image Exchange Systems Industry Volume K Unit Forecast, by System 2019 & 2032
- Table 93: Global Medical Image Exchange Systems Industry Revenue Million Forecast, by End-User 2019 & 2032
- Table 94: Global Medical Image Exchange Systems Industry Volume K Unit Forecast, by End-User 2019 & 2032
- Table 95: Global Medical Image Exchange Systems Industry Revenue Million Forecast, by Country 2019 & 2032
- Table 96: Global Medical Image Exchange Systems Industry Volume K Unit Forecast, by Country 2019 & 2032
- Table 97: China Medical Image Exchange Systems Industry Revenue (Million) Forecast, by Application 2019 & 2032
- Table 98: China Medical Image Exchange Systems Industry Volume (K Unit) Forecast, by Application 2019 & 2032
- Table 99: Japan Medical Image Exchange Systems Industry Revenue (Million) Forecast, by Application 2019 & 2032
- Table 100: Japan Medical Image Exchange Systems Industry Volume (K Unit) Forecast, by Application 2019 & 2032
- Table 101: India Medical Image Exchange Systems Industry Revenue (Million) Forecast, by Application 2019 & 2032
- Table 102: India Medical Image Exchange Systems Industry Volume (K Unit) Forecast, by Application 2019 & 2032
- Table 103: Australia Medical Image Exchange Systems Industry Revenue (Million) Forecast, by Application 2019 & 2032
- Table 104: Australia Medical Image Exchange Systems Industry Volume (K Unit) Forecast, by Application 2019 & 2032
- Table 105: South Korea Medical Image Exchange Systems Industry Revenue (Million) Forecast, by Application 2019 & 2032
- Table 106: South Korea Medical Image Exchange Systems Industry Volume (K Unit) Forecast, by Application 2019 & 2032
- Table 107: Rest of Asia Pacific Medical Image Exchange Systems Industry Revenue (Million) Forecast, by Application 2019 & 2032
- Table 108: Rest of Asia Pacific Medical Image Exchange Systems Industry Volume (K Unit) Forecast, by Application 2019 & 2032
- Table 109: Global Medical Image Exchange Systems Industry Revenue Million Forecast, by System 2019 & 2032
- Table 110: Global Medical Image Exchange Systems Industry Volume K Unit Forecast, by System 2019 & 2032
- Table 111: Global Medical Image Exchange Systems Industry Revenue Million Forecast, by End-User 2019 & 2032
- Table 112: Global Medical Image Exchange Systems Industry Volume K Unit Forecast, by End-User 2019 & 2032
- Table 113: Global Medical Image Exchange Systems Industry Revenue Million Forecast, by Country 2019 & 2032
- Table 114: Global Medical Image Exchange Systems Industry Volume K Unit Forecast, by Country 2019 & 2032
- Table 115: GCC Medical Image Exchange Systems Industry Revenue (Million) Forecast, by Application 2019 & 2032
- Table 116: GCC Medical Image Exchange Systems Industry Volume (K Unit) Forecast, by Application 2019 & 2032
- Table 117: South Africa Medical Image Exchange Systems Industry Revenue (Million) Forecast, by Application 2019 & 2032
- Table 118: South Africa Medical Image Exchange Systems Industry Volume (K Unit) Forecast, by Application 2019 & 2032
- Table 119: Rest of Middle East and Africa Medical Image Exchange Systems Industry Revenue (Million) Forecast, by Application 2019 & 2032
- Table 120: Rest of Middle East and Africa Medical Image Exchange Systems Industry Volume (K Unit) Forecast, by Application 2019 & 2032
- Table 121: Global Medical Image Exchange Systems Industry Revenue Million Forecast, by System 2019 & 2032
- Table 122: Global Medical Image Exchange Systems Industry Volume K Unit Forecast, by System 2019 & 2032
- Table 123: Global Medical Image Exchange Systems Industry Revenue Million Forecast, by End-User 2019 & 2032
- Table 124: Global Medical Image Exchange Systems Industry Volume K Unit Forecast, by End-User 2019 & 2032
- Table 125: Global Medical Image Exchange Systems Industry Revenue Million Forecast, by Country 2019 & 2032
- Table 126: Global Medical Image Exchange Systems Industry Volume K Unit Forecast, by Country 2019 & 2032
- Table 127: Brazil Medical Image Exchange Systems Industry Revenue (Million) Forecast, by Application 2019 & 2032
- Table 128: Brazil Medical Image Exchange Systems Industry Volume (K Unit) Forecast, by Application 2019 & 2032
- Table 129: Argentina Medical Image Exchange Systems Industry Revenue (Million) Forecast, by Application 2019 & 2032
- Table 130: Argentina Medical Image Exchange Systems Industry Volume (K Unit) Forecast, by Application 2019 & 2032
- Table 131: Rest of South America Medical Image Exchange Systems Industry Revenue (Million) Forecast, by Application 2019 & 2032
- Table 132: Rest of South America Medical Image Exchange Systems Industry Volume (K Unit) Forecast, by Application 2019 & 2032
Frequently Asked Questions
1. What is the projected Compound Annual Growth Rate (CAGR) of the Medical Image Exchange Systems Industry?
The projected CAGR is approximately 6.96%.
2. Which companies are prominent players in the Medical Image Exchange Systems Industry?
Key companies in the market include IBM Corporation, Siemens Healthineers, GE Healthcare, Dell Technologies Inc , Lexmark International Inc, BridgeHead Software, Koninklijke Philips NV, Carestream Health Inc (Onex Corporation), McKesson Corporation, Novarad Corporation, Agfa-Gevaert Group, Fujifilm Holdings Corporation.
3. What are the main segments of the Medical Image Exchange Systems Industry?
The market segments include System, End-User.
4. Can you provide details about the market size?
The market size is estimated to be USD 4.59 Million as of 2022.
5. What are some drivers contributing to market growth?
Technological Innovations in the Diagnostic Imaging and Image Management; Rising Prevalence of Chronic Diseases; Emergence of Big Data in Healthcare.
6. What are the notable trends driving market growth?
Picture Archiving and Communications Systems (PACS) is Expected to Record Notable CAGR in the Market During the Forecast Period.
7. Are there any restraints impacting market growth?
Cost Associated With Implementation of Medical Imaging Management Solutions; Decrease In the Supply of SPECT and PET Systems due to the Shortage of Radioisotopes.
8. Can you provide examples of recent developments in the market?
March 2022: Intelerad Medical Systems launched its new Enterprise Imaging and Informatics Suite at the 2022 HIMSS Global Health Conference & Exhibition. Intelerad's suite empowers hospitals and health systems to break down siloed data and create a seamless, vendor-neutral information hub, integrating vital patient data across the entire healthcare ecosystem.
9. What pricing options are available for accessing the report?
Pricing options include single-user, multi-user, and enterprise licenses priced at USD 4750, USD 5250, and USD 8750 respectively.
10. Is the market size provided in terms of value or volume?
The market size is provided in terms of value, measured in Million and volume, measured in K Unit.
11. Are there any specific market keywords associated with the report?
Yes, the market keyword associated with the report is "Medical Image Exchange Systems Industry," which aids in identifying and referencing the specific market segment covered.
12. How do I determine which pricing option suits my needs best?
The pricing options vary based on user requirements and access needs. Individual users may opt for single-user licenses, while businesses requiring broader access may choose multi-user or enterprise licenses for cost-effective access to the report.
13. Are there any additional resources or data provided in the Medical Image Exchange Systems Industry report?
While the report offers comprehensive insights, it's advisable to review the specific contents or supplementary materials provided to ascertain if additional resources or data are available.
14. How can I stay updated on further developments or reports in the Medical Image Exchange Systems Industry?
To stay informed about further developments, trends, and reports in the Medical Image Exchange Systems Industry, consider subscribing to industry newsletters, following relevant companies and organizations, or regularly checking reputable industry news sources and publications.
Methodology
Step 1 - Identification of Relevant Samples Size from Population Database


Step 2 - Approaches for Defining Global Market Size (Value, Volume* & Price*)

Note*: In applicable scenarios
Step 3 - Data Sources
Primary Research
- Web Analytics
- Survey Reports
- Research Institute
- Latest Research Reports
- Opinion Leaders
Secondary Research
- Annual Reports
- White Paper
- Latest Press Release
- Industry Association
- Paid Database
- Investor Presentations

Step 4 - Data Triangulation
Involves using different sources of information in order to increase the validity of a study
These sources are likely to be stakeholders in a program - participants, other researchers, program staff, other community members, and so on.
Then we put all data in single framework & apply various statistical tools to find out the dynamic on the market.
During the analysis stage, feedback from the stakeholder groups would be compared to determine areas of agreement as well as areas of divergence
