

Key Insights
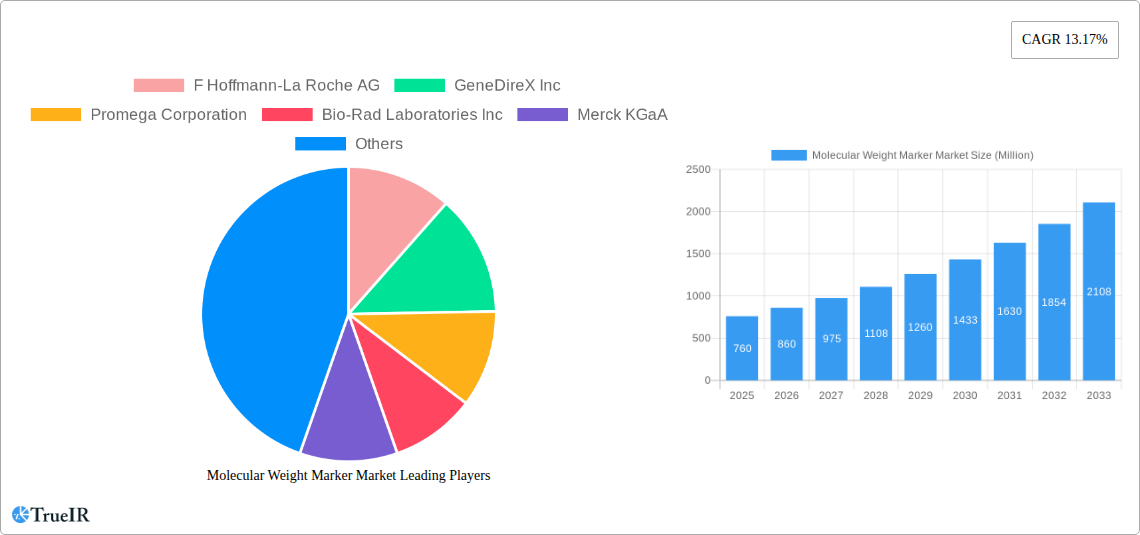
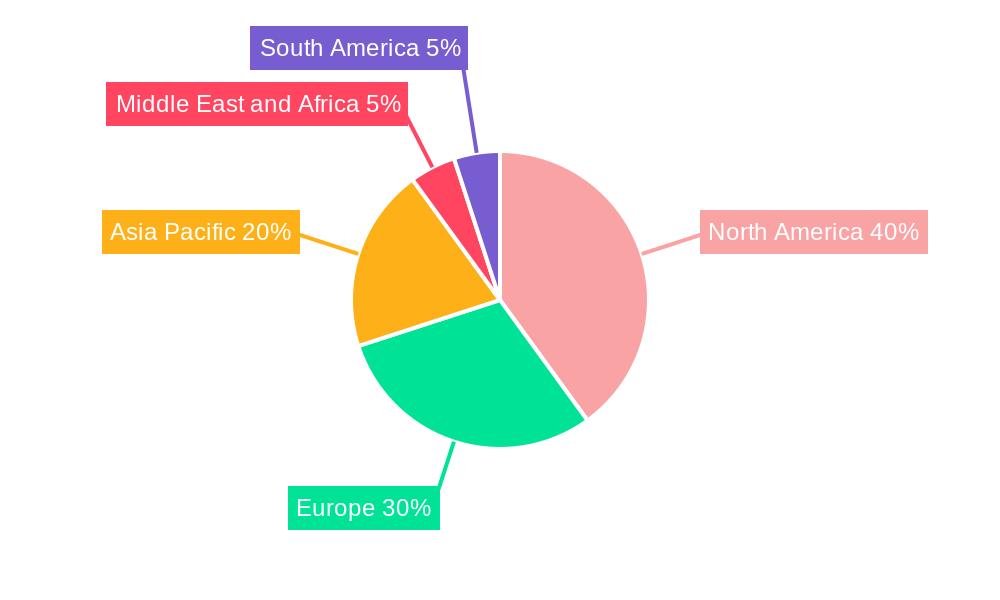
The global molecular weight marker market, valued at $0.76 billion in 2025, is poised for robust growth, exhibiting a Compound Annual Growth Rate (CAGR) of 13.17% from 2025 to 2033. This expansion is driven by several key factors. The increasing prevalence of life science research, particularly in genomics and proteomics, fuels demand for accurate and reliable molecular weight markers. Advancements in biotechnology, including the development of more sensitive and specific markers, further contribute to market growth. Furthermore, the rising adoption of sophisticated analytical techniques like PCR, Western blotting, and next-generation sequencing necessitates the use of high-quality molecular weight markers for accurate data interpretation. The market is segmented by product type (DNA, RNA, and protein markers), application (nucleic acid and proteomics applications), and type (prestained, unstained, and specialty markers). Prestained markers are expected to dominate due to their ease of use and visual convenience, simplifying experimental workflows. The proteomics application segment, characterized by the growth of personalized medicine and drug discovery, is projected to experience significant growth. Geographically, North America and Europe currently hold substantial market shares, attributed to the strong presence of established research institutions and biotechnology companies. However, the Asia-Pacific region is anticipated to witness the fastest growth, fueled by rising investments in research and development infrastructure and a growing scientific community. Competitive dynamics are characterized by the presence of several key players, including F. Hoffmann-La Roche AG, Promega Corporation, Bio-Rad Laboratories Inc., and Thermo Fisher Scientific Inc., all of which are investing in innovation and expanding their product portfolios to maintain a competitive edge.
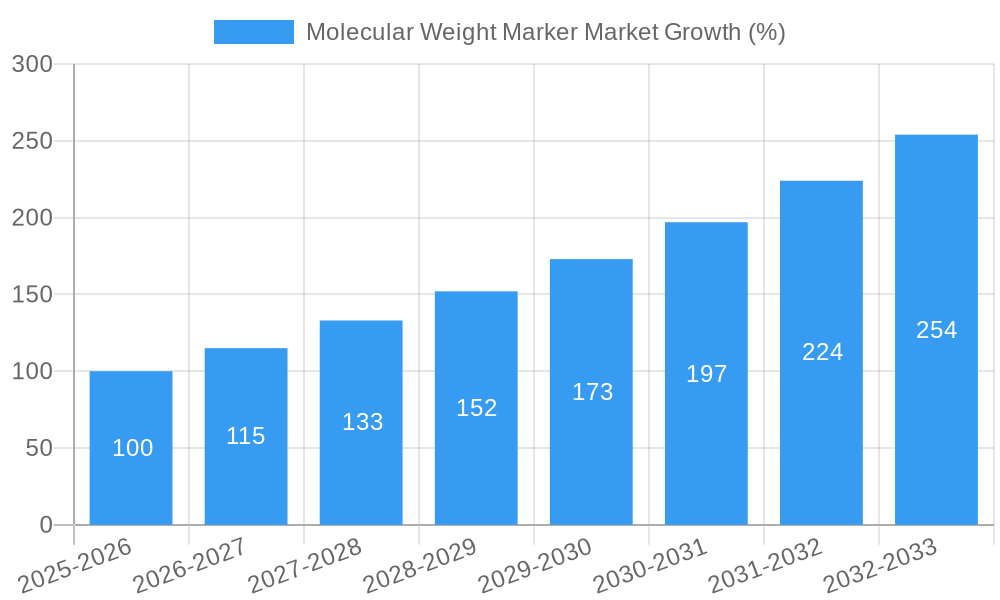
The market's sustained growth trajectory is expected to continue through 2033, fueled by ongoing advancements in molecular biology techniques and the expanding applications of molecular weight markers across diverse research and clinical settings. The increasing demand for higher throughput assays and automation in laboratories is likely to drive the adoption of innovative marker formats. Furthermore, the rising focus on personalized medicine, targeted therapies, and diagnostics is creating new opportunities for molecular weight markers in clinical applications. However, challenges such as stringent regulatory approvals and the potential for high costs associated with advanced marker technologies could influence market growth. Nonetheless, the overall outlook for the molecular weight marker market remains optimistic, indicating considerable potential for expansion and innovation in the coming years.
Molecular Weight Marker Market: A Comprehensive Market Report (2019-2033)
This dynamic report provides a detailed analysis of the global Molecular Weight Marker market, offering invaluable insights for stakeholders across the life sciences industry. Covering the period from 2019 to 2033, with a focus on 2025, this research delves into market size, segmentation, competitive dynamics, and future growth prospects. Leveraging extensive data and expert analysis, the report equips businesses with the knowledge needed to navigate the evolving landscape of molecular biology research.
Molecular Weight Marker Market Market Structure & Competitive Landscape
The molecular weight marker market is moderately concentrated, with several key players holding significant market share. The market structure is influenced by factors such as ongoing innovation in marker technology, stringent regulatory approvals, the availability of substitute products (e.g., alternative sizing methods), and diverse end-user segmentation spanning academic research, pharmaceutical companies, and biotechnology firms. Mergers and acquisitions (M&A) activity has been moderate, with strategic acquisitions aimed at expanding product portfolios and strengthening market positions. For example, the acquisition of Curiosity Diagnostics by Bio-Rad Laboratories in August 2022 exemplifies this trend. We estimate a concentration ratio (CR4) of approximately 40% for the major players, indicating a moderately competitive landscape. The market is characterized by intense competition based on product quality, pricing, and technological advancements.
- High concentration ratio (CR4): Approximately 40% in 2025
- Innovation drivers: Development of advanced marker technologies, including next-generation sequencing (NGS) compatible markers
- Regulatory impacts: Stringent quality control and regulatory approvals for in-vitro diagnostics (IVDs)
- Product substitutes: Limited but emerging alternatives like mass spectrometry-based sizing methods
- End-user segmentation: Strong demand from research institutions, pharmaceutical/biotech companies, and clinical diagnostics labs
- M&A trends: Strategic acquisitions to expand product lines and geographic reach. Estimated xx M&A deals between 2019-2024.
Molecular Weight Marker Market Market Trends & Opportunities
The global molecular weight marker market is experiencing significant growth, driven by the expanding life sciences research sector, increased adoption of molecular biology techniques in drug discovery and development, and the growing demand for precise and reliable molecular weight determination. We project a compound annual growth rate (CAGR) of xx% during the forecast period (2025-2033). Market penetration rates are high in developed regions, with growth opportunities increasingly concentrated in emerging economies. Technological advancements, such as the development of multiplexed markers and improved labeling techniques, are enhancing the performance and versatility of molecular weight markers. This fuels market growth, as researchers seek highly sensitive, accurate, and convenient tools for their applications. Consumer preferences are increasingly focused on user-friendliness, cost-effectiveness, and high-throughput capabilities. Competitive dynamics are shaped by ongoing innovation, strategic partnerships, and the introduction of novel products. The market is expected to reach xx Million by 2033.
Dominant Markets & Segments in Molecular Weight Marker Market
The North American region holds the largest market share, driven by robust research funding and a well-established biotechnology sector. Within the segments, DNA markers currently dominate, owing to their extensive use in various molecular biology applications such as PCR, cloning, and other nucleic acid-based research. The prestained marker segment enjoys high demand due to its convenience and time-saving characteristics.
- Leading Region: North America
- Leading Product Segment: DNA Markers (xx Million in 2025)
- Leading Application Segment: Nucleic Acid Applications (PCR, Southern blotting, etc.)
- Leading Type Segment: Prestained Markers
Key Growth Drivers:
- Robust funding for life sciences research in developed regions.
- Growing adoption of advanced molecular biology techniques across various sectors.
- Rising demand for higher throughput screening and analysis in research and diagnostics.
- Favorable regulatory frameworks supporting innovation in life sciences.
Molecular Weight Marker Market Product Analysis
The market offers a diverse range of molecular weight markers, catering to various applications and experimental needs. Products are categorized by type (DNA, RNA, and protein markers), format (prestained and unstained), and application-specific design (e.g., markers optimized for specific electrophoresis systems). Ongoing technological advancements focus on improved resolution, enhanced sensitivity, and broader compatibility across different platforms. The incorporation of novel dyes and labeling techniques, along with streamlined manufacturing processes, contributes to superior product quality, user-friendliness, and affordability. This directly impacts market competitiveness and acceptance, making the products suitable for both research and clinical diagnostics.
Key Drivers, Barriers & Challenges in Molecular Weight Marker Market
Key Drivers:
The market is propelled by the increasing demand for high-throughput screening and advanced analytical tools in genomics, proteomics, and other related fields. Furthermore, government funding for life sciences research and the growing adoption of molecular biology techniques across academic institutions and the pharmaceutical/biotech sectors act as key growth drivers.
Challenges:
The market faces challenges such as the high cost associated with some specialized markers, the availability of potential substitutes (although limited), and stringent regulatory requirements for IVD applications. Supply chain disruptions and intense competition also represent ongoing challenges. The estimated impact of these challenges on market growth is approximately xx% reduction by 2033.
Growth Drivers in the Molecular Weight Marker Market Market
The expansion of the genomics and proteomics fields, coupled with the rising demand for high-throughput screening tools, fuels significant market growth. Advancements in marker technology, such as the development of fluorescently labeled markers and improved separation techniques, further accelerate market adoption. The increased funding for life sciences research from both government and private sectors also contributes significantly to growth.
Challenges Impacting Molecular Weight Marker Market Growth
Stringent regulatory requirements for in-vitro diagnostic (IVD) products pose a major challenge, increasing development and approval timelines. Supply chain disruptions and the volatility of raw material prices negatively impact production costs and market stability. Moreover, the potential emergence of cost-effective alternatives could affect market growth and product demand in the long run.
Key Players Shaping the Molecular Weight Marker Market Market
- F Hoffmann-La Roche AG
- GeneDireX Inc
- Promega Corporation
- Bio-Rad Laboratories Inc
- Merck KGaA
- Thermo Fisher Scientific Inc
- New England Biolabs
- VWR International
- Takara Bio Inc
- QIAGEN N V
- Agilent Technologies Inc
- HiMedia Laboratories
Significant Molecular Weight Marker Market Industry Milestones
- August 2022: Bio-Rad Laboratories, Inc. acquired Curiosity Diagnostics, expanding its molecular diagnostics portfolio.
- November 2022: Creative Enzymes launched a new line of cost-effective DNA markers, gaining rapid market traction.
Future Outlook for Molecular Weight Marker Market Market
The molecular weight marker market is poised for sustained growth, driven by technological advancements in marker design, increased adoption of automation in molecular biology labs, and the continued expansion of life sciences research. Strategic partnerships and collaborations between marker manufacturers and research institutions will further fuel market development. The development of novel, application-specific markers and the integration of advanced data analysis tools will create exciting new market opportunities. Overall, the long-term prospects for the molecular weight marker market remain positive, offering significant potential for growth and innovation.
Molecular Weight Marker Market Segmentation
-
1. Product
- 1.1. DNA Marker
- 1.2. Protein Marker
- 1.3. RNA Marker
-
2. Application
- 2.1. Nucleic
- 2.2. Proteomi
-
3. Type
- 3.1. Prestained Marker
- 3.2. Unstained Marker
- 3.3. Specialty Marker
Molecular Weight Marker Market Segmentation By Geography
-
1. North America
- 1.1. United States
- 1.2. Canada
- 1.3. Mexico
-
2. Europe
- 2.1. Germany
- 2.2. United Kingdom
- 2.3. France
- 2.4. Italy
- 2.5. Spain
- 2.6. Rest of Europe
-
3. Asia Pacific
- 3.1. China
- 3.2. Japan
- 3.3. India
- 3.4. Australia
- 3.5. South korea
- 3.6. Rest of Asia Pacific
-
4. Middle East and Africa
- 4.1. GCC
- 4.2. South Africa
- 4.3. Rest of Middle East and Africa
-
5. South America
- 5.1. Brazil
- 5.2. Argentina
- 5.3. Rest of South America
Molecular Weight Marker Market REPORT HIGHLIGHTS
| Aspects | Details |
|---|---|
| Study Period | 2019-2033 |
| Base Year | 2024 |
| Estimated Year | 2025 |
| Forecast Period | 2025-2033 |
| Historical Period | 2019-2024 |
| Growth Rate | CAGR of 13.17% from 2019-2033 |
| Segmentation |
|
Table of Contents
- 1. Introduction
- 1.1. Research Scope
- 1.2. Market Segmentation
- 1.3. Research Methodology
- 1.4. Definitions and Assumptions
- 2. Executive Summary
- 2.1. Introduction
- 3. Market Dynamics
- 3.1. Introduction
- 3.2. Market Drivers
- 3.2.1. Increasing Investment on R&D; Growing Focus on Proteomics and Genomics Technologies Research
- 3.3. Market Restrains
- 3.3.1. Lack of Skilled Healthcare Professionals; Strict Government Regulations
- 3.4. Market Trends
- 3.4.1. RNA Marker Segment is Expected to Show Significant Growth Over the Forecast Period
- 4. Market Factor Analysis
- 4.1. Porters Five Forces
- 4.2. Supply/Value Chain
- 4.3. PESTEL analysis
- 4.4. Market Entropy
- 4.5. Patent/Trademark Analysis
- 5. Global Molecular Weight Marker Market Analysis, Insights and Forecast, 2019-2031
- 5.1. Market Analysis, Insights and Forecast - by Product
- 5.1.1. DNA Marker
- 5.1.2. Protein Marker
- 5.1.3. RNA Marker
- 5.2. Market Analysis, Insights and Forecast - by Application
- 5.2.1. Nucleic
- 5.2.2. Proteomi
- 5.3. Market Analysis, Insights and Forecast - by Type
- 5.3.1. Prestained Marker
- 5.3.2. Unstained Marker
- 5.3.3. Specialty Marker
- 5.4. Market Analysis, Insights and Forecast - by Region
- 5.4.1. North America
- 5.4.2. Europe
- 5.4.3. Asia Pacific
- 5.4.4. Middle East and Africa
- 5.4.5. South America
- 5.1. Market Analysis, Insights and Forecast - by Product
- 6. North America Molecular Weight Marker Market Analysis, Insights and Forecast, 2019-2031
- 6.1. Market Analysis, Insights and Forecast - by Product
- 6.1.1. DNA Marker
- 6.1.2. Protein Marker
- 6.1.3. RNA Marker
- 6.2. Market Analysis, Insights and Forecast - by Application
- 6.2.1. Nucleic
- 6.2.2. Proteomi
- 6.3. Market Analysis, Insights and Forecast - by Type
- 6.3.1. Prestained Marker
- 6.3.2. Unstained Marker
- 6.3.3. Specialty Marker
- 6.1. Market Analysis, Insights and Forecast - by Product
- 7. Europe Molecular Weight Marker Market Analysis, Insights and Forecast, 2019-2031
- 7.1. Market Analysis, Insights and Forecast - by Product
- 7.1.1. DNA Marker
- 7.1.2. Protein Marker
- 7.1.3. RNA Marker
- 7.2. Market Analysis, Insights and Forecast - by Application
- 7.2.1. Nucleic
- 7.2.2. Proteomi
- 7.3. Market Analysis, Insights and Forecast - by Type
- 7.3.1. Prestained Marker
- 7.3.2. Unstained Marker
- 7.3.3. Specialty Marker
- 7.1. Market Analysis, Insights and Forecast - by Product
- 8. Asia Pacific Molecular Weight Marker Market Analysis, Insights and Forecast, 2019-2031
- 8.1. Market Analysis, Insights and Forecast - by Product
- 8.1.1. DNA Marker
- 8.1.2. Protein Marker
- 8.1.3. RNA Marker
- 8.2. Market Analysis, Insights and Forecast - by Application
- 8.2.1. Nucleic
- 8.2.2. Proteomi
- 8.3. Market Analysis, Insights and Forecast - by Type
- 8.3.1. Prestained Marker
- 8.3.2. Unstained Marker
- 8.3.3. Specialty Marker
- 8.1. Market Analysis, Insights and Forecast - by Product
- 9. Middle East and Africa Molecular Weight Marker Market Analysis, Insights and Forecast, 2019-2031
- 9.1. Market Analysis, Insights and Forecast - by Product
- 9.1.1. DNA Marker
- 9.1.2. Protein Marker
- 9.1.3. RNA Marker
- 9.2. Market Analysis, Insights and Forecast - by Application
- 9.2.1. Nucleic
- 9.2.2. Proteomi
- 9.3. Market Analysis, Insights and Forecast - by Type
- 9.3.1. Prestained Marker
- 9.3.2. Unstained Marker
- 9.3.3. Specialty Marker
- 9.1. Market Analysis, Insights and Forecast - by Product
- 10. South America Molecular Weight Marker Market Analysis, Insights and Forecast, 2019-2031
- 10.1. Market Analysis, Insights and Forecast - by Product
- 10.1.1. DNA Marker
- 10.1.2. Protein Marker
- 10.1.3. RNA Marker
- 10.2. Market Analysis, Insights and Forecast - by Application
- 10.2.1. Nucleic
- 10.2.2. Proteomi
- 10.3. Market Analysis, Insights and Forecast - by Type
- 10.3.1. Prestained Marker
- 10.3.2. Unstained Marker
- 10.3.3. Specialty Marker
- 10.1. Market Analysis, Insights and Forecast - by Product
- 11. North America Molecular Weight Marker Market Analysis, Insights and Forecast, 2019-2031
- 11.1. Market Analysis, Insights and Forecast - By Country/Sub-region
- 11.1.1 United States
- 11.1.2 Canada
- 11.1.3 Mexico
- 12. Europe Molecular Weight Marker Market Analysis, Insights and Forecast, 2019-2031
- 12.1. Market Analysis, Insights and Forecast - By Country/Sub-region
- 12.1.1 Germany
- 12.1.2 United Kingdom
- 12.1.3 France
- 12.1.4 Italy
- 12.1.5 Spain
- 12.1.6 Rest of Europe
- 13. Asia Pacific Molecular Weight Marker Market Analysis, Insights and Forecast, 2019-2031
- 13.1. Market Analysis, Insights and Forecast - By Country/Sub-region
- 13.1.1 China
- 13.1.2 Japan
- 13.1.3 India
- 13.1.4 Australia
- 13.1.5 South korea
- 13.1.6 Rest of Asia Pacific
- 14. Middle East and Africa Molecular Weight Marker Market Analysis, Insights and Forecast, 2019-2031
- 14.1. Market Analysis, Insights and Forecast - By Country/Sub-region
- 14.1.1 GCC
- 14.1.2 South Africa
- 14.1.3 Rest of Middle East and Africa
- 15. South America Molecular Weight Marker Market Analysis, Insights and Forecast, 2019-2031
- 15.1. Market Analysis, Insights and Forecast - By Country/Sub-region
- 15.1.1 Brazil
- 15.1.2 Argentina
- 15.1.3 Rest of South America
- 16. Competitive Analysis
- 16.1. Global Market Share Analysis 2024
- 16.2. Company Profiles
- 16.2.1 F Hoffmann-La Roche AG
- 16.2.1.1. Overview
- 16.2.1.2. Products
- 16.2.1.3. SWOT Analysis
- 16.2.1.4. Recent Developments
- 16.2.1.5. Financials (Based on Availability)
- 16.2.2 GeneDireX Inc
- 16.2.2.1. Overview
- 16.2.2.2. Products
- 16.2.2.3. SWOT Analysis
- 16.2.2.4. Recent Developments
- 16.2.2.5. Financials (Based on Availability)
- 16.2.3 Promega Corporation
- 16.2.3.1. Overview
- 16.2.3.2. Products
- 16.2.3.3. SWOT Analysis
- 16.2.3.4. Recent Developments
- 16.2.3.5. Financials (Based on Availability)
- 16.2.4 Bio-Rad Laboratories Inc
- 16.2.4.1. Overview
- 16.2.4.2. Products
- 16.2.4.3. SWOT Analysis
- 16.2.4.4. Recent Developments
- 16.2.4.5. Financials (Based on Availability)
- 16.2.5 Merck KGaA
- 16.2.5.1. Overview
- 16.2.5.2. Products
- 16.2.5.3. SWOT Analysis
- 16.2.5.4. Recent Developments
- 16.2.5.5. Financials (Based on Availability)
- 16.2.6 Thermo Fisher Scientific Inc
- 16.2.6.1. Overview
- 16.2.6.2. Products
- 16.2.6.3. SWOT Analysis
- 16.2.6.4. Recent Developments
- 16.2.6.5. Financials (Based on Availability)
- 16.2.7 New England Biolabs
- 16.2.7.1. Overview
- 16.2.7.2. Products
- 16.2.7.3. SWOT Analysis
- 16.2.7.4. Recent Developments
- 16.2.7.5. Financials (Based on Availability)
- 16.2.8 VWR International
- 16.2.8.1. Overview
- 16.2.8.2. Products
- 16.2.8.3. SWOT Analysis
- 16.2.8.4. Recent Developments
- 16.2.8.5. Financials (Based on Availability)
- 16.2.9 Takara Bio Inc
- 16.2.9.1. Overview
- 16.2.9.2. Products
- 16.2.9.3. SWOT Analysis
- 16.2.9.4. Recent Developments
- 16.2.9.5. Financials (Based on Availability)
- 16.2.10 QIAGEN N V
- 16.2.10.1. Overview
- 16.2.10.2. Products
- 16.2.10.3. SWOT Analysis
- 16.2.10.4. Recent Developments
- 16.2.10.5. Financials (Based on Availability)
- 16.2.11 Agilent Technologies Inc
- 16.2.11.1. Overview
- 16.2.11.2. Products
- 16.2.11.3. SWOT Analysis
- 16.2.11.4. Recent Developments
- 16.2.11.5. Financials (Based on Availability)
- 16.2.12 HiMedia Laboratories
- 16.2.12.1. Overview
- 16.2.12.2. Products
- 16.2.12.3. SWOT Analysis
- 16.2.12.4. Recent Developments
- 16.2.12.5. Financials (Based on Availability)
- 16.2.1 F Hoffmann-La Roche AG
List of Figures
- Figure 1: Global Molecular Weight Marker Market Revenue Breakdown (Million, %) by Region 2024 & 2032
- Figure 2: Global Molecular Weight Marker Market Volume Breakdown (K Unit, %) by Region 2024 & 2032
- Figure 3: North America Molecular Weight Marker Market Revenue (Million), by Country 2024 & 2032
- Figure 4: North America Molecular Weight Marker Market Volume (K Unit), by Country 2024 & 2032
- Figure 5: North America Molecular Weight Marker Market Revenue Share (%), by Country 2024 & 2032
- Figure 6: North America Molecular Weight Marker Market Volume Share (%), by Country 2024 & 2032
- Figure 7: Europe Molecular Weight Marker Market Revenue (Million), by Country 2024 & 2032
- Figure 8: Europe Molecular Weight Marker Market Volume (K Unit), by Country 2024 & 2032
- Figure 9: Europe Molecular Weight Marker Market Revenue Share (%), by Country 2024 & 2032
- Figure 10: Europe Molecular Weight Marker Market Volume Share (%), by Country 2024 & 2032
- Figure 11: Asia Pacific Molecular Weight Marker Market Revenue (Million), by Country 2024 & 2032
- Figure 12: Asia Pacific Molecular Weight Marker Market Volume (K Unit), by Country 2024 & 2032
- Figure 13: Asia Pacific Molecular Weight Marker Market Revenue Share (%), by Country 2024 & 2032
- Figure 14: Asia Pacific Molecular Weight Marker Market Volume Share (%), by Country 2024 & 2032
- Figure 15: Middle East and Africa Molecular Weight Marker Market Revenue (Million), by Country 2024 & 2032
- Figure 16: Middle East and Africa Molecular Weight Marker Market Volume (K Unit), by Country 2024 & 2032
- Figure 17: Middle East and Africa Molecular Weight Marker Market Revenue Share (%), by Country 2024 & 2032
- Figure 18: Middle East and Africa Molecular Weight Marker Market Volume Share (%), by Country 2024 & 2032
- Figure 19: South America Molecular Weight Marker Market Revenue (Million), by Country 2024 & 2032
- Figure 20: South America Molecular Weight Marker Market Volume (K Unit), by Country 2024 & 2032
- Figure 21: South America Molecular Weight Marker Market Revenue Share (%), by Country 2024 & 2032
- Figure 22: South America Molecular Weight Marker Market Volume Share (%), by Country 2024 & 2032
- Figure 23: North America Molecular Weight Marker Market Revenue (Million), by Product 2024 & 2032
- Figure 24: North America Molecular Weight Marker Market Volume (K Unit), by Product 2024 & 2032
- Figure 25: North America Molecular Weight Marker Market Revenue Share (%), by Product 2024 & 2032
- Figure 26: North America Molecular Weight Marker Market Volume Share (%), by Product 2024 & 2032
- Figure 27: North America Molecular Weight Marker Market Revenue (Million), by Application 2024 & 2032
- Figure 28: North America Molecular Weight Marker Market Volume (K Unit), by Application 2024 & 2032
- Figure 29: North America Molecular Weight Marker Market Revenue Share (%), by Application 2024 & 2032
- Figure 30: North America Molecular Weight Marker Market Volume Share (%), by Application 2024 & 2032
- Figure 31: North America Molecular Weight Marker Market Revenue (Million), by Type 2024 & 2032
- Figure 32: North America Molecular Weight Marker Market Volume (K Unit), by Type 2024 & 2032
- Figure 33: North America Molecular Weight Marker Market Revenue Share (%), by Type 2024 & 2032
- Figure 34: North America Molecular Weight Marker Market Volume Share (%), by Type 2024 & 2032
- Figure 35: North America Molecular Weight Marker Market Revenue (Million), by Country 2024 & 2032
- Figure 36: North America Molecular Weight Marker Market Volume (K Unit), by Country 2024 & 2032
- Figure 37: North America Molecular Weight Marker Market Revenue Share (%), by Country 2024 & 2032
- Figure 38: North America Molecular Weight Marker Market Volume Share (%), by Country 2024 & 2032
- Figure 39: Europe Molecular Weight Marker Market Revenue (Million), by Product 2024 & 2032
- Figure 40: Europe Molecular Weight Marker Market Volume (K Unit), by Product 2024 & 2032
- Figure 41: Europe Molecular Weight Marker Market Revenue Share (%), by Product 2024 & 2032
- Figure 42: Europe Molecular Weight Marker Market Volume Share (%), by Product 2024 & 2032
- Figure 43: Europe Molecular Weight Marker Market Revenue (Million), by Application 2024 & 2032
- Figure 44: Europe Molecular Weight Marker Market Volume (K Unit), by Application 2024 & 2032
- Figure 45: Europe Molecular Weight Marker Market Revenue Share (%), by Application 2024 & 2032
- Figure 46: Europe Molecular Weight Marker Market Volume Share (%), by Application 2024 & 2032
- Figure 47: Europe Molecular Weight Marker Market Revenue (Million), by Type 2024 & 2032
- Figure 48: Europe Molecular Weight Marker Market Volume (K Unit), by Type 2024 & 2032
- Figure 49: Europe Molecular Weight Marker Market Revenue Share (%), by Type 2024 & 2032
- Figure 50: Europe Molecular Weight Marker Market Volume Share (%), by Type 2024 & 2032
- Figure 51: Europe Molecular Weight Marker Market Revenue (Million), by Country 2024 & 2032
- Figure 52: Europe Molecular Weight Marker Market Volume (K Unit), by Country 2024 & 2032
- Figure 53: Europe Molecular Weight Marker Market Revenue Share (%), by Country 2024 & 2032
- Figure 54: Europe Molecular Weight Marker Market Volume Share (%), by Country 2024 & 2032
- Figure 55: Asia Pacific Molecular Weight Marker Market Revenue (Million), by Product 2024 & 2032
- Figure 56: Asia Pacific Molecular Weight Marker Market Volume (K Unit), by Product 2024 & 2032
- Figure 57: Asia Pacific Molecular Weight Marker Market Revenue Share (%), by Product 2024 & 2032
- Figure 58: Asia Pacific Molecular Weight Marker Market Volume Share (%), by Product 2024 & 2032
- Figure 59: Asia Pacific Molecular Weight Marker Market Revenue (Million), by Application 2024 & 2032
- Figure 60: Asia Pacific Molecular Weight Marker Market Volume (K Unit), by Application 2024 & 2032
- Figure 61: Asia Pacific Molecular Weight Marker Market Revenue Share (%), by Application 2024 & 2032
- Figure 62: Asia Pacific Molecular Weight Marker Market Volume Share (%), by Application 2024 & 2032
- Figure 63: Asia Pacific Molecular Weight Marker Market Revenue (Million), by Type 2024 & 2032
- Figure 64: Asia Pacific Molecular Weight Marker Market Volume (K Unit), by Type 2024 & 2032
- Figure 65: Asia Pacific Molecular Weight Marker Market Revenue Share (%), by Type 2024 & 2032
- Figure 66: Asia Pacific Molecular Weight Marker Market Volume Share (%), by Type 2024 & 2032
- Figure 67: Asia Pacific Molecular Weight Marker Market Revenue (Million), by Country 2024 & 2032
- Figure 68: Asia Pacific Molecular Weight Marker Market Volume (K Unit), by Country 2024 & 2032
- Figure 69: Asia Pacific Molecular Weight Marker Market Revenue Share (%), by Country 2024 & 2032
- Figure 70: Asia Pacific Molecular Weight Marker Market Volume Share (%), by Country 2024 & 2032
- Figure 71: Middle East and Africa Molecular Weight Marker Market Revenue (Million), by Product 2024 & 2032
- Figure 72: Middle East and Africa Molecular Weight Marker Market Volume (K Unit), by Product 2024 & 2032
- Figure 73: Middle East and Africa Molecular Weight Marker Market Revenue Share (%), by Product 2024 & 2032
- Figure 74: Middle East and Africa Molecular Weight Marker Market Volume Share (%), by Product 2024 & 2032
- Figure 75: Middle East and Africa Molecular Weight Marker Market Revenue (Million), by Application 2024 & 2032
- Figure 76: Middle East and Africa Molecular Weight Marker Market Volume (K Unit), by Application 2024 & 2032
- Figure 77: Middle East and Africa Molecular Weight Marker Market Revenue Share (%), by Application 2024 & 2032
- Figure 78: Middle East and Africa Molecular Weight Marker Market Volume Share (%), by Application 2024 & 2032
- Figure 79: Middle East and Africa Molecular Weight Marker Market Revenue (Million), by Type 2024 & 2032
- Figure 80: Middle East and Africa Molecular Weight Marker Market Volume (K Unit), by Type 2024 & 2032
- Figure 81: Middle East and Africa Molecular Weight Marker Market Revenue Share (%), by Type 2024 & 2032
- Figure 82: Middle East and Africa Molecular Weight Marker Market Volume Share (%), by Type 2024 & 2032
- Figure 83: Middle East and Africa Molecular Weight Marker Market Revenue (Million), by Country 2024 & 2032
- Figure 84: Middle East and Africa Molecular Weight Marker Market Volume (K Unit), by Country 2024 & 2032
- Figure 85: Middle East and Africa Molecular Weight Marker Market Revenue Share (%), by Country 2024 & 2032
- Figure 86: Middle East and Africa Molecular Weight Marker Market Volume Share (%), by Country 2024 & 2032
- Figure 87: South America Molecular Weight Marker Market Revenue (Million), by Product 2024 & 2032
- Figure 88: South America Molecular Weight Marker Market Volume (K Unit), by Product 2024 & 2032
- Figure 89: South America Molecular Weight Marker Market Revenue Share (%), by Product 2024 & 2032
- Figure 90: South America Molecular Weight Marker Market Volume Share (%), by Product 2024 & 2032
- Figure 91: South America Molecular Weight Marker Market Revenue (Million), by Application 2024 & 2032
- Figure 92: South America Molecular Weight Marker Market Volume (K Unit), by Application 2024 & 2032
- Figure 93: South America Molecular Weight Marker Market Revenue Share (%), by Application 2024 & 2032
- Figure 94: South America Molecular Weight Marker Market Volume Share (%), by Application 2024 & 2032
- Figure 95: South America Molecular Weight Marker Market Revenue (Million), by Type 2024 & 2032
- Figure 96: South America Molecular Weight Marker Market Volume (K Unit), by Type 2024 & 2032
- Figure 97: South America Molecular Weight Marker Market Revenue Share (%), by Type 2024 & 2032
- Figure 98: South America Molecular Weight Marker Market Volume Share (%), by Type 2024 & 2032
- Figure 99: South America Molecular Weight Marker Market Revenue (Million), by Country 2024 & 2032
- Figure 100: South America Molecular Weight Marker Market Volume (K Unit), by Country 2024 & 2032
- Figure 101: South America Molecular Weight Marker Market Revenue Share (%), by Country 2024 & 2032
- Figure 102: South America Molecular Weight Marker Market Volume Share (%), by Country 2024 & 2032
List of Tables
- Table 1: Global Molecular Weight Marker Market Revenue Million Forecast, by Region 2019 & 2032
- Table 2: Global Molecular Weight Marker Market Volume K Unit Forecast, by Region 2019 & 2032
- Table 3: Global Molecular Weight Marker Market Revenue Million Forecast, by Product 2019 & 2032
- Table 4: Global Molecular Weight Marker Market Volume K Unit Forecast, by Product 2019 & 2032
- Table 5: Global Molecular Weight Marker Market Revenue Million Forecast, by Application 2019 & 2032
- Table 6: Global Molecular Weight Marker Market Volume K Unit Forecast, by Application 2019 & 2032
- Table 7: Global Molecular Weight Marker Market Revenue Million Forecast, by Type 2019 & 2032
- Table 8: Global Molecular Weight Marker Market Volume K Unit Forecast, by Type 2019 & 2032
- Table 9: Global Molecular Weight Marker Market Revenue Million Forecast, by Region 2019 & 2032
- Table 10: Global Molecular Weight Marker Market Volume K Unit Forecast, by Region 2019 & 2032
- Table 11: Global Molecular Weight Marker Market Revenue Million Forecast, by Country 2019 & 2032
- Table 12: Global Molecular Weight Marker Market Volume K Unit Forecast, by Country 2019 & 2032
- Table 13: United States Molecular Weight Marker Market Revenue (Million) Forecast, by Application 2019 & 2032
- Table 14: United States Molecular Weight Marker Market Volume (K Unit) Forecast, by Application 2019 & 2032
- Table 15: Canada Molecular Weight Marker Market Revenue (Million) Forecast, by Application 2019 & 2032
- Table 16: Canada Molecular Weight Marker Market Volume (K Unit) Forecast, by Application 2019 & 2032
- Table 17: Mexico Molecular Weight Marker Market Revenue (Million) Forecast, by Application 2019 & 2032
- Table 18: Mexico Molecular Weight Marker Market Volume (K Unit) Forecast, by Application 2019 & 2032
- Table 19: Global Molecular Weight Marker Market Revenue Million Forecast, by Country 2019 & 2032
- Table 20: Global Molecular Weight Marker Market Volume K Unit Forecast, by Country 2019 & 2032
- Table 21: Germany Molecular Weight Marker Market Revenue (Million) Forecast, by Application 2019 & 2032
- Table 22: Germany Molecular Weight Marker Market Volume (K Unit) Forecast, by Application 2019 & 2032
- Table 23: United Kingdom Molecular Weight Marker Market Revenue (Million) Forecast, by Application 2019 & 2032
- Table 24: United Kingdom Molecular Weight Marker Market Volume (K Unit) Forecast, by Application 2019 & 2032
- Table 25: France Molecular Weight Marker Market Revenue (Million) Forecast, by Application 2019 & 2032
- Table 26: France Molecular Weight Marker Market Volume (K Unit) Forecast, by Application 2019 & 2032
- Table 27: Italy Molecular Weight Marker Market Revenue (Million) Forecast, by Application 2019 & 2032
- Table 28: Italy Molecular Weight Marker Market Volume (K Unit) Forecast, by Application 2019 & 2032
- Table 29: Spain Molecular Weight Marker Market Revenue (Million) Forecast, by Application 2019 & 2032
- Table 30: Spain Molecular Weight Marker Market Volume (K Unit) Forecast, by Application 2019 & 2032
- Table 31: Rest of Europe Molecular Weight Marker Market Revenue (Million) Forecast, by Application 2019 & 2032
- Table 32: Rest of Europe Molecular Weight Marker Market Volume (K Unit) Forecast, by Application 2019 & 2032
- Table 33: Global Molecular Weight Marker Market Revenue Million Forecast, by Country 2019 & 2032
- Table 34: Global Molecular Weight Marker Market Volume K Unit Forecast, by Country 2019 & 2032
- Table 35: China Molecular Weight Marker Market Revenue (Million) Forecast, by Application 2019 & 2032
- Table 36: China Molecular Weight Marker Market Volume (K Unit) Forecast, by Application 2019 & 2032
- Table 37: Japan Molecular Weight Marker Market Revenue (Million) Forecast, by Application 2019 & 2032
- Table 38: Japan Molecular Weight Marker Market Volume (K Unit) Forecast, by Application 2019 & 2032
- Table 39: India Molecular Weight Marker Market Revenue (Million) Forecast, by Application 2019 & 2032
- Table 40: India Molecular Weight Marker Market Volume (K Unit) Forecast, by Application 2019 & 2032
- Table 41: Australia Molecular Weight Marker Market Revenue (Million) Forecast, by Application 2019 & 2032
- Table 42: Australia Molecular Weight Marker Market Volume (K Unit) Forecast, by Application 2019 & 2032
- Table 43: South korea Molecular Weight Marker Market Revenue (Million) Forecast, by Application 2019 & 2032
- Table 44: South korea Molecular Weight Marker Market Volume (K Unit) Forecast, by Application 2019 & 2032
- Table 45: Rest of Asia Pacific Molecular Weight Marker Market Revenue (Million) Forecast, by Application 2019 & 2032
- Table 46: Rest of Asia Pacific Molecular Weight Marker Market Volume (K Unit) Forecast, by Application 2019 & 2032
- Table 47: Global Molecular Weight Marker Market Revenue Million Forecast, by Country 2019 & 2032
- Table 48: Global Molecular Weight Marker Market Volume K Unit Forecast, by Country 2019 & 2032
- Table 49: GCC Molecular Weight Marker Market Revenue (Million) Forecast, by Application 2019 & 2032
- Table 50: GCC Molecular Weight Marker Market Volume (K Unit) Forecast, by Application 2019 & 2032
- Table 51: South Africa Molecular Weight Marker Market Revenue (Million) Forecast, by Application 2019 & 2032
- Table 52: South Africa Molecular Weight Marker Market Volume (K Unit) Forecast, by Application 2019 & 2032
- Table 53: Rest of Middle East and Africa Molecular Weight Marker Market Revenue (Million) Forecast, by Application 2019 & 2032
- Table 54: Rest of Middle East and Africa Molecular Weight Marker Market Volume (K Unit) Forecast, by Application 2019 & 2032
- Table 55: Global Molecular Weight Marker Market Revenue Million Forecast, by Country 2019 & 2032
- Table 56: Global Molecular Weight Marker Market Volume K Unit Forecast, by Country 2019 & 2032
- Table 57: Brazil Molecular Weight Marker Market Revenue (Million) Forecast, by Application 2019 & 2032
- Table 58: Brazil Molecular Weight Marker Market Volume (K Unit) Forecast, by Application 2019 & 2032
- Table 59: Argentina Molecular Weight Marker Market Revenue (Million) Forecast, by Application 2019 & 2032
- Table 60: Argentina Molecular Weight Marker Market Volume (K Unit) Forecast, by Application 2019 & 2032
- Table 61: Rest of South America Molecular Weight Marker Market Revenue (Million) Forecast, by Application 2019 & 2032
- Table 62: Rest of South America Molecular Weight Marker Market Volume (K Unit) Forecast, by Application 2019 & 2032
- Table 63: Global Molecular Weight Marker Market Revenue Million Forecast, by Product 2019 & 2032
- Table 64: Global Molecular Weight Marker Market Volume K Unit Forecast, by Product 2019 & 2032
- Table 65: Global Molecular Weight Marker Market Revenue Million Forecast, by Application 2019 & 2032
- Table 66: Global Molecular Weight Marker Market Volume K Unit Forecast, by Application 2019 & 2032
- Table 67: Global Molecular Weight Marker Market Revenue Million Forecast, by Type 2019 & 2032
- Table 68: Global Molecular Weight Marker Market Volume K Unit Forecast, by Type 2019 & 2032
- Table 69: Global Molecular Weight Marker Market Revenue Million Forecast, by Country 2019 & 2032
- Table 70: Global Molecular Weight Marker Market Volume K Unit Forecast, by Country 2019 & 2032
- Table 71: United States Molecular Weight Marker Market Revenue (Million) Forecast, by Application 2019 & 2032
- Table 72: United States Molecular Weight Marker Market Volume (K Unit) Forecast, by Application 2019 & 2032
- Table 73: Canada Molecular Weight Marker Market Revenue (Million) Forecast, by Application 2019 & 2032
- Table 74: Canada Molecular Weight Marker Market Volume (K Unit) Forecast, by Application 2019 & 2032
- Table 75: Mexico Molecular Weight Marker Market Revenue (Million) Forecast, by Application 2019 & 2032
- Table 76: Mexico Molecular Weight Marker Market Volume (K Unit) Forecast, by Application 2019 & 2032
- Table 77: Global Molecular Weight Marker Market Revenue Million Forecast, by Product 2019 & 2032
- Table 78: Global Molecular Weight Marker Market Volume K Unit Forecast, by Product 2019 & 2032
- Table 79: Global Molecular Weight Marker Market Revenue Million Forecast, by Application 2019 & 2032
- Table 80: Global Molecular Weight Marker Market Volume K Unit Forecast, by Application 2019 & 2032
- Table 81: Global Molecular Weight Marker Market Revenue Million Forecast, by Type 2019 & 2032
- Table 82: Global Molecular Weight Marker Market Volume K Unit Forecast, by Type 2019 & 2032
- Table 83: Global Molecular Weight Marker Market Revenue Million Forecast, by Country 2019 & 2032
- Table 84: Global Molecular Weight Marker Market Volume K Unit Forecast, by Country 2019 & 2032
- Table 85: Germany Molecular Weight Marker Market Revenue (Million) Forecast, by Application 2019 & 2032
- Table 86: Germany Molecular Weight Marker Market Volume (K Unit) Forecast, by Application 2019 & 2032
- Table 87: United Kingdom Molecular Weight Marker Market Revenue (Million) Forecast, by Application 2019 & 2032
- Table 88: United Kingdom Molecular Weight Marker Market Volume (K Unit) Forecast, by Application 2019 & 2032
- Table 89: France Molecular Weight Marker Market Revenue (Million) Forecast, by Application 2019 & 2032
- Table 90: France Molecular Weight Marker Market Volume (K Unit) Forecast, by Application 2019 & 2032
- Table 91: Italy Molecular Weight Marker Market Revenue (Million) Forecast, by Application 2019 & 2032
- Table 92: Italy Molecular Weight Marker Market Volume (K Unit) Forecast, by Application 2019 & 2032
- Table 93: Spain Molecular Weight Marker Market Revenue (Million) Forecast, by Application 2019 & 2032
- Table 94: Spain Molecular Weight Marker Market Volume (K Unit) Forecast, by Application 2019 & 2032
- Table 95: Rest of Europe Molecular Weight Marker Market Revenue (Million) Forecast, by Application 2019 & 2032
- Table 96: Rest of Europe Molecular Weight Marker Market Volume (K Unit) Forecast, by Application 2019 & 2032
- Table 97: Global Molecular Weight Marker Market Revenue Million Forecast, by Product 2019 & 2032
- Table 98: Global Molecular Weight Marker Market Volume K Unit Forecast, by Product 2019 & 2032
- Table 99: Global Molecular Weight Marker Market Revenue Million Forecast, by Application 2019 & 2032
- Table 100: Global Molecular Weight Marker Market Volume K Unit Forecast, by Application 2019 & 2032
- Table 101: Global Molecular Weight Marker Market Revenue Million Forecast, by Type 2019 & 2032
- Table 102: Global Molecular Weight Marker Market Volume K Unit Forecast, by Type 2019 & 2032
- Table 103: Global Molecular Weight Marker Market Revenue Million Forecast, by Country 2019 & 2032
- Table 104: Global Molecular Weight Marker Market Volume K Unit Forecast, by Country 2019 & 2032
- Table 105: China Molecular Weight Marker Market Revenue (Million) Forecast, by Application 2019 & 2032
- Table 106: China Molecular Weight Marker Market Volume (K Unit) Forecast, by Application 2019 & 2032
- Table 107: Japan Molecular Weight Marker Market Revenue (Million) Forecast, by Application 2019 & 2032
- Table 108: Japan Molecular Weight Marker Market Volume (K Unit) Forecast, by Application 2019 & 2032
- Table 109: India Molecular Weight Marker Market Revenue (Million) Forecast, by Application 2019 & 2032
- Table 110: India Molecular Weight Marker Market Volume (K Unit) Forecast, by Application 2019 & 2032
- Table 111: Australia Molecular Weight Marker Market Revenue (Million) Forecast, by Application 2019 & 2032
- Table 112: Australia Molecular Weight Marker Market Volume (K Unit) Forecast, by Application 2019 & 2032
- Table 113: South korea Molecular Weight Marker Market Revenue (Million) Forecast, by Application 2019 & 2032
- Table 114: South korea Molecular Weight Marker Market Volume (K Unit) Forecast, by Application 2019 & 2032
- Table 115: Rest of Asia Pacific Molecular Weight Marker Market Revenue (Million) Forecast, by Application 2019 & 2032
- Table 116: Rest of Asia Pacific Molecular Weight Marker Market Volume (K Unit) Forecast, by Application 2019 & 2032
- Table 117: Global Molecular Weight Marker Market Revenue Million Forecast, by Product 2019 & 2032
- Table 118: Global Molecular Weight Marker Market Volume K Unit Forecast, by Product 2019 & 2032
- Table 119: Global Molecular Weight Marker Market Revenue Million Forecast, by Application 2019 & 2032
- Table 120: Global Molecular Weight Marker Market Volume K Unit Forecast, by Application 2019 & 2032
- Table 121: Global Molecular Weight Marker Market Revenue Million Forecast, by Type 2019 & 2032
- Table 122: Global Molecular Weight Marker Market Volume K Unit Forecast, by Type 2019 & 2032
- Table 123: Global Molecular Weight Marker Market Revenue Million Forecast, by Country 2019 & 2032
- Table 124: Global Molecular Weight Marker Market Volume K Unit Forecast, by Country 2019 & 2032
- Table 125: GCC Molecular Weight Marker Market Revenue (Million) Forecast, by Application 2019 & 2032
- Table 126: GCC Molecular Weight Marker Market Volume (K Unit) Forecast, by Application 2019 & 2032
- Table 127: South Africa Molecular Weight Marker Market Revenue (Million) Forecast, by Application 2019 & 2032
- Table 128: South Africa Molecular Weight Marker Market Volume (K Unit) Forecast, by Application 2019 & 2032
- Table 129: Rest of Middle East and Africa Molecular Weight Marker Market Revenue (Million) Forecast, by Application 2019 & 2032
- Table 130: Rest of Middle East and Africa Molecular Weight Marker Market Volume (K Unit) Forecast, by Application 2019 & 2032
- Table 131: Global Molecular Weight Marker Market Revenue Million Forecast, by Product 2019 & 2032
- Table 132: Global Molecular Weight Marker Market Volume K Unit Forecast, by Product 2019 & 2032
- Table 133: Global Molecular Weight Marker Market Revenue Million Forecast, by Application 2019 & 2032
- Table 134: Global Molecular Weight Marker Market Volume K Unit Forecast, by Application 2019 & 2032
- Table 135: Global Molecular Weight Marker Market Revenue Million Forecast, by Type 2019 & 2032
- Table 136: Global Molecular Weight Marker Market Volume K Unit Forecast, by Type 2019 & 2032
- Table 137: Global Molecular Weight Marker Market Revenue Million Forecast, by Country 2019 & 2032
- Table 138: Global Molecular Weight Marker Market Volume K Unit Forecast, by Country 2019 & 2032
- Table 139: Brazil Molecular Weight Marker Market Revenue (Million) Forecast, by Application 2019 & 2032
- Table 140: Brazil Molecular Weight Marker Market Volume (K Unit) Forecast, by Application 2019 & 2032
- Table 141: Argentina Molecular Weight Marker Market Revenue (Million) Forecast, by Application 2019 & 2032
- Table 142: Argentina Molecular Weight Marker Market Volume (K Unit) Forecast, by Application 2019 & 2032
- Table 143: Rest of South America Molecular Weight Marker Market Revenue (Million) Forecast, by Application 2019 & 2032
- Table 144: Rest of South America Molecular Weight Marker Market Volume (K Unit) Forecast, by Application 2019 & 2032
Frequently Asked Questions
1. What is the projected Compound Annual Growth Rate (CAGR) of the Molecular Weight Marker Market?
The projected CAGR is approximately 13.17%.
2. Which companies are prominent players in the Molecular Weight Marker Market?
Key companies in the market include F Hoffmann-La Roche AG, GeneDireX Inc , Promega Corporation, Bio-Rad Laboratories Inc, Merck KGaA, Thermo Fisher Scientific Inc, New England Biolabs, VWR International, Takara Bio Inc, QIAGEN N V, Agilent Technologies Inc, HiMedia Laboratories.
3. What are the main segments of the Molecular Weight Marker Market?
The market segments include Product, Application, Type.
4. Can you provide details about the market size?
The market size is estimated to be USD 0.76 Million as of 2022.
5. What are some drivers contributing to market growth?
Increasing Investment on R&D; Growing Focus on Proteomics and Genomics Technologies Research.
6. What are the notable trends driving market growth?
RNA Marker Segment is Expected to Show Significant Growth Over the Forecast Period.
7. Are there any restraints impacting market growth?
Lack of Skilled Healthcare Professionals; Strict Government Regulations.
8. Can you provide examples of recent developments in the market?
November 2022: Creative Enzymes announced the release of their new line of highly efficient and cost-effective DNA markers and ladders, which quickly gained popularity in the research market.
9. What pricing options are available for accessing the report?
Pricing options include single-user, multi-user, and enterprise licenses priced at USD 4750, USD 5250, and USD 8750 respectively.
10. Is the market size provided in terms of value or volume?
The market size is provided in terms of value, measured in Million and volume, measured in K Unit.
11. Are there any specific market keywords associated with the report?
Yes, the market keyword associated with the report is "Molecular Weight Marker Market," which aids in identifying and referencing the specific market segment covered.
12. How do I determine which pricing option suits my needs best?
The pricing options vary based on user requirements and access needs. Individual users may opt for single-user licenses, while businesses requiring broader access may choose multi-user or enterprise licenses for cost-effective access to the report.
13. Are there any additional resources or data provided in the Molecular Weight Marker Market report?
While the report offers comprehensive insights, it's advisable to review the specific contents or supplementary materials provided to ascertain if additional resources or data are available.
14. How can I stay updated on further developments or reports in the Molecular Weight Marker Market?
To stay informed about further developments, trends, and reports in the Molecular Weight Marker Market, consider subscribing to industry newsletters, following relevant companies and organizations, or regularly checking reputable industry news sources and publications.
Methodology
Step 1 - Identification of Relevant Samples Size from Population Database


Step 2 - Approaches for Defining Global Market Size (Value, Volume* & Price*)

Note*: In applicable scenarios
Step 3 - Data Sources
Primary Research
- Web Analytics
- Survey Reports
- Research Institute
- Latest Research Reports
- Opinion Leaders
Secondary Research
- Annual Reports
- White Paper
- Latest Press Release
- Industry Association
- Paid Database
- Investor Presentations

Step 4 - Data Triangulation
Involves using different sources of information in order to increase the validity of a study
These sources are likely to be stakeholders in a program - participants, other researchers, program staff, other community members, and so on.
Then we put all data in single framework & apply various statistical tools to find out the dynamic on the market.
During the analysis stage, feedback from the stakeholder groups would be compared to determine areas of agreement as well as areas of divergence
