

Key Insights
The global non-alcoholic concentrated syrups market, estimated at $10.97 billion in 2025, is projected for substantial expansion with a Compound Annual Growth Rate (CAGR) of 14.17% from 2025 to 2033. This growth is primarily propelled by escalating consumer demand for convenient and health-conscious beverage solutions, enabling easy at-home preparation. The increasing popularity of fruit and vegetable-based drinks, in line with prevailing wellness trends, further accelerates market development. A wide array of flavors and applications also contributes significantly to market reach, satisfying diverse consumer tastes. The market is segmented by type, with fruit squashes leading due to established consumer preference and broad availability, alongside vegetable squashes and other variants. Sales channels are divided into off-trade (retail) and on-trade (food service), with the off-trade segment currently holding a larger market share. Key industry players such as Rasna, Bickford's, Unilever, and Suntory are strengthening their market positions through brand equity and innovative product offerings. Geographically, North America and Europe exhibit strong market presence, supported by high disposable incomes and robust distribution infrastructure. The Asia Pacific region presents a notable growth opportunity, driven by a burgeoning middle class and a rising consumption of ready-to-drink beverages.
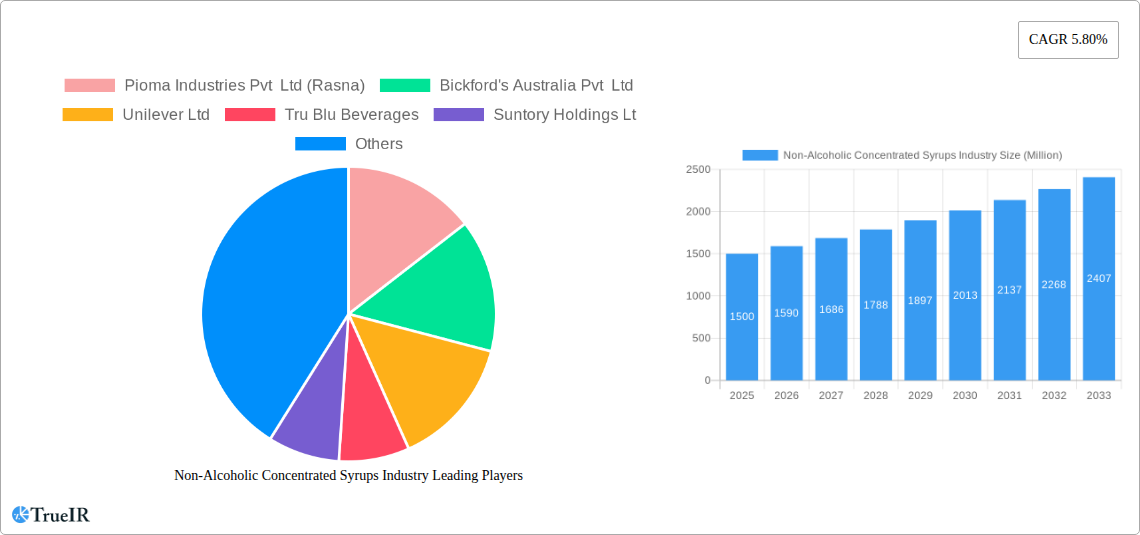
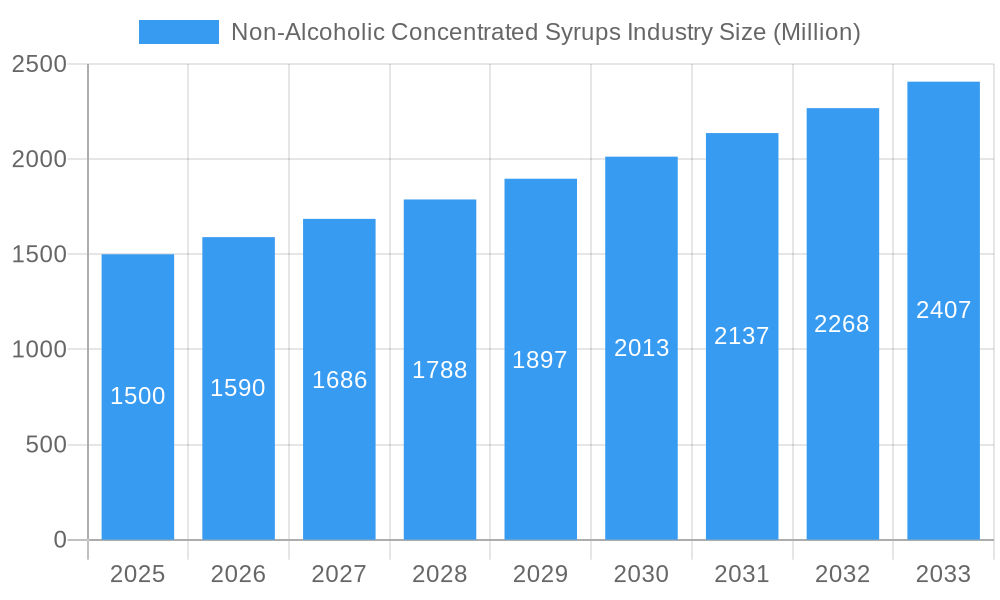
Non-Alcoholic Concentrated Syrups Industry Market Size (In Billion)
Market expansion is moderated by several factors, including volatility in raw material costs for fruits and vegetables, which can influence production expenses. Stringent food safety and labeling regulations across different regions pose compliance challenges for manufacturers. Intense market competition and the emergence of new entrants necessitate continuous innovation and product differentiation for sustained competitive advantage. To leverage emerging opportunities, manufacturers are prioritizing organic and natural ingredients, expanding flavor portfolios, and adopting sustainable packaging. Future growth will be driven by the persistent demand for healthier, convenient beverages, strategic collaborations to broaden distribution, and a dedicated focus on adapting to evolving consumer preferences across global markets. The ultimate market valuation in 2033 will be contingent upon maintaining the projected CAGR and effectively mitigating identified market restraints.
Non-Alcoholic Concentrated Syrups Industry Company Market Share
Dynamic Report: Non-Alcoholic Concentrated Syrups Industry Market Analysis (2019-2033)
This comprehensive report provides a detailed analysis of the Non-Alcoholic Concentrated Syrups industry, offering invaluable insights for businesses, investors, and stakeholders. The study covers the period 2019-2033, with 2025 as the base and estimated year. The market is segmented by type (Fruit Squashes, Vegetable Squashes, Other Types) and sales channel (Off-trade, On-trade). Key players analyzed include Pioma Industries Pvt Ltd (Rasna), Bickford's Australia Pvt Ltd, Unilever Ltd, Tru Blu Beverages, Suntory Holdings Ltd, Britvic PLC, and Golden Circle Ltd. The report projects robust growth, with a projected market value exceeding xx Million by 2033.
Non-Alcoholic Concentrated Syrups Industry Market Structure & Competitive Landscape
This section dissects the competitive landscape of the Non-Alcoholic Concentrated Syrups industry. We analyze market concentration, revealing a moderately concentrated market with a Herfindahl-Hirschman Index (HHI) of xx in 2024. The top 5 players account for approximately xx% of the total market share. Innovation is a key driver, with companies focusing on healthier options, novel flavors, and sustainable packaging. Regulatory changes concerning sugar content and labeling significantly influence market dynamics. Product substitutes, such as ready-to-drink beverages and fresh juices, pose a competitive threat. The industry witnesses significant end-user segmentation, catering to households, food service establishments, and the hospitality sector. M&A activity has been moderate in recent years, with xx major deals recorded between 2019 and 2024, primarily driven by expansion strategies and portfolio diversification.
- Market Concentration: Moderately concentrated, with a HHI of xx in 2024.
- Innovation Drivers: Healthier options, novel flavors, sustainable packaging.
- Regulatory Impacts: Sugar content regulations, labeling requirements.
- Product Substitutes: Ready-to-drink beverages, fresh juices.
- End-User Segmentation: Households, food service, hospitality.
- M&A Trends: xx major deals between 2019-2024, driven by expansion and diversification.
Non-Alcoholic Concentrated Syrups Industry Market Trends & Opportunities
The global Non-Alcoholic Concentrated Syrups market is experiencing significant growth, driven by rising disposable incomes, changing consumer preferences towards convenient and healthier beverages, and the expanding food service sector. The market size reached xx Million in 2024 and is projected to grow at a Compound Annual Growth Rate (CAGR) of xx% from 2025 to 2033. Technological advancements, such as improved processing techniques and packaging solutions, are enhancing efficiency and product quality. Consumer preferences are shifting towards natural and organic syrups, low-sugar options, and unique flavor profiles. The competitive landscape is characterized by intense rivalry, with established players and emerging brands vying for market share through product innovation and strategic partnerships. Market penetration rates are particularly high in developed economies, with emerging markets presenting significant growth opportunities.
Dominant Markets & Segments in Non-Alcoholic Concentrated Syrups Industry
The North American region currently holds the largest market share for Non-Alcoholic Concentrated Syrups, driven by strong consumer demand and established distribution networks. Within the product segments, Fruit Squashes command the largest share due to their wide appeal and versatility. The Off-trade channel (supermarkets, retail stores) dominates sales, representing approximately xx% of the total market.
Key Growth Drivers in North America: Strong consumer demand, established distribution networks, robust retail infrastructure.
Fruit Squashes Dominance: High consumer acceptance, versatility in applications.
Off-trade Channel Predominance: Wide availability, convenient purchase options.
Key Growth Drivers in Asia-Pacific: Rapid urbanization, rising disposable incomes, increasing demand for convenient beverages.
Non-Alcoholic Concentrated Syrups Industry Product Analysis
Product innovation in the Non-Alcoholic Concentrated Syrups market focuses on healthier formulations, reduced sugar content, and unique flavor combinations. Companies are investing in advanced processing technologies to enhance shelf life and quality. The market sees a growing demand for organic and natural syrups, appealing to health-conscious consumers. These innovations aim to improve product differentiation and cater to the evolving consumer preferences.
Key Drivers, Barriers & Challenges in Non-Alcoholic Concentrated Syrups Industry
Key Drivers: Rising disposable incomes, changing lifestyle trends, expanding food service industry, and increasing demand for convenient beverages are major drivers. Technological advancements in processing and packaging contribute to efficiency and quality. Favorable government policies promoting the food processing sector further propel market growth.
Key Challenges: Fluctuating raw material prices, stringent regulatory requirements, intense competition, and supply chain disruptions represent significant challenges. The industry faces pressure to reduce sugar content while maintaining product appeal and affordability. Changes in consumer preferences and the rise of alternative beverages pose additional challenges.
Growth Drivers in the Non-Alcoholic Concentrated Syrups Industry Market
The market is fueled by increasing consumer demand for convenient, flavorful beverages, expanding food service sectors, and rising disposable incomes, particularly in emerging economies. Health-conscious consumers drive the demand for low-sugar and natural options. Technological innovations in processing, packaging, and flavor creation further contribute to market expansion.
Challenges Impacting Non-Alcoholic Concentrated Syrups Industry Growth
Stringent regulations regarding sugar content and labeling create compliance hurdles. Fluctuations in raw material prices impact production costs. Intense competition among established players and new entrants necessitates continuous innovation and cost management. Supply chain disruptions can lead to production delays and reduced availability.
Key Players Shaping the Non-Alcoholic Concentrated Syrups Industry Market
- Pioma Industries Pvt Ltd (Rasna)
- Bickford's Australia Pvt Ltd
- Unilever Ltd
- Tru Blu Beverages
- Suntory Holdings Ltd
- Britvic PLC
- Golden Circle Ltd
Significant Non-Alcoholic Concentrated Syrups Industry Milestones
- 2021: Unilever launches a new range of low-sugar fruit squashes.
- 2022: Britvic invests in sustainable packaging for its concentrated syrups.
- 2023: Pioma Industries (Rasna) expands its distribution network in Southeast Asia.
Future Outlook for Non-Alcoholic Concentrated Syrups Industry Market
The Non-Alcoholic Concentrated Syrups market is poised for continued growth, driven by sustained demand for convenient beverages and innovation in product formulations. Opportunities exist for companies to focus on healthier, natural options, sustainable packaging, and expanding into new markets. The industry will likely experience consolidation, with mergers and acquisitions shaping the competitive landscape.
Non-Alcoholic Concentrated Syrups Industry Segmentation
-
1. Type
- 1.1. Fruit Squashes
- 1.2. Vegetable Squashes
- 1.3. Other Types
-
2. Sales Channel
- 2.1. Off-trade
- 2.2. On-trade
Non-Alcoholic Concentrated Syrups Industry Segmentation By Geography
-
1. North America
- 1.1. United States
- 1.2. Canada
- 1.3. Mexico
- 1.4. Rest of North America
-
2. Europe
- 2.1. Spain
- 2.2. United Kingdom
- 2.3. Germany
- 2.4. France
- 2.5. Italy
- 2.6. Russia
- 2.7. Rest of Europe
-
3. Asia Pacific
- 3.1. China
- 3.2. Japan
- 3.3. India
- 3.4. Australia
- 3.5. Rest of Asia Pacific
-
4. Rest of the World
- 4.1. South America
- 4.2. Middle East
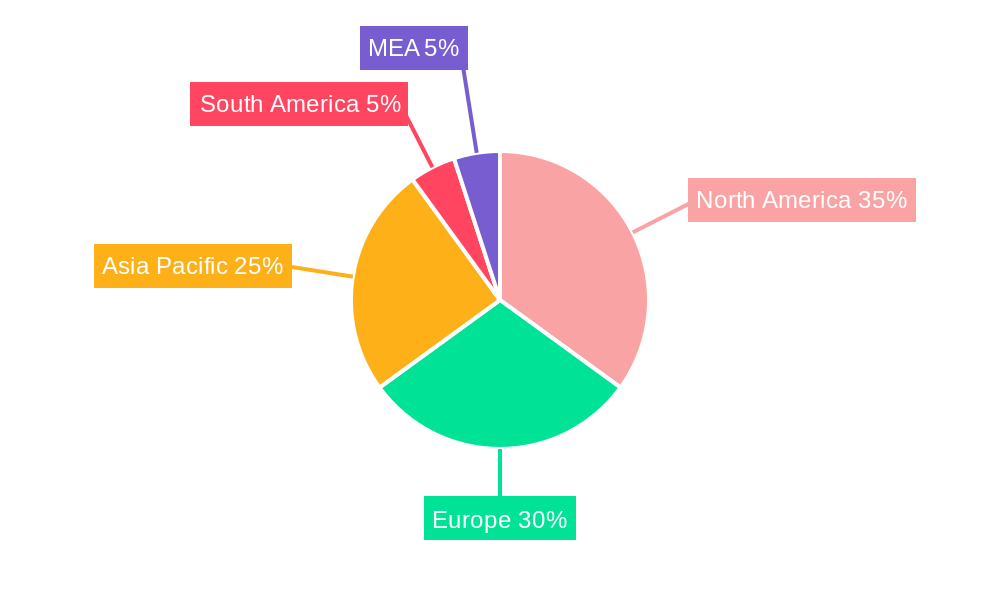
Non-Alcoholic Concentrated Syrups Industry Regional Market Share
Geographic Coverage of Non-Alcoholic Concentrated Syrups Industry
Non-Alcoholic Concentrated Syrups Industry REPORT HIGHLIGHTS
| Aspects | Details |
|---|---|
| Study Period | 2020-2034 |
| Base Year | 2025 |
| Estimated Year | 2026 |
| Forecast Period | 2026-2034 |
| Historical Period | 2020-2025 |
| Growth Rate | CAGR of 14.17% from 2020-2034 |
| Segmentation |
|
Table of Contents
- 1. Introduction
- 1.1. Research Scope
- 1.2. Market Segmentation
- 1.3. Research Objective
- 1.4. Definitions and Assumptions
- 2. Executive Summary
- 2.1. Market Snapshot
- 3. Market Dynamics
- 3.1. Market Drivers
- 3.2. Market Restrains
- 3.3. Market Trends
- 3.4. Market Opportunities
- 4. Market Factor Analysis
- 4.1. Porters Five Forces
- 4.1.1. Bargaining Power of Suppliers
- 4.1.2. Bargaining Power of Buyers
- 4.1.3. Threat of New Entrants
- 4.1.4. Threat of Substitutes
- 4.1.5. Competitive Rivalry
- 4.2. PESTEL analysis
- 4.3. BCG Analysis
- 4.3.1. Stars (High Growth, High Market Share)
- 4.3.2. Cash Cows (Low Growth, High Market Share)
- 4.3.3. Question Mark (High Growth, Low Market Share)
- 4.3.4. Dogs (Low Growth, Low Market Share)
- 4.4. Ansoff Matrix Analysis
- 4.5. Supply Chain Analysis
- 4.6. Regulatory Landscape
- 4.7. Current Market Potential and Opportunity Assessment (TAM–SAM–SOM Framework)
- 4.8. TIR Analyst Note
- 4.1. Porters Five Forces
- 5. Market Analysis, Insights and Forecast 2021-2033
- 5.1. Market Analysis, Insights and Forecast - by Type
- 5.1.1. Fruit Squashes
- 5.1.2. Vegetable Squashes
- 5.1.3. Other Types
- 5.2. Market Analysis, Insights and Forecast - by Sales Channel
- 5.2.1. Off-trade
- 5.2.2. On-trade
- 5.3. Market Analysis, Insights and Forecast - by Region
- 5.3.1. North America
- 5.3.2. Europe
- 5.3.3. Asia Pacific
- 5.3.4. Rest of the World
- 5.1. Market Analysis, Insights and Forecast - by Type
- 6. Global Non-Alcoholic Concentrated Syrups Industry Analysis, Insights and Forecast, 2021-2033
- 6.1. Market Analysis, Insights and Forecast - by Type
- 6.1.1. Fruit Squashes
- 6.1.2. Vegetable Squashes
- 6.1.3. Other Types
- 6.2. Market Analysis, Insights and Forecast - by Sales Channel
- 6.2.1. Off-trade
- 6.2.2. On-trade
- 6.1. Market Analysis, Insights and Forecast - by Type
- 7. North America Non-Alcoholic Concentrated Syrups Industry Analysis, Insights and Forecast, 2020-2032
- 7.1. Market Analysis, Insights and Forecast - by Type
- 7.1.1. Fruit Squashes
- 7.1.2. Vegetable Squashes
- 7.1.3. Other Types
- 7.2. Market Analysis, Insights and Forecast - by Sales Channel
- 7.2.1. Off-trade
- 7.2.2. On-trade
- 7.1. Market Analysis, Insights and Forecast - by Type
- 8. Europe Non-Alcoholic Concentrated Syrups Industry Analysis, Insights and Forecast, 2020-2032
- 8.1. Market Analysis, Insights and Forecast - by Type
- 8.1.1. Fruit Squashes
- 8.1.2. Vegetable Squashes
- 8.1.3. Other Types
- 8.2. Market Analysis, Insights and Forecast - by Sales Channel
- 8.2.1. Off-trade
- 8.2.2. On-trade
- 8.1. Market Analysis, Insights and Forecast - by Type
- 9. Asia Pacific Non-Alcoholic Concentrated Syrups Industry Analysis, Insights and Forecast, 2020-2032
- 9.1. Market Analysis, Insights and Forecast - by Type
- 9.1.1. Fruit Squashes
- 9.1.2. Vegetable Squashes
- 9.1.3. Other Types
- 9.2. Market Analysis, Insights and Forecast - by Sales Channel
- 9.2.1. Off-trade
- 9.2.2. On-trade
- 9.1. Market Analysis, Insights and Forecast - by Type
- 10. Rest of the World Non-Alcoholic Concentrated Syrups Industry Analysis, Insights and Forecast, 2020-2032
- 10.1. Market Analysis, Insights and Forecast - by Type
- 10.1.1. Fruit Squashes
- 10.1.2. Vegetable Squashes
- 10.1.3. Other Types
- 10.2. Market Analysis, Insights and Forecast - by Sales Channel
- 10.2.1. Off-trade
- 10.2.2. On-trade
- 10.1. Market Analysis, Insights and Forecast - by Type
- 11. Competitive Analysis
- 11.1. Company Profiles
- 11.1.1 Pioma Industries Pvt Ltd (Rasna)
- 11.1.1.1. Company Overview
- 11.1.1.2. Products
- 11.1.1.3. Company Financials
- 11.1.1.4. SWOT Analysis
- 11.1.2 Bickford's Australia Pvt Ltd
- 11.1.2.1. Company Overview
- 11.1.2.2. Products
- 11.1.2.3. Company Financials
- 11.1.2.4. SWOT Analysis
- 11.1.3 Unilever Ltd
- 11.1.3.1. Company Overview
- 11.1.3.2. Products
- 11.1.3.3. Company Financials
- 11.1.3.4. SWOT Analysis
- 11.1.4 Tru Blu Beverages
- 11.1.4.1. Company Overview
- 11.1.4.2. Products
- 11.1.4.3. Company Financials
- 11.1.4.4. SWOT Analysis
- 11.1.5 Suntory Holdings Lt
- 11.1.5.1. Company Overview
- 11.1.5.2. Products
- 11.1.5.3. Company Financials
- 11.1.5.4. SWOT Analysis
- 11.1.6 Britvic PLC
- 11.1.6.1. Company Overview
- 11.1.6.2. Products
- 11.1.6.3. Company Financials
- 11.1.6.4. SWOT Analysis
- 11.1.7 Golden Circle Ltd
- 11.1.7.1. Company Overview
- 11.1.7.2. Products
- 11.1.7.3. Company Financials
- 11.1.7.4. SWOT Analysis
- 11.1.1 Pioma Industries Pvt Ltd (Rasna)
- 11.2. Market Entropy
- 11.2.1 Company's Key Areas Served
- 11.2.2 Recent Developments
- 11.3. Company Market Share Analysis 2025
- 11.3.1 Top 5 Companies Market Share Analysis
- 11.3.2 Top 3 Companies Market Share Analysis
- 11.4. List of Potential Customers
- 12. Research Methodology
List of Figures
- Figure 1: Global Non-Alcoholic Concentrated Syrups Industry Revenue Breakdown (billion, %) by Region 2025 & 2033
- Figure 2: North America Non-Alcoholic Concentrated Syrups Industry Revenue (billion), by Type 2025 & 2033
- Figure 3: North America Non-Alcoholic Concentrated Syrups Industry Revenue Share (%), by Type 2025 & 2033
- Figure 4: North America Non-Alcoholic Concentrated Syrups Industry Revenue (billion), by Sales Channel 2025 & 2033
- Figure 5: North America Non-Alcoholic Concentrated Syrups Industry Revenue Share (%), by Sales Channel 2025 & 2033
- Figure 6: North America Non-Alcoholic Concentrated Syrups Industry Revenue (billion), by Country 2025 & 2033
- Figure 7: North America Non-Alcoholic Concentrated Syrups Industry Revenue Share (%), by Country 2025 & 2033
- Figure 8: Europe Non-Alcoholic Concentrated Syrups Industry Revenue (billion), by Type 2025 & 2033
- Figure 9: Europe Non-Alcoholic Concentrated Syrups Industry Revenue Share (%), by Type 2025 & 2033
- Figure 10: Europe Non-Alcoholic Concentrated Syrups Industry Revenue (billion), by Sales Channel 2025 & 2033
- Figure 11: Europe Non-Alcoholic Concentrated Syrups Industry Revenue Share (%), by Sales Channel 2025 & 2033
- Figure 12: Europe Non-Alcoholic Concentrated Syrups Industry Revenue (billion), by Country 2025 & 2033
- Figure 13: Europe Non-Alcoholic Concentrated Syrups Industry Revenue Share (%), by Country 2025 & 2033
- Figure 14: Asia Pacific Non-Alcoholic Concentrated Syrups Industry Revenue (billion), by Type 2025 & 2033
- Figure 15: Asia Pacific Non-Alcoholic Concentrated Syrups Industry Revenue Share (%), by Type 2025 & 2033
- Figure 16: Asia Pacific Non-Alcoholic Concentrated Syrups Industry Revenue (billion), by Sales Channel 2025 & 2033
- Figure 17: Asia Pacific Non-Alcoholic Concentrated Syrups Industry Revenue Share (%), by Sales Channel 2025 & 2033
- Figure 18: Asia Pacific Non-Alcoholic Concentrated Syrups Industry Revenue (billion), by Country 2025 & 2033
- Figure 19: Asia Pacific Non-Alcoholic Concentrated Syrups Industry Revenue Share (%), by Country 2025 & 2033
- Figure 20: Rest of the World Non-Alcoholic Concentrated Syrups Industry Revenue (billion), by Type 2025 & 2033
- Figure 21: Rest of the World Non-Alcoholic Concentrated Syrups Industry Revenue Share (%), by Type 2025 & 2033
- Figure 22: Rest of the World Non-Alcoholic Concentrated Syrups Industry Revenue (billion), by Sales Channel 2025 & 2033
- Figure 23: Rest of the World Non-Alcoholic Concentrated Syrups Industry Revenue Share (%), by Sales Channel 2025 & 2033
- Figure 24: Rest of the World Non-Alcoholic Concentrated Syrups Industry Revenue (billion), by Country 2025 & 2033
- Figure 25: Rest of the World Non-Alcoholic Concentrated Syrups Industry Revenue Share (%), by Country 2025 & 2033
List of Tables
- Table 1: Global Non-Alcoholic Concentrated Syrups Industry Revenue billion Forecast, by Type 2020 & 2033
- Table 2: Global Non-Alcoholic Concentrated Syrups Industry Revenue billion Forecast, by Sales Channel 2020 & 2033
- Table 3: Global Non-Alcoholic Concentrated Syrups Industry Revenue billion Forecast, by Region 2020 & 2033
- Table 4: Global Non-Alcoholic Concentrated Syrups Industry Revenue billion Forecast, by Type 2020 & 2033
- Table 5: Global Non-Alcoholic Concentrated Syrups Industry Revenue billion Forecast, by Sales Channel 2020 & 2033
- Table 6: Global Non-Alcoholic Concentrated Syrups Industry Revenue billion Forecast, by Country 2020 & 2033
- Table 7: United States Non-Alcoholic Concentrated Syrups Industry Revenue (billion) Forecast, by Application 2020 & 2033
- Table 8: Canada Non-Alcoholic Concentrated Syrups Industry Revenue (billion) Forecast, by Application 2020 & 2033
- Table 9: Mexico Non-Alcoholic Concentrated Syrups Industry Revenue (billion) Forecast, by Application 2020 & 2033
- Table 10: Rest of North America Non-Alcoholic Concentrated Syrups Industry Revenue (billion) Forecast, by Application 2020 & 2033
- Table 11: Global Non-Alcoholic Concentrated Syrups Industry Revenue billion Forecast, by Type 2020 & 2033
- Table 12: Global Non-Alcoholic Concentrated Syrups Industry Revenue billion Forecast, by Sales Channel 2020 & 2033
- Table 13: Global Non-Alcoholic Concentrated Syrups Industry Revenue billion Forecast, by Country 2020 & 2033
- Table 14: Spain Non-Alcoholic Concentrated Syrups Industry Revenue (billion) Forecast, by Application 2020 & 2033
- Table 15: United Kingdom Non-Alcoholic Concentrated Syrups Industry Revenue (billion) Forecast, by Application 2020 & 2033
- Table 16: Germany Non-Alcoholic Concentrated Syrups Industry Revenue (billion) Forecast, by Application 2020 & 2033
- Table 17: France Non-Alcoholic Concentrated Syrups Industry Revenue (billion) Forecast, by Application 2020 & 2033
- Table 18: Italy Non-Alcoholic Concentrated Syrups Industry Revenue (billion) Forecast, by Application 2020 & 2033
- Table 19: Russia Non-Alcoholic Concentrated Syrups Industry Revenue (billion) Forecast, by Application 2020 & 2033
- Table 20: Rest of Europe Non-Alcoholic Concentrated Syrups Industry Revenue (billion) Forecast, by Application 2020 & 2033
- Table 21: Global Non-Alcoholic Concentrated Syrups Industry Revenue billion Forecast, by Type 2020 & 2033
- Table 22: Global Non-Alcoholic Concentrated Syrups Industry Revenue billion Forecast, by Sales Channel 2020 & 2033
- Table 23: Global Non-Alcoholic Concentrated Syrups Industry Revenue billion Forecast, by Country 2020 & 2033
- Table 24: China Non-Alcoholic Concentrated Syrups Industry Revenue (billion) Forecast, by Application 2020 & 2033
- Table 25: Japan Non-Alcoholic Concentrated Syrups Industry Revenue (billion) Forecast, by Application 2020 & 2033
- Table 26: India Non-Alcoholic Concentrated Syrups Industry Revenue (billion) Forecast, by Application 2020 & 2033
- Table 27: Australia Non-Alcoholic Concentrated Syrups Industry Revenue (billion) Forecast, by Application 2020 & 2033
- Table 28: Rest of Asia Pacific Non-Alcoholic Concentrated Syrups Industry Revenue (billion) Forecast, by Application 2020 & 2033
- Table 29: Global Non-Alcoholic Concentrated Syrups Industry Revenue billion Forecast, by Type 2020 & 2033
- Table 30: Global Non-Alcoholic Concentrated Syrups Industry Revenue billion Forecast, by Sales Channel 2020 & 2033
- Table 31: Global Non-Alcoholic Concentrated Syrups Industry Revenue billion Forecast, by Country 2020 & 2033
- Table 32: South America Non-Alcoholic Concentrated Syrups Industry Revenue (billion) Forecast, by Application 2020 & 2033
- Table 33: Middle East Non-Alcoholic Concentrated Syrups Industry Revenue (billion) Forecast, by Application 2020 & 2033
Frequently Asked Questions
1. What is the projected Compound Annual Growth Rate (CAGR) of the Non-Alcoholic Concentrated Syrups Industry?
The projected CAGR is approximately 14.17%.
2. Which companies are prominent players in the Non-Alcoholic Concentrated Syrups Industry?
Key companies in the market include Pioma Industries Pvt Ltd (Rasna), Bickford's Australia Pvt Ltd, Unilever Ltd, Tru Blu Beverages, Suntory Holdings Lt, Britvic PLC, Golden Circle Ltd.
3. What are the main segments of the Non-Alcoholic Concentrated Syrups Industry?
The market segments include Type, Sales Channel.
4. Can you provide details about the market size?
The market size is estimated to be USD 10.97 billion as of 2022.
5. What are some drivers contributing to market growth?
The ease of use and long shelf life of concentrated syrups make them popular for both commercial use and at-home preparation of beverages..
6. What are the notable trends driving market growth?
Increasing interest in syrups made with natural ingredients. reduced sugar content. and organic certifications to cater to health-conscious consumers.
7. Are there any restraints impacting market growth?
Some consumers may be wary of concentrated syrups due to concerns about high sugar content and artificial ingredients. which can affect market growth.
8. Can you provide examples of recent developments in the market?
N/A
9. What pricing options are available for accessing the report?
Pricing options include single-user, multi-user, and enterprise licenses priced at USD 4750, USD 5250, and USD 8750 respectively.
10. Is the market size provided in terms of value or volume?
The market size is provided in terms of value, measured in billion.
11. Are there any specific market keywords associated with the report?
Yes, the market keyword associated with the report is "Non-Alcoholic Concentrated Syrups Industry," which aids in identifying and referencing the specific market segment covered.
12. How do I determine which pricing option suits my needs best?
The pricing options vary based on user requirements and access needs. Individual users may opt for single-user licenses, while businesses requiring broader access may choose multi-user or enterprise licenses for cost-effective access to the report.
13. Are there any additional resources or data provided in the Non-Alcoholic Concentrated Syrups Industry report?
While the report offers comprehensive insights, it's advisable to review the specific contents or supplementary materials provided to ascertain if additional resources or data are available.
14. How can I stay updated on further developments or reports in the Non-Alcoholic Concentrated Syrups Industry?
To stay informed about further developments, trends, and reports in the Non-Alcoholic Concentrated Syrups Industry, consider subscribing to industry newsletters, following relevant companies and organizations, or regularly checking reputable industry news sources and publications.
Methodology
Step 1 - Identification of Relevant Samples Size from Population Database


Step 2 - Approaches for Defining Global Market Size (Value, Volume* & Price*)

Note*: In applicable scenarios
Step 3 - Data Sources
Primary Research
- Web Analytics
- Survey Reports
- Research Institute
- Latest Research Reports
- Opinion Leaders
Secondary Research
- Annual Reports
- White Paper
- Latest Press Release
- Industry Association
- Paid Database
- Investor Presentations

Step 4 - Data Triangulation
Involves using different sources of information in order to increase the validity of a study
These sources are likely to be stakeholders in a program - participants, other researchers, program staff, other community members, and so on.
Then we put all data in single framework & apply various statistical tools to find out the dynamic on the market.
During the analysis stage, feedback from the stakeholder groups would be compared to determine areas of agreement as well as areas of divergence