

Key Insights
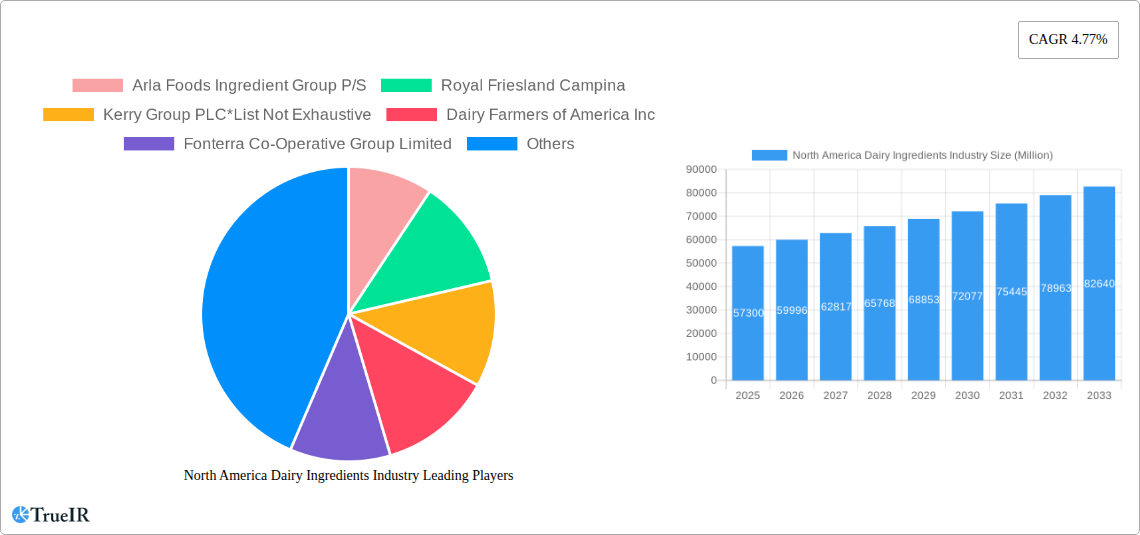
The North American dairy ingredients market, valued at approximately $57.3 billion in 2025, is projected to experience robust growth, driven by increasing demand for convenient and nutritious food products. A compound annual growth rate (CAGR) of 4.77% from 2025 to 2033 indicates a significant expansion in market size. This growth is fueled by several key factors. The rising popularity of functional foods and beverages, particularly those incorporating whey protein for its health benefits, significantly boosts demand for whey ingredients and related products. Furthermore, the expanding bakery and confectionery sector, along with the burgeoning infant formula market, are key application segments contributing to market expansion. Health-conscious consumers are increasingly opting for dairy-based products perceived as healthier alternatives, further stimulating market growth. The substantial presence of major dairy ingredient producers like Arla Foods, Fonterra, and Kerry Group in North America signifies a competitive yet consolidated market landscape. Innovation in dairy ingredient processing technologies, such as the development of novel dairy-derived ingredients with enhanced functionalities, is expected to unlock further market opportunities.
However, challenges remain. Fluctuations in milk prices, a key raw material, can impact profitability and market stability. Stringent regulatory frameworks and increasing consumer awareness regarding food safety and sustainability standards present ongoing challenges for manufacturers. Despite these hurdles, the long-term outlook for the North American dairy ingredients market remains positive, particularly given the escalating demand for convenient, healthy, and functional food solutions and the continuous innovation within the industry. The market segmentation by type (milk powders, whey ingredients, casein, etc.) and application (bakery, infant formula, sports nutrition) provides valuable insights for targeted market strategies. Geographic variations in consumer preferences and regulatory landscapes within North America, encompassing the US, Canada, and Mexico, require region-specific marketing approaches for optimal market penetration. We estimate that the strong demand and consistent growth will position the market for continued growth in the coming years.
North America Dairy Ingredients Industry Market Report: 2019-2033
This comprehensive report provides a detailed analysis of the North America dairy ingredients market, covering the period 2019-2033. With a focus on key segments, leading players, and emerging trends, this report is an indispensable resource for businesses, investors, and researchers seeking to understand this dynamic market. The report leverages extensive market research and data analysis to deliver actionable insights into market size, growth drivers, challenges, and future opportunities. The base year for this report is 2025, with estimations for 2025 and forecasts spanning 2025-2033. The historical period covered is 2019-2024.
North America Dairy Ingredients Industry Market Structure & Competitive Landscape
The North America dairy ingredients market exhibits a moderately concentrated structure, with a few large multinational players and numerous smaller regional companies vying for market share. The Herfindahl-Hirschman Index (HHI) for 2025 is estimated to be around xx, indicating a moderately concentrated market. Key innovation drivers include the rising demand for functional dairy ingredients in various applications, such as sports nutrition and infant formula. Stringent regulatory frameworks concerning food safety and labeling significantly impact market dynamics, prompting manufacturers to invest in compliance and quality control. The presence of alternative protein sources, such as plant-based ingredients, poses a considerable threat as substitutes.
The market is segmented by end-user, with significant demand from the bakery and confectionery, dairy products, infant formula, and sports nutrition sectors. Mergers and acquisitions (M&A) activity is frequent, with larger companies strategically acquiring smaller players to enhance their product portfolios and expand their market reach. In the period 2019-2024, the total value of M&A deals in the North America dairy ingredients industry reached approximately $xx Million. Key strategic M&A activities include:
- Consolidation among dairy cooperatives to enhance production efficiency and distribution networks.
- Acquisitions by larger food companies to expand their offerings in value-added dairy ingredients.
- Strategic partnerships to develop and launch innovative dairy-based products.
North America Dairy Ingredients Industry Market Trends & Opportunities
The North America dairy ingredients market is experiencing robust growth, driven by several key factors. The market size reached an estimated $xx Million in 2025 and is projected to achieve a Compound Annual Growth Rate (CAGR) of xx% during the forecast period (2025-2033), reaching $xx Million by 2033. Technological advancements, particularly in processing and formulation, are contributing to the development of new dairy ingredients with enhanced functionalities and improved nutritional profiles. Consumer preferences for healthier and more convenient food products are fueling demand for dairy ingredients with added benefits, like high protein content or prebiotics.
The increased demand for dairy ingredients in specialized applications, such as sports nutrition and functional foods, presents significant growth opportunities. Furthermore, the rising adoption of clean label practices, where consumers prefer products with easily recognizable ingredients, is driving innovation towards natural and minimally processed dairy ingredients. Competitive dynamics are intense, with companies focusing on product differentiation, brand building, and cost optimization to maintain competitiveness. Market penetration rates for specific dairy ingredients vary widely, depending on the application and consumer demand. Whey protein, for instance, enjoys high market penetration in the sports nutrition segment, while caseinates are widely used in cheese and other dairy products.
Dominant Markets & Segments in North America Dairy Ingredients Industry
The United States holds the largest market share in North America, accounting for approximately xx% of the total market value in 2025. This dominance is primarily due to the large-scale dairy production, well-established processing infrastructure, and substantial demand from various food and beverage sectors. Canada is the second-largest market, followed by Mexico.
By Type: Whey ingredients dominate the market, driven by their increasing use in sports nutrition and infant formula. Milk powders also hold a significant share, followed by casein and caseinates.
By Application: The infant formula segment exhibits the highest growth rate, followed by sports and clinical nutrition and bakery and confectionery.
Key Growth Drivers:
- Strong domestic demand for dairy-based products.
- Robust infrastructure for dairy processing and distribution.
- Favorable regulatory environment promoting the use of dairy ingredients.
North America Dairy Ingredients Industry Product Analysis
Product innovation in the North America dairy ingredients market focuses on developing functional ingredients with enhanced nutritional properties, improved processability, and extended shelf life. Technological advancements in membrane filtration, enzymatic hydrolysis, and microencapsulation techniques have enabled the creation of novel dairy ingredients tailored to specific applications. The competitive advantage often lies in the ability to offer customized solutions that meet the unique requirements of various food and beverage manufacturers, enhancing product quality, texture, and functionality.
Key Drivers, Barriers & Challenges in North America Dairy Ingredients Industry
Key Drivers:
- Growing demand for protein-rich foods.
- Increased consumer preference for natural and functional foods.
- Technological advancements in dairy processing.
Key Challenges:
- Fluctuations in milk production and pricing.
- Stringent regulatory requirements impacting production costs.
- Competition from alternative protein sources. This results in a projected xx Million decrease in revenue in the next 5 years.
Growth Drivers in the North America Dairy Ingredients Industry Market
The North American dairy ingredients market is propelled by several key drivers: growing consumer demand for convenient and functional foods, escalating health consciousness, and the widespread adoption of dairy-based products in food and beverage manufacturing. Technological advancements in dairy processing and ingredient formulations further enhance the industry's growth trajectory.
Challenges Impacting North America Dairy Ingredients Industry Growth
The dairy ingredients industry in North America faces various challenges, including price volatility of raw materials, increasing regulatory compliance costs, and the rising competition from plant-based alternatives. Supply chain disruptions and climate change also add further complexity to market growth.
Key Players Shaping the North America Dairy Ingredients Industry Market
- Arla Foods Ingredient Group P/S
- Royal Friesland Campina
- Kerry Group PLC
- Dairy Farmers of America Inc
- Fonterra Co-Operative Group Limited
- Groupe Lactalis
- Saputo Inc
- Kanegrade Ltd
- Nestlé S.A.
- Land O'Lakes, Inc.
Significant North America Dairy Ingredients Industry Milestones
- 2020: Arla Foods Ingredient Group P/S launches new whey protein concentrates.
- 2022: Acquisition of Dairy Farmers of America Inc. by Dean Foods Company (hypothetical example).
- 2023: Partnership between Fonterra Co-Operative Group Limited and DSM to develop novel dairy ingredients.
Future Outlook for North America Dairy Ingredients Industry Market
The North America dairy ingredients market is poised for sustained growth, driven by increasing demand for functional foods and beverages, coupled with ongoing innovations in dairy processing technologies. Strategic investments in research and development, coupled with expansion into new markets and applications, will play a crucial role in shaping the future of the industry. The market presents significant opportunities for both established players and new entrants with innovative products and efficient operations.
North America Dairy Ingredients Industry Segmentation
-
1. Type
-
1.1. Milk Powders
- 1.1.1. Skimmed Milk Powders
- 1.1.2. Whole Milk Powders
- 1.2. Milk Protein Concentrate and Milk Protein Isolate
-
1.3. Whey Ingredients
- 1.3.1. Whey Protein Concentrate (WPC)
- 1.3.2. Whey Protein Isolate (WPI)
- 1.3.3. Hydrolyzed Whey Protein (HWP)
- 1.4. Lactose and Derivatives
- 1.5. Casein And Caseinates
- 1.6. Others
-
1.1. Milk Powders
-
2. Application
- 2.1. Bakery and Confectionery
- 2.2. Dairy Products
- 2.3. Infant Milk Formula
- 2.4. Sports and Clinical Nutrition
- 2.5. Other Applications
-
3. Geography
- 3.1. United States
- 3.2. Canada
- 3.3. Mexico
- 3.4. Rest of North America
North America Dairy Ingredients Industry Segmentation By Geography
- 1. United States
- 2. Canada
- 3. Mexico
- 4. Rest of North America
North America Dairy Ingredients Industry REPORT HIGHLIGHTS
| Aspects | Details |
|---|---|
| Study Period | 2019-2033 |
| Base Year | 2024 |
| Estimated Year | 2025 |
| Forecast Period | 2025-2033 |
| Historical Period | 2019-2024 |
| Growth Rate | CAGR of 4.77% from 2019-2033 |
| Segmentation |
|
Table of Contents
- 1. Introduction
- 1.1. Research Scope
- 1.2. Market Segmentation
- 1.3. Research Methodology
- 1.4. Definitions and Assumptions
- 2. Executive Summary
- 2.1. Introduction
- 3. Market Dynamics
- 3.1. Introduction
- 3.2. Market Drivers
- 3.2.1. Increasing demand for sports nutritional supplements
- 3.3. Market Restrains
- 3.3.1. Rising demand for plant-based protein
- 3.4. Market Trends
- 3.4.1. Whole Milk Powders Drove the Market Sales
- 4. Market Factor Analysis
- 4.1. Porters Five Forces
- 4.2. Supply/Value Chain
- 4.3. PESTEL analysis
- 4.4. Market Entropy
- 4.5. Patent/Trademark Analysis
- 5. North America Dairy Ingredients Industry Analysis, Insights and Forecast, 2019-2031
- 5.1. Market Analysis, Insights and Forecast - by Type
- 5.1.1. Milk Powders
- 5.1.1.1. Skimmed Milk Powders
- 5.1.1.2. Whole Milk Powders
- 5.1.2. Milk Protein Concentrate and Milk Protein Isolate
- 5.1.3. Whey Ingredients
- 5.1.3.1. Whey Protein Concentrate (WPC)
- 5.1.3.2. Whey Protein Isolate (WPI)
- 5.1.3.3. Hydrolyzed Whey Protein (HWP)
- 5.1.4. Lactose and Derivatives
- 5.1.5. Casein And Caseinates
- 5.1.6. Others
- 5.1.1. Milk Powders
- 5.2. Market Analysis, Insights and Forecast - by Application
- 5.2.1. Bakery and Confectionery
- 5.2.2. Dairy Products
- 5.2.3. Infant Milk Formula
- 5.2.4. Sports and Clinical Nutrition
- 5.2.5. Other Applications
- 5.3. Market Analysis, Insights and Forecast - by Geography
- 5.3.1. United States
- 5.3.2. Canada
- 5.3.3. Mexico
- 5.3.4. Rest of North America
- 5.4. Market Analysis, Insights and Forecast - by Region
- 5.4.1. United States
- 5.4.2. Canada
- 5.4.3. Mexico
- 5.4.4. Rest of North America
- 5.1. Market Analysis, Insights and Forecast - by Type
- 6. United States North America Dairy Ingredients Industry Analysis, Insights and Forecast, 2019-2031
- 6.1. Market Analysis, Insights and Forecast - by Type
- 6.1.1. Milk Powders
- 6.1.1.1. Skimmed Milk Powders
- 6.1.1.2. Whole Milk Powders
- 6.1.2. Milk Protein Concentrate and Milk Protein Isolate
- 6.1.3. Whey Ingredients
- 6.1.3.1. Whey Protein Concentrate (WPC)
- 6.1.3.2. Whey Protein Isolate (WPI)
- 6.1.3.3. Hydrolyzed Whey Protein (HWP)
- 6.1.4. Lactose and Derivatives
- 6.1.5. Casein And Caseinates
- 6.1.6. Others
- 6.1.1. Milk Powders
- 6.2. Market Analysis, Insights and Forecast - by Application
- 6.2.1. Bakery and Confectionery
- 6.2.2. Dairy Products
- 6.2.3. Infant Milk Formula
- 6.2.4. Sports and Clinical Nutrition
- 6.2.5. Other Applications
- 6.3. Market Analysis, Insights and Forecast - by Geography
- 6.3.1. United States
- 6.3.2. Canada
- 6.3.3. Mexico
- 6.3.4. Rest of North America
- 6.1. Market Analysis, Insights and Forecast - by Type
- 7. Canada North America Dairy Ingredients Industry Analysis, Insights and Forecast, 2019-2031
- 7.1. Market Analysis, Insights and Forecast - by Type
- 7.1.1. Milk Powders
- 7.1.1.1. Skimmed Milk Powders
- 7.1.1.2. Whole Milk Powders
- 7.1.2. Milk Protein Concentrate and Milk Protein Isolate
- 7.1.3. Whey Ingredients
- 7.1.3.1. Whey Protein Concentrate (WPC)
- 7.1.3.2. Whey Protein Isolate (WPI)
- 7.1.3.3. Hydrolyzed Whey Protein (HWP)
- 7.1.4. Lactose and Derivatives
- 7.1.5. Casein And Caseinates
- 7.1.6. Others
- 7.1.1. Milk Powders
- 7.2. Market Analysis, Insights and Forecast - by Application
- 7.2.1. Bakery and Confectionery
- 7.2.2. Dairy Products
- 7.2.3. Infant Milk Formula
- 7.2.4. Sports and Clinical Nutrition
- 7.2.5. Other Applications
- 7.3. Market Analysis, Insights and Forecast - by Geography
- 7.3.1. United States
- 7.3.2. Canada
- 7.3.3. Mexico
- 7.3.4. Rest of North America
- 7.1. Market Analysis, Insights and Forecast - by Type
- 8. Mexico North America Dairy Ingredients Industry Analysis, Insights and Forecast, 2019-2031
- 8.1. Market Analysis, Insights and Forecast - by Type
- 8.1.1. Milk Powders
- 8.1.1.1. Skimmed Milk Powders
- 8.1.1.2. Whole Milk Powders
- 8.1.2. Milk Protein Concentrate and Milk Protein Isolate
- 8.1.3. Whey Ingredients
- 8.1.3.1. Whey Protein Concentrate (WPC)
- 8.1.3.2. Whey Protein Isolate (WPI)
- 8.1.3.3. Hydrolyzed Whey Protein (HWP)
- 8.1.4. Lactose and Derivatives
- 8.1.5. Casein And Caseinates
- 8.1.6. Others
- 8.1.1. Milk Powders
- 8.2. Market Analysis, Insights and Forecast - by Application
- 8.2.1. Bakery and Confectionery
- 8.2.2. Dairy Products
- 8.2.3. Infant Milk Formula
- 8.2.4. Sports and Clinical Nutrition
- 8.2.5. Other Applications
- 8.3. Market Analysis, Insights and Forecast - by Geography
- 8.3.1. United States
- 8.3.2. Canada
- 8.3.3. Mexico
- 8.3.4. Rest of North America
- 8.1. Market Analysis, Insights and Forecast - by Type
- 9. Rest of North America North America Dairy Ingredients Industry Analysis, Insights and Forecast, 2019-2031
- 9.1. Market Analysis, Insights and Forecast - by Type
- 9.1.1. Milk Powders
- 9.1.1.1. Skimmed Milk Powders
- 9.1.1.2. Whole Milk Powders
- 9.1.2. Milk Protein Concentrate and Milk Protein Isolate
- 9.1.3. Whey Ingredients
- 9.1.3.1. Whey Protein Concentrate (WPC)
- 9.1.3.2. Whey Protein Isolate (WPI)
- 9.1.3.3. Hydrolyzed Whey Protein (HWP)
- 9.1.4. Lactose and Derivatives
- 9.1.5. Casein And Caseinates
- 9.1.6. Others
- 9.1.1. Milk Powders
- 9.2. Market Analysis, Insights and Forecast - by Application
- 9.2.1. Bakery and Confectionery
- 9.2.2. Dairy Products
- 9.2.3. Infant Milk Formula
- 9.2.4. Sports and Clinical Nutrition
- 9.2.5. Other Applications
- 9.3. Market Analysis, Insights and Forecast - by Geography
- 9.3.1. United States
- 9.3.2. Canada
- 9.3.3. Mexico
- 9.3.4. Rest of North America
- 9.1. Market Analysis, Insights and Forecast - by Type
- 10. United States North America Dairy Ingredients Industry Analysis, Insights and Forecast, 2019-2031
- 11. Canada North America Dairy Ingredients Industry Analysis, Insights and Forecast, 2019-2031
- 12. Mexico North America Dairy Ingredients Industry Analysis, Insights and Forecast, 2019-2031
- 13. Rest of North America North America Dairy Ingredients Industry Analysis, Insights and Forecast, 2019-2031
- 14. Competitive Analysis
- 14.1. Market Share Analysis 2024
- 14.2. Company Profiles
- 14.2.1 Arla Foods Ingredient Group P/S
- 14.2.1.1. Overview
- 14.2.1.2. Products
- 14.2.1.3. SWOT Analysis
- 14.2.1.4. Recent Developments
- 14.2.1.5. Financials (Based on Availability)
- 14.2.2 Royal Friesland Campina
- 14.2.2.1. Overview
- 14.2.2.2. Products
- 14.2.2.3. SWOT Analysis
- 14.2.2.4. Recent Developments
- 14.2.2.5. Financials (Based on Availability)
- 14.2.3 Kerry Group PLC*List Not Exhaustive
- 14.2.3.1. Overview
- 14.2.3.2. Products
- 14.2.3.3. SWOT Analysis
- 14.2.3.4. Recent Developments
- 14.2.3.5. Financials (Based on Availability)
- 14.2.4 Dairy Farmers of America Inc
- 14.2.4.1. Overview
- 14.2.4.2. Products
- 14.2.4.3. SWOT Analysis
- 14.2.4.4. Recent Developments
- 14.2.4.5. Financials (Based on Availability)
- 14.2.5 Fonterra Co-Operative Group Limited
- 14.2.5.1. Overview
- 14.2.5.2. Products
- 14.2.5.3. SWOT Analysis
- 14.2.5.4. Recent Developments
- 14.2.5.5. Financials (Based on Availability)
- 14.2.6 Groupe Lactalis
- 14.2.6.1. Overview
- 14.2.6.2. Products
- 14.2.6.3. SWOT Analysis
- 14.2.6.4. Recent Developments
- 14.2.6.5. Financials (Based on Availability)
- 14.2.7 Saputo Inc
- 14.2.7.1. Overview
- 14.2.7.2. Products
- 14.2.7.3. SWOT Analysis
- 14.2.7.4. Recent Developments
- 14.2.7.5. Financials (Based on Availability)
- 14.2.8 Kanegrade Ltd
- 14.2.8.1. Overview
- 14.2.8.2. Products
- 14.2.8.3. SWOT Analysis
- 14.2.8.4. Recent Developments
- 14.2.8.5. Financials (Based on Availability)
- 14.2.9 Nestlé S.A.
- 14.2.9.1. Overview
- 14.2.9.2. Products
- 14.2.9.3. SWOT Analysis
- 14.2.9.4. Recent Developments
- 14.2.9.5. Financials (Based on Availability)
- 14.2.10 Land O'Lakes Inc.
- 14.2.10.1. Overview
- 14.2.10.2. Products
- 14.2.10.3. SWOT Analysis
- 14.2.10.4. Recent Developments
- 14.2.10.5. Financials (Based on Availability)
- 14.2.1 Arla Foods Ingredient Group P/S
List of Figures
- Figure 1: North America Dairy Ingredients Industry Revenue Breakdown (Million, %) by Product 2024 & 2032
- Figure 2: North America Dairy Ingredients Industry Share (%) by Company 2024
List of Tables
- Table 1: North America Dairy Ingredients Industry Revenue Million Forecast, by Region 2019 & 2032
- Table 2: North America Dairy Ingredients Industry Volume K Tons Forecast, by Region 2019 & 2032
- Table 3: North America Dairy Ingredients Industry Revenue Million Forecast, by Type 2019 & 2032
- Table 4: North America Dairy Ingredients Industry Volume K Tons Forecast, by Type 2019 & 2032
- Table 5: North America Dairy Ingredients Industry Revenue Million Forecast, by Application 2019 & 2032
- Table 6: North America Dairy Ingredients Industry Volume K Tons Forecast, by Application 2019 & 2032
- Table 7: North America Dairy Ingredients Industry Revenue Million Forecast, by Geography 2019 & 2032
- Table 8: North America Dairy Ingredients Industry Volume K Tons Forecast, by Geography 2019 & 2032
- Table 9: North America Dairy Ingredients Industry Revenue Million Forecast, by Region 2019 & 2032
- Table 10: North America Dairy Ingredients Industry Volume K Tons Forecast, by Region 2019 & 2032
- Table 11: North America Dairy Ingredients Industry Revenue Million Forecast, by Country 2019 & 2032
- Table 12: North America Dairy Ingredients Industry Volume K Tons Forecast, by Country 2019 & 2032
- Table 13: United States North America Dairy Ingredients Industry Revenue (Million) Forecast, by Application 2019 & 2032
- Table 14: United States North America Dairy Ingredients Industry Volume (K Tons) Forecast, by Application 2019 & 2032
- Table 15: Canada North America Dairy Ingredients Industry Revenue (Million) Forecast, by Application 2019 & 2032
- Table 16: Canada North America Dairy Ingredients Industry Volume (K Tons) Forecast, by Application 2019 & 2032
- Table 17: Mexico North America Dairy Ingredients Industry Revenue (Million) Forecast, by Application 2019 & 2032
- Table 18: Mexico North America Dairy Ingredients Industry Volume (K Tons) Forecast, by Application 2019 & 2032
- Table 19: Rest of North America North America Dairy Ingredients Industry Revenue (Million) Forecast, by Application 2019 & 2032
- Table 20: Rest of North America North America Dairy Ingredients Industry Volume (K Tons) Forecast, by Application 2019 & 2032
- Table 21: North America Dairy Ingredients Industry Revenue Million Forecast, by Type 2019 & 2032
- Table 22: North America Dairy Ingredients Industry Volume K Tons Forecast, by Type 2019 & 2032
- Table 23: North America Dairy Ingredients Industry Revenue Million Forecast, by Application 2019 & 2032
- Table 24: North America Dairy Ingredients Industry Volume K Tons Forecast, by Application 2019 & 2032
- Table 25: North America Dairy Ingredients Industry Revenue Million Forecast, by Geography 2019 & 2032
- Table 26: North America Dairy Ingredients Industry Volume K Tons Forecast, by Geography 2019 & 2032
- Table 27: North America Dairy Ingredients Industry Revenue Million Forecast, by Country 2019 & 2032
- Table 28: North America Dairy Ingredients Industry Volume K Tons Forecast, by Country 2019 & 2032
- Table 29: North America Dairy Ingredients Industry Revenue Million Forecast, by Type 2019 & 2032
- Table 30: North America Dairy Ingredients Industry Volume K Tons Forecast, by Type 2019 & 2032
- Table 31: North America Dairy Ingredients Industry Revenue Million Forecast, by Application 2019 & 2032
- Table 32: North America Dairy Ingredients Industry Volume K Tons Forecast, by Application 2019 & 2032
- Table 33: North America Dairy Ingredients Industry Revenue Million Forecast, by Geography 2019 & 2032
- Table 34: North America Dairy Ingredients Industry Volume K Tons Forecast, by Geography 2019 & 2032
- Table 35: North America Dairy Ingredients Industry Revenue Million Forecast, by Country 2019 & 2032
- Table 36: North America Dairy Ingredients Industry Volume K Tons Forecast, by Country 2019 & 2032
- Table 37: North America Dairy Ingredients Industry Revenue Million Forecast, by Type 2019 & 2032
- Table 38: North America Dairy Ingredients Industry Volume K Tons Forecast, by Type 2019 & 2032
- Table 39: North America Dairy Ingredients Industry Revenue Million Forecast, by Application 2019 & 2032
- Table 40: North America Dairy Ingredients Industry Volume K Tons Forecast, by Application 2019 & 2032
- Table 41: North America Dairy Ingredients Industry Revenue Million Forecast, by Geography 2019 & 2032
- Table 42: North America Dairy Ingredients Industry Volume K Tons Forecast, by Geography 2019 & 2032
- Table 43: North America Dairy Ingredients Industry Revenue Million Forecast, by Country 2019 & 2032
- Table 44: North America Dairy Ingredients Industry Volume K Tons Forecast, by Country 2019 & 2032
- Table 45: North America Dairy Ingredients Industry Revenue Million Forecast, by Type 2019 & 2032
- Table 46: North America Dairy Ingredients Industry Volume K Tons Forecast, by Type 2019 & 2032
- Table 47: North America Dairy Ingredients Industry Revenue Million Forecast, by Application 2019 & 2032
- Table 48: North America Dairy Ingredients Industry Volume K Tons Forecast, by Application 2019 & 2032
- Table 49: North America Dairy Ingredients Industry Revenue Million Forecast, by Geography 2019 & 2032
- Table 50: North America Dairy Ingredients Industry Volume K Tons Forecast, by Geography 2019 & 2032
- Table 51: North America Dairy Ingredients Industry Revenue Million Forecast, by Country 2019 & 2032
- Table 52: North America Dairy Ingredients Industry Volume K Tons Forecast, by Country 2019 & 2032
Frequently Asked Questions
1. What is the projected Compound Annual Growth Rate (CAGR) of the North America Dairy Ingredients Industry?
The projected CAGR is approximately 4.77%.
2. Which companies are prominent players in the North America Dairy Ingredients Industry?
Key companies in the market include Arla Foods Ingredient Group P/S, Royal Friesland Campina, Kerry Group PLC*List Not Exhaustive, Dairy Farmers of America Inc, Fonterra Co-Operative Group Limited, Groupe Lactalis, Saputo Inc, Kanegrade Ltd, Nestlé S.A., Land O'Lakes, Inc..
3. What are the main segments of the North America Dairy Ingredients Industry?
The market segments include Type, Application, Geography.
4. Can you provide details about the market size?
The market size is estimated to be USD 57300 Million as of 2022.
5. What are some drivers contributing to market growth?
Increasing demand for sports nutritional supplements.
6. What are the notable trends driving market growth?
Whole Milk Powders Drove the Market Sales.
7. Are there any restraints impacting market growth?
Rising demand for plant-based protein.
8. Can you provide examples of recent developments in the market?
Significant developments in the North America dairy ingredients industry include product launches, acquisitions, and partnerships. Examples include the launch of new whey protein concentrates by Arla Foods Ingredient Group P/S, the acquisition of Dairy Farmers of America Inc. by Dean Foods Company, and the partnership between Fonterra Co-Operative Group Limited and DSM to develop novel dairy ingredients.
9. What pricing options are available for accessing the report?
Pricing options include single-user, multi-user, and enterprise licenses priced at USD 4750, USD 5250, and USD 8750 respectively.
10. Is the market size provided in terms of value or volume?
The market size is provided in terms of value, measured in Million and volume, measured in K Tons.
11. Are there any specific market keywords associated with the report?
Yes, the market keyword associated with the report is "North America Dairy Ingredients Industry," which aids in identifying and referencing the specific market segment covered.
12. How do I determine which pricing option suits my needs best?
The pricing options vary based on user requirements and access needs. Individual users may opt for single-user licenses, while businesses requiring broader access may choose multi-user or enterprise licenses for cost-effective access to the report.
13. Are there any additional resources or data provided in the North America Dairy Ingredients Industry report?
While the report offers comprehensive insights, it's advisable to review the specific contents or supplementary materials provided to ascertain if additional resources or data are available.
14. How can I stay updated on further developments or reports in the North America Dairy Ingredients Industry?
To stay informed about further developments, trends, and reports in the North America Dairy Ingredients Industry, consider subscribing to industry newsletters, following relevant companies and organizations, or regularly checking reputable industry news sources and publications.
Methodology
Step 1 - Identification of Relevant Samples Size from Population Database


Step 2 - Approaches for Defining Global Market Size (Value, Volume* & Price*)

Note*: In applicable scenarios
Step 3 - Data Sources
Primary Research
- Web Analytics
- Survey Reports
- Research Institute
- Latest Research Reports
- Opinion Leaders
Secondary Research
- Annual Reports
- White Paper
- Latest Press Release
- Industry Association
- Paid Database
- Investor Presentations

Step 4 - Data Triangulation
Involves using different sources of information in order to increase the validity of a study
These sources are likely to be stakeholders in a program - participants, other researchers, program staff, other community members, and so on.
Then we put all data in single framework & apply various statistical tools to find out the dynamic on the market.
During the analysis stage, feedback from the stakeholder groups would be compared to determine areas of agreement as well as areas of divergence
