

Key Insights
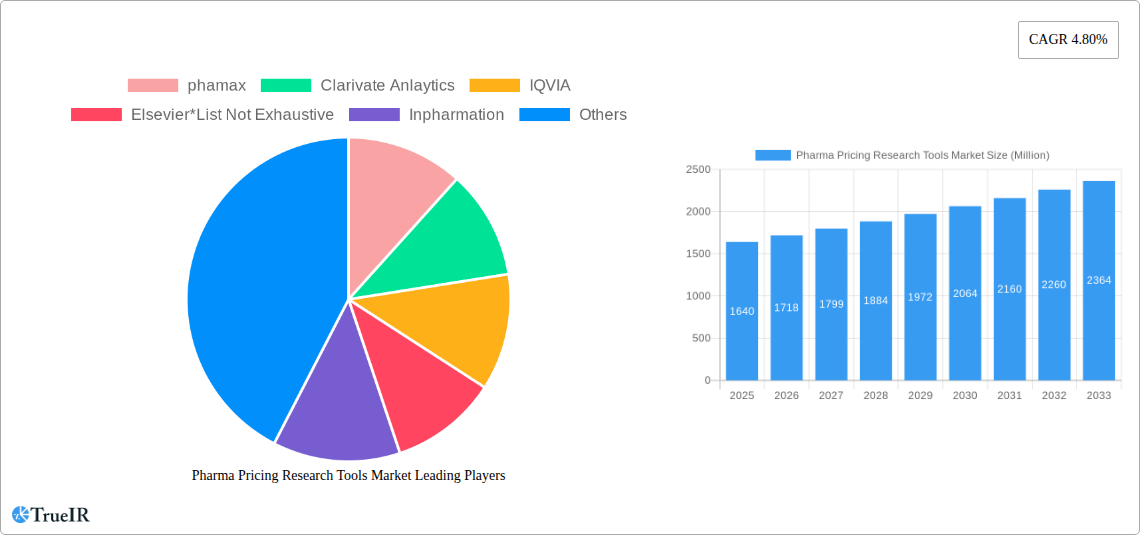
The Pharma Pricing Research Tools market, valued at $1.64 billion in 2025, is projected to experience robust growth, driven by the increasing complexity of pharmaceutical pricing and reimbursement, the need for data-driven decision-making within pharmaceutical companies, and the rising demand for real-world evidence to support pricing strategies. This market is segmented by pricing methodologies (market-based, value-based, and cost-based) and drug types (prescription and over-the-counter). The value-based pricing segment is anticipated to witness significant growth due to the increasing focus on demonstrating the clinical and economic value of pharmaceuticals. Key players like IQVIA, Elsevier, and Clarivate Analytics are leveraging their established data analytics capabilities to offer comprehensive pricing research tools and solutions, fostering market competition and innovation. Geographic expansion, particularly in emerging markets like Asia Pacific, further contributes to market expansion. Regulatory changes impacting drug pricing and reimbursement across different regions necessitate advanced analytics and research tools, further fueling market demand. The competitive landscape is characterized by both established players and emerging niche providers offering specialized solutions catering to specific market needs.
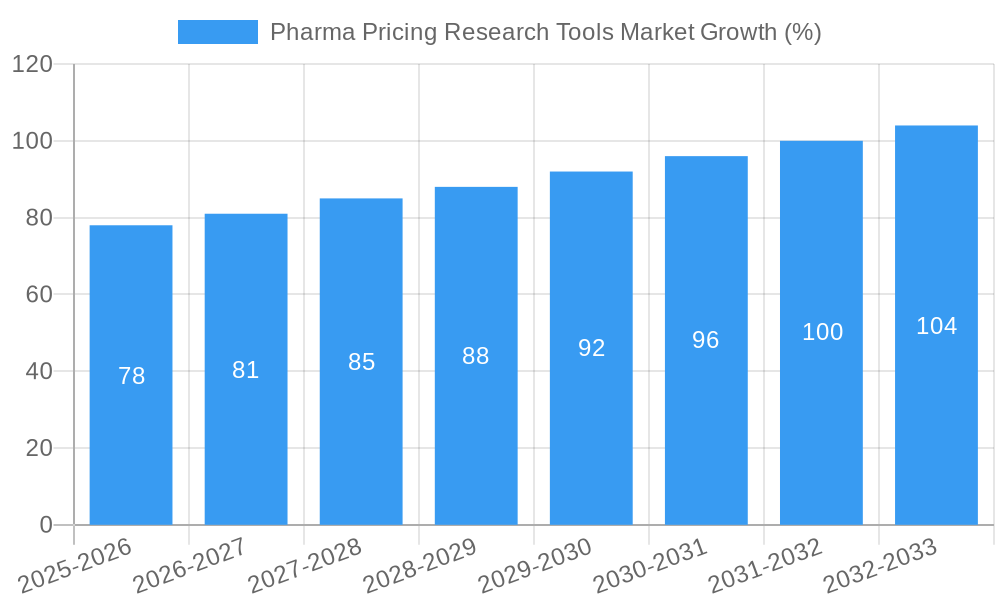
A compound annual growth rate (CAGR) of 4.80% from 2025 to 2033 suggests a steadily expanding market. However, potential restraints include the high cost of advanced analytics solutions, the complexity of integrating diverse data sources, and the need for specialized expertise to effectively utilize these tools. Future growth will depend on the ability of market participants to address these challenges, leverage artificial intelligence and machine learning to enhance analytical capabilities, and adapt to evolving regulatory environments and payer preferences. The market will likely see increasing demand for tools that incorporate real-world data and incorporate advanced modeling techniques for improved pricing and reimbursement strategies. The integration of these tools with existing clinical trial data management systems and other pharmaceutical operations also represents a significant growth opportunity.
Pharma Pricing Research Tools Market: A Comprehensive Analysis (2019-2033)
This dynamic report provides a detailed analysis of the Pharma Pricing Research Tools Market, offering invaluable insights for stakeholders across the pharmaceutical industry. The market is projected to reach xx Million by 2033, exhibiting a robust CAGR of xx% during the forecast period (2025-2033). This in-depth study covers market segmentation, competitive landscape, growth drivers, challenges, and future outlook, leveraging extensive data from the historical period (2019-2024) and the base year (2025).
Pharma Pricing Research Tools Market Market Structure & Competitive Landscape
The Pharma Pricing Research Tools market exhibits a moderately consolidated structure, with several key players commanding significant market share. The Herfindahl-Hirschman Index (HHI) for 2025 is estimated at xx, indicating a moderately competitive landscape. Innovation is a key driver, with companies continuously developing advanced analytics and AI-powered tools to enhance pricing strategies. Regulatory changes, particularly concerning drug pricing policies in various regions, significantly influence market dynamics. Product substitutes, such as traditional pricing models and manual data analysis, still pose a challenge, but their market penetration is gradually declining.
The market is segmented by end-users, including pharmaceutical companies of varying sizes (large multinational corporations to small and medium enterprises), healthcare providers, and government agencies. Mergers and acquisitions (M&A) activity is moderate, with approximately xx M&A deals recorded between 2019 and 2024, primarily focused on expanding technological capabilities and geographical reach. Key players frequently employ strategies like strategic partnerships and collaborations to enhance their market position.
- Market Concentration: HHI of xx in 2025.
- Innovation Drivers: AI-powered analytics, advanced data visualization.
- Regulatory Impacts: Stringent drug pricing regulations in specific regions.
- Product Substitutes: Traditional pricing models, manual analysis.
- End-User Segmentation: Pharmaceutical companies, healthcare providers, government agencies.
- M&A Trends: xx M&A deals between 2019 and 2024, focused on technology and expansion.
Pharma Pricing Research Tools Market Market Trends & Opportunities
The Pharma Pricing Research Tools market is experiencing significant growth, driven by factors such as the increasing adoption of value-based pricing models, the growing complexity of drug pricing regulations, and the expanding use of data analytics in pharmaceutical decision-making. Technological advancements, particularly in artificial intelligence (AI) and machine learning (ML), are transforming pricing strategies. Market penetration of advanced analytics tools is increasing steadily, reaching an estimated xx% in 2025. The market is also witnessing a shift towards cloud-based solutions, offering scalability and cost-effectiveness. Competitive dynamics are characterized by continuous innovation, strategic partnerships, and a focus on providing comprehensive, user-friendly platforms. The CAGR for the market is projected at xx% from 2025 to 2033, indicating substantial growth potential. Consumer preference is shifting towards sophisticated tools capable of handling large datasets and offering actionable insights for optimal pricing strategies.
Dominant Markets & Segments in Pharma Pricing Research Tools Market
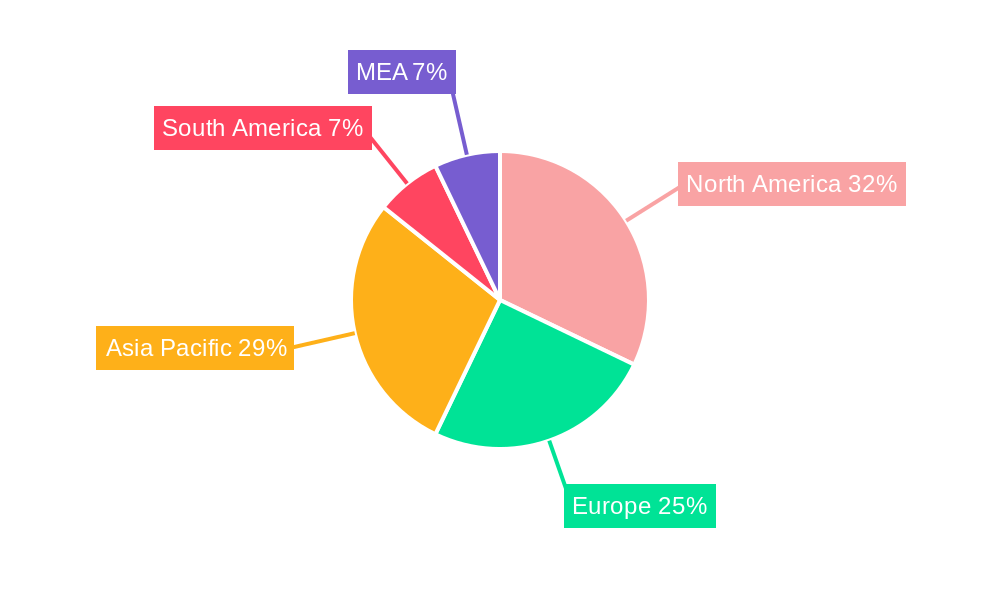
The North American market currently dominates the Pharma Pricing Research Tools market, driven by factors such as robust pharmaceutical R&D spending, well-established healthcare infrastructure, and advanced technological adoption. Within North America, the United States holds the largest market share. In terms of segments, the value-based pricing segment is experiencing significant growth, fueled by increasing governmental emphasis on cost-effectiveness and patient outcomes. The prescription drug application segment is largest in terms of revenue, reflecting the higher complexity and greater data requirements for prescription drug pricing.
- Key Growth Drivers (North America):
- Advanced healthcare infrastructure.
- High pharmaceutical R&D spending.
- Early adoption of advanced technologies.
- Favorable regulatory environment (relative to some other regions).
- Value-Based Pricing Segment Growth Drivers: Government incentives for value-based care, increasing focus on patient outcomes.
- Prescription Drug Application Dominance: Higher complexity and data requirements for pricing.
Pharma Pricing Research Tools Market Product Analysis
The market features a diverse range of products, from basic pricing analytics tools to sophisticated AI-driven platforms. Innovations focus on enhancing data integration capabilities, improving predictive analytics, and incorporating real-world evidence for more accurate pricing decisions. Competitive advantages arise from superior data accuracy, advanced analytical algorithms, intuitive user interfaces, and strong customer support. The market is witnessing a trend towards integrated platforms that combine pricing analytics with other crucial functionalities like contract management and sales forecasting.
Key Drivers, Barriers & Challenges in Pharma Pricing Research Tools Market
Key Drivers: The increasing complexity of drug pricing regulations, growing demand for data-driven decision-making, and advancements in AI and ML are significantly driving market growth. Government initiatives promoting value-based healthcare are also creating new opportunities. The need to optimize pricing strategies in a competitive market fuels adoption.
Key Challenges: Stringent data privacy regulations, the high cost of implementation, and the need for skilled professionals to operate these complex tools represent major challenges. Competition from established players and new entrants can also constrain growth. Supply chain disruptions may impact the availability of specialized software and hardware. The lack of interoperability among different systems poses an integration challenge, limiting seamless data flow and overall effectiveness.
Growth Drivers in the Pharma Pricing Research Tools Market Market
Technological advancements like AI and ML are key drivers, providing enhanced predictive capabilities and optimizing pricing strategies. The increasing focus on value-based care models globally propels demand for these tools. Government regulations and mandates related to drug pricing transparency also fuel market expansion.
Challenges Impacting Pharma Pricing Research Tools Market Growth
Regulatory hurdles, particularly data privacy concerns and compliance requirements, pose a significant challenge. High implementation costs and the need for skilled professionals can limit adoption. Intense competition from established and emerging players may constrain market growth.
Key Players Shaping the Pharma Pricing Research Tools Market Market
- Phamax
- Clarivate Analytics
- IQVIA
- Elsevier
- Inpharmation
- Wolters Kluwer N.V.
- Veeva Systems
- Avalere Health LLC
Significant Pharma Pricing Research Tools Market Industry Milestones
- 2020: Phamax launches AI-powered pricing optimization platform.
- 2021: IQVIA acquires a smaller analytics firm, expanding its data capabilities.
- 2022: New EU regulations on drug pricing data transparency come into effect.
- 2023: Clarivate Analytics releases a new version of its pricing software with enhanced ML capabilities.
- 2024: A major merger occurs among two smaller market players.
Future Outlook for Pharma Pricing Research Tools Market Market
The Pharma Pricing Research Tools market is poised for continued growth, driven by ongoing technological advancements, increasing regulatory pressures, and the evolving healthcare landscape. Strategic partnerships and acquisitions will continue to shape the market, with a focus on integrating data analytics with other crucial aspects of pharmaceutical business operations. The market offers significant potential for companies that can effectively address the challenges of data privacy, complexity, and cost while delivering innovative and user-friendly solutions.
Pharma Pricing Research Tools Market Segmentation
-
1. Application
- 1.1. Prescription Drugs
- 1.2. Over-the-counter Drugs
-
2. Type
- 2.1. Market-Based Pricing
- 2.2. Value-Based Pricing
- 2.3. Cost-based pricing
Pharma Pricing Research Tools Market Segmentation By Geography
-
1. North America
- 1.1. United States
- 1.2. Canada
- 1.3. Mexico
-
2. Europe
- 2.1. Germany
- 2.2. United Kingdom
- 2.3. France
- 2.4. Italy
- 2.5. Spain
- 2.6. Rest of Europe
- 3. Rest of the World
Pharma Pricing Research Tools Market REPORT HIGHLIGHTS
| Aspects | Details |
|---|---|
| Study Period | 2019-2033 |
| Base Year | 2024 |
| Estimated Year | 2025 |
| Forecast Period | 2025-2033 |
| Historical Period | 2019-2024 |
| Growth Rate | CAGR of 4.80% from 2019-2033 |
| Segmentation |
|
Table of Contents
- 1. Introduction
- 1.1. Research Scope
- 1.2. Market Segmentation
- 1.3. Research Methodology
- 1.4. Definitions and Assumptions
- 2. Executive Summary
- 2.1. Introduction
- 3. Market Dynamics
- 3.1. Introduction
- 3.2. Market Drivers
- 3.2.1. Increasing Complexity of Pharmaceutical Pricing; Rising Demand for Pricing Research & Analytics in Healthcare
- 3.3. Market Restrains
- 3.3.1. Lack of Standardization in Underdeveloped Countries
- 3.4. Market Trends
- 3.4.1. The Over-the-Counter Segment is Expected to Show Healthy Growth Over the Forecast Period
- 4. Market Factor Analysis
- 4.1. Porters Five Forces
- 4.2. Supply/Value Chain
- 4.3. PESTEL analysis
- 4.4. Market Entropy
- 4.5. Patent/Trademark Analysis
- 5. Global Pharma Pricing Research Tools Market Analysis, Insights and Forecast, 2019-2031
- 5.1. Market Analysis, Insights and Forecast - by Application
- 5.1.1. Prescription Drugs
- 5.1.2. Over-the-counter Drugs
- 5.2. Market Analysis, Insights and Forecast - by Type
- 5.2.1. Market-Based Pricing
- 5.2.2. Value-Based Pricing
- 5.2.3. Cost-based pricing
- 5.3. Market Analysis, Insights and Forecast - by Region
- 5.3.1. North America
- 5.3.2. Europe
- 5.3.3. Rest of the World
- 5.1. Market Analysis, Insights and Forecast - by Application
- 6. North America Pharma Pricing Research Tools Market Analysis, Insights and Forecast, 2019-2031
- 6.1. Market Analysis, Insights and Forecast - by Application
- 6.1.1. Prescription Drugs
- 6.1.2. Over-the-counter Drugs
- 6.2. Market Analysis, Insights and Forecast - by Type
- 6.2.1. Market-Based Pricing
- 6.2.2. Value-Based Pricing
- 6.2.3. Cost-based pricing
- 6.1. Market Analysis, Insights and Forecast - by Application
- 7. Europe Pharma Pricing Research Tools Market Analysis, Insights and Forecast, 2019-2031
- 7.1. Market Analysis, Insights and Forecast - by Application
- 7.1.1. Prescription Drugs
- 7.1.2. Over-the-counter Drugs
- 7.2. Market Analysis, Insights and Forecast - by Type
- 7.2.1. Market-Based Pricing
- 7.2.2. Value-Based Pricing
- 7.2.3. Cost-based pricing
- 7.1. Market Analysis, Insights and Forecast - by Application
- 8. Rest of the World Pharma Pricing Research Tools Market Analysis, Insights and Forecast, 2019-2031
- 8.1. Market Analysis, Insights and Forecast - by Application
- 8.1.1. Prescription Drugs
- 8.1.2. Over-the-counter Drugs
- 8.2. Market Analysis, Insights and Forecast - by Type
- 8.2.1. Market-Based Pricing
- 8.2.2. Value-Based Pricing
- 8.2.3. Cost-based pricing
- 8.1. Market Analysis, Insights and Forecast - by Application
- 9. North America Pharma Pricing Research Tools Market Analysis, Insights and Forecast, 2019-2031
- 9.1. Market Analysis, Insights and Forecast - By Country/Sub-region
- 9.1.1 United States
- 9.1.2 Canada
- 9.1.3 Mexico
- 10. Europe Pharma Pricing Research Tools Market Analysis, Insights and Forecast, 2019-2031
- 10.1. Market Analysis, Insights and Forecast - By Country/Sub-region
- 10.1.1 Germany
- 10.1.2 United Kingdom
- 10.1.3 France
- 10.1.4 Spain
- 10.1.5 Italy
- 10.1.6 Spain
- 10.1.7 Belgium
- 10.1.8 Netherland
- 10.1.9 Nordics
- 10.1.10 Rest of Europe
- 11. Asia Pacific Pharma Pricing Research Tools Market Analysis, Insights and Forecast, 2019-2031
- 11.1. Market Analysis, Insights and Forecast - By Country/Sub-region
- 11.1.1 China
- 11.1.2 Japan
- 11.1.3 India
- 11.1.4 South Korea
- 11.1.5 Southeast Asia
- 11.1.6 Australia
- 11.1.7 Indonesia
- 11.1.8 Phillipes
- 11.1.9 Singapore
- 11.1.10 Thailandc
- 11.1.11 Rest of Asia Pacific
- 12. South America Pharma Pricing Research Tools Market Analysis, Insights and Forecast, 2019-2031
- 12.1. Market Analysis, Insights and Forecast - By Country/Sub-region
- 12.1.1 Brazil
- 12.1.2 Argentina
- 12.1.3 Peru
- 12.1.4 Chile
- 12.1.5 Colombia
- 12.1.6 Ecuador
- 12.1.7 Venezuela
- 12.1.8 Rest of South America
- 13. North America Pharma Pricing Research Tools Market Analysis, Insights and Forecast, 2019-2031
- 13.1. Market Analysis, Insights and Forecast - By Country/Sub-region
- 13.1.1 United States
- 13.1.2 Canada
- 13.1.3 Mexico
- 14. MEA Pharma Pricing Research Tools Market Analysis, Insights and Forecast, 2019-2031
- 14.1. Market Analysis, Insights and Forecast - By Country/Sub-region
- 14.1.1 United Arab Emirates
- 14.1.2 Saudi Arabia
- 14.1.3 South Africa
- 14.1.4 Rest of Middle East and Africa
- 15. Competitive Analysis
- 15.1. Global Market Share Analysis 2024
- 15.2. Company Profiles
- 15.2.1 phamax
- 15.2.1.1. Overview
- 15.2.1.2. Products
- 15.2.1.3. SWOT Analysis
- 15.2.1.4. Recent Developments
- 15.2.1.5. Financials (Based on Availability)
- 15.2.2 Clarivate Anlaytics
- 15.2.2.1. Overview
- 15.2.2.2. Products
- 15.2.2.3. SWOT Analysis
- 15.2.2.4. Recent Developments
- 15.2.2.5. Financials (Based on Availability)
- 15.2.3 IQVIA
- 15.2.3.1. Overview
- 15.2.3.2. Products
- 15.2.3.3. SWOT Analysis
- 15.2.3.4. Recent Developments
- 15.2.3.5. Financials (Based on Availability)
- 15.2.4 Elsevier*List Not Exhaustive
- 15.2.4.1. Overview
- 15.2.4.2. Products
- 15.2.4.3. SWOT Analysis
- 15.2.4.4. Recent Developments
- 15.2.4.5. Financials (Based on Availability)
- 15.2.5 Inpharmation
- 15.2.5.1. Overview
- 15.2.5.2. Products
- 15.2.5.3. SWOT Analysis
- 15.2.5.4. Recent Developments
- 15.2.5.5. Financials (Based on Availability)
- 15.2.6 Wolters Kluwer N V
- 15.2.6.1. Overview
- 15.2.6.2. Products
- 15.2.6.3. SWOT Analysis
- 15.2.6.4. Recent Developments
- 15.2.6.5. Financials (Based on Availability)
- 15.2.7 Veeva Systems
- 15.2.7.1. Overview
- 15.2.7.2. Products
- 15.2.7.3. SWOT Analysis
- 15.2.7.4. Recent Developments
- 15.2.7.5. Financials (Based on Availability)
- 15.2.8 Avalere Health LLC
- 15.2.8.1. Overview
- 15.2.8.2. Products
- 15.2.8.3. SWOT Analysis
- 15.2.8.4. Recent Developments
- 15.2.8.5. Financials (Based on Availability)
- 15.2.1 phamax
List of Figures
- Figure 1: Global Pharma Pricing Research Tools Market Revenue Breakdown (Million, %) by Region 2024 & 2032
- Figure 2: North America Pharma Pricing Research Tools Market Revenue (Million), by Country 2024 & 2032
- Figure 3: North America Pharma Pricing Research Tools Market Revenue Share (%), by Country 2024 & 2032
- Figure 4: Europe Pharma Pricing Research Tools Market Revenue (Million), by Country 2024 & 2032
- Figure 5: Europe Pharma Pricing Research Tools Market Revenue Share (%), by Country 2024 & 2032
- Figure 6: Asia Pacific Pharma Pricing Research Tools Market Revenue (Million), by Country 2024 & 2032
- Figure 7: Asia Pacific Pharma Pricing Research Tools Market Revenue Share (%), by Country 2024 & 2032
- Figure 8: South America Pharma Pricing Research Tools Market Revenue (Million), by Country 2024 & 2032
- Figure 9: South America Pharma Pricing Research Tools Market Revenue Share (%), by Country 2024 & 2032
- Figure 10: North America Pharma Pricing Research Tools Market Revenue (Million), by Country 2024 & 2032
- Figure 11: North America Pharma Pricing Research Tools Market Revenue Share (%), by Country 2024 & 2032
- Figure 12: MEA Pharma Pricing Research Tools Market Revenue (Million), by Country 2024 & 2032
- Figure 13: MEA Pharma Pricing Research Tools Market Revenue Share (%), by Country 2024 & 2032
- Figure 14: North America Pharma Pricing Research Tools Market Revenue (Million), by Application 2024 & 2032
- Figure 15: North America Pharma Pricing Research Tools Market Revenue Share (%), by Application 2024 & 2032
- Figure 16: North America Pharma Pricing Research Tools Market Revenue (Million), by Type 2024 & 2032
- Figure 17: North America Pharma Pricing Research Tools Market Revenue Share (%), by Type 2024 & 2032
- Figure 18: North America Pharma Pricing Research Tools Market Revenue (Million), by Country 2024 & 2032
- Figure 19: North America Pharma Pricing Research Tools Market Revenue Share (%), by Country 2024 & 2032
- Figure 20: Europe Pharma Pricing Research Tools Market Revenue (Million), by Application 2024 & 2032
- Figure 21: Europe Pharma Pricing Research Tools Market Revenue Share (%), by Application 2024 & 2032
- Figure 22: Europe Pharma Pricing Research Tools Market Revenue (Million), by Type 2024 & 2032
- Figure 23: Europe Pharma Pricing Research Tools Market Revenue Share (%), by Type 2024 & 2032
- Figure 24: Europe Pharma Pricing Research Tools Market Revenue (Million), by Country 2024 & 2032
- Figure 25: Europe Pharma Pricing Research Tools Market Revenue Share (%), by Country 2024 & 2032
- Figure 26: Rest of the World Pharma Pricing Research Tools Market Revenue (Million), by Application 2024 & 2032
- Figure 27: Rest of the World Pharma Pricing Research Tools Market Revenue Share (%), by Application 2024 & 2032
- Figure 28: Rest of the World Pharma Pricing Research Tools Market Revenue (Million), by Type 2024 & 2032
- Figure 29: Rest of the World Pharma Pricing Research Tools Market Revenue Share (%), by Type 2024 & 2032
- Figure 30: Rest of the World Pharma Pricing Research Tools Market Revenue (Million), by Country 2024 & 2032
- Figure 31: Rest of the World Pharma Pricing Research Tools Market Revenue Share (%), by Country 2024 & 2032
List of Tables
- Table 1: Global Pharma Pricing Research Tools Market Revenue Million Forecast, by Region 2019 & 2032
- Table 2: Global Pharma Pricing Research Tools Market Revenue Million Forecast, by Application 2019 & 2032
- Table 3: Global Pharma Pricing Research Tools Market Revenue Million Forecast, by Type 2019 & 2032
- Table 4: Global Pharma Pricing Research Tools Market Revenue Million Forecast, by Region 2019 & 2032
- Table 5: Global Pharma Pricing Research Tools Market Revenue Million Forecast, by Country 2019 & 2032
- Table 6: United States Pharma Pricing Research Tools Market Revenue (Million) Forecast, by Application 2019 & 2032
- Table 7: Canada Pharma Pricing Research Tools Market Revenue (Million) Forecast, by Application 2019 & 2032
- Table 8: Mexico Pharma Pricing Research Tools Market Revenue (Million) Forecast, by Application 2019 & 2032
- Table 9: Global Pharma Pricing Research Tools Market Revenue Million Forecast, by Country 2019 & 2032
- Table 10: Germany Pharma Pricing Research Tools Market Revenue (Million) Forecast, by Application 2019 & 2032
- Table 11: United Kingdom Pharma Pricing Research Tools Market Revenue (Million) Forecast, by Application 2019 & 2032
- Table 12: France Pharma Pricing Research Tools Market Revenue (Million) Forecast, by Application 2019 & 2032
- Table 13: Spain Pharma Pricing Research Tools Market Revenue (Million) Forecast, by Application 2019 & 2032
- Table 14: Italy Pharma Pricing Research Tools Market Revenue (Million) Forecast, by Application 2019 & 2032
- Table 15: Spain Pharma Pricing Research Tools Market Revenue (Million) Forecast, by Application 2019 & 2032
- Table 16: Belgium Pharma Pricing Research Tools Market Revenue (Million) Forecast, by Application 2019 & 2032
- Table 17: Netherland Pharma Pricing Research Tools Market Revenue (Million) Forecast, by Application 2019 & 2032
- Table 18: Nordics Pharma Pricing Research Tools Market Revenue (Million) Forecast, by Application 2019 & 2032
- Table 19: Rest of Europe Pharma Pricing Research Tools Market Revenue (Million) Forecast, by Application 2019 & 2032
- Table 20: Global Pharma Pricing Research Tools Market Revenue Million Forecast, by Country 2019 & 2032
- Table 21: China Pharma Pricing Research Tools Market Revenue (Million) Forecast, by Application 2019 & 2032
- Table 22: Japan Pharma Pricing Research Tools Market Revenue (Million) Forecast, by Application 2019 & 2032
- Table 23: India Pharma Pricing Research Tools Market Revenue (Million) Forecast, by Application 2019 & 2032
- Table 24: South Korea Pharma Pricing Research Tools Market Revenue (Million) Forecast, by Application 2019 & 2032
- Table 25: Southeast Asia Pharma Pricing Research Tools Market Revenue (Million) Forecast, by Application 2019 & 2032
- Table 26: Australia Pharma Pricing Research Tools Market Revenue (Million) Forecast, by Application 2019 & 2032
- Table 27: Indonesia Pharma Pricing Research Tools Market Revenue (Million) Forecast, by Application 2019 & 2032
- Table 28: Phillipes Pharma Pricing Research Tools Market Revenue (Million) Forecast, by Application 2019 & 2032
- Table 29: Singapore Pharma Pricing Research Tools Market Revenue (Million) Forecast, by Application 2019 & 2032
- Table 30: Thailandc Pharma Pricing Research Tools Market Revenue (Million) Forecast, by Application 2019 & 2032
- Table 31: Rest of Asia Pacific Pharma Pricing Research Tools Market Revenue (Million) Forecast, by Application 2019 & 2032
- Table 32: Global Pharma Pricing Research Tools Market Revenue Million Forecast, by Country 2019 & 2032
- Table 33: Brazil Pharma Pricing Research Tools Market Revenue (Million) Forecast, by Application 2019 & 2032
- Table 34: Argentina Pharma Pricing Research Tools Market Revenue (Million) Forecast, by Application 2019 & 2032
- Table 35: Peru Pharma Pricing Research Tools Market Revenue (Million) Forecast, by Application 2019 & 2032
- Table 36: Chile Pharma Pricing Research Tools Market Revenue (Million) Forecast, by Application 2019 & 2032
- Table 37: Colombia Pharma Pricing Research Tools Market Revenue (Million) Forecast, by Application 2019 & 2032
- Table 38: Ecuador Pharma Pricing Research Tools Market Revenue (Million) Forecast, by Application 2019 & 2032
- Table 39: Venezuela Pharma Pricing Research Tools Market Revenue (Million) Forecast, by Application 2019 & 2032
- Table 40: Rest of South America Pharma Pricing Research Tools Market Revenue (Million) Forecast, by Application 2019 & 2032
- Table 41: Global Pharma Pricing Research Tools Market Revenue Million Forecast, by Country 2019 & 2032
- Table 42: United States Pharma Pricing Research Tools Market Revenue (Million) Forecast, by Application 2019 & 2032
- Table 43: Canada Pharma Pricing Research Tools Market Revenue (Million) Forecast, by Application 2019 & 2032
- Table 44: Mexico Pharma Pricing Research Tools Market Revenue (Million) Forecast, by Application 2019 & 2032
- Table 45: Global Pharma Pricing Research Tools Market Revenue Million Forecast, by Country 2019 & 2032
- Table 46: United Arab Emirates Pharma Pricing Research Tools Market Revenue (Million) Forecast, by Application 2019 & 2032
- Table 47: Saudi Arabia Pharma Pricing Research Tools Market Revenue (Million) Forecast, by Application 2019 & 2032
- Table 48: South Africa Pharma Pricing Research Tools Market Revenue (Million) Forecast, by Application 2019 & 2032
- Table 49: Rest of Middle East and Africa Pharma Pricing Research Tools Market Revenue (Million) Forecast, by Application 2019 & 2032
- Table 50: Global Pharma Pricing Research Tools Market Revenue Million Forecast, by Application 2019 & 2032
- Table 51: Global Pharma Pricing Research Tools Market Revenue Million Forecast, by Type 2019 & 2032
- Table 52: Global Pharma Pricing Research Tools Market Revenue Million Forecast, by Country 2019 & 2032
- Table 53: United States Pharma Pricing Research Tools Market Revenue (Million) Forecast, by Application 2019 & 2032
- Table 54: Canada Pharma Pricing Research Tools Market Revenue (Million) Forecast, by Application 2019 & 2032
- Table 55: Mexico Pharma Pricing Research Tools Market Revenue (Million) Forecast, by Application 2019 & 2032
- Table 56: Global Pharma Pricing Research Tools Market Revenue Million Forecast, by Application 2019 & 2032
- Table 57: Global Pharma Pricing Research Tools Market Revenue Million Forecast, by Type 2019 & 2032
- Table 58: Global Pharma Pricing Research Tools Market Revenue Million Forecast, by Country 2019 & 2032
- Table 59: Germany Pharma Pricing Research Tools Market Revenue (Million) Forecast, by Application 2019 & 2032
- Table 60: United Kingdom Pharma Pricing Research Tools Market Revenue (Million) Forecast, by Application 2019 & 2032
- Table 61: France Pharma Pricing Research Tools Market Revenue (Million) Forecast, by Application 2019 & 2032
- Table 62: Italy Pharma Pricing Research Tools Market Revenue (Million) Forecast, by Application 2019 & 2032
- Table 63: Spain Pharma Pricing Research Tools Market Revenue (Million) Forecast, by Application 2019 & 2032
- Table 64: Rest of Europe Pharma Pricing Research Tools Market Revenue (Million) Forecast, by Application 2019 & 2032
- Table 65: Global Pharma Pricing Research Tools Market Revenue Million Forecast, by Application 2019 & 2032
- Table 66: Global Pharma Pricing Research Tools Market Revenue Million Forecast, by Type 2019 & 2032
- Table 67: Global Pharma Pricing Research Tools Market Revenue Million Forecast, by Country 2019 & 2032
Frequently Asked Questions
1. What is the projected Compound Annual Growth Rate (CAGR) of the Pharma Pricing Research Tools Market?
The projected CAGR is approximately 4.80%.
2. Which companies are prominent players in the Pharma Pricing Research Tools Market?
Key companies in the market include phamax, Clarivate Anlaytics, IQVIA, Elsevier*List Not Exhaustive, Inpharmation, Wolters Kluwer N V, Veeva Systems, Avalere Health LLC.
3. What are the main segments of the Pharma Pricing Research Tools Market?
The market segments include Application, Type.
4. Can you provide details about the market size?
The market size is estimated to be USD 1.64 Million as of 2022.
5. What are some drivers contributing to market growth?
Increasing Complexity of Pharmaceutical Pricing; Rising Demand for Pricing Research & Analytics in Healthcare.
6. What are the notable trends driving market growth?
The Over-the-Counter Segment is Expected to Show Healthy Growth Over the Forecast Period.
7. Are there any restraints impacting market growth?
Lack of Standardization in Underdeveloped Countries.
8. Can you provide examples of recent developments in the market?
N/A
9. What pricing options are available for accessing the report?
Pricing options include single-user, multi-user, and enterprise licenses priced at USD 4750, USD 5250, and USD 8750 respectively.
10. Is the market size provided in terms of value or volume?
The market size is provided in terms of value, measured in Million.
11. Are there any specific market keywords associated with the report?
Yes, the market keyword associated with the report is "Pharma Pricing Research Tools Market," which aids in identifying and referencing the specific market segment covered.
12. How do I determine which pricing option suits my needs best?
The pricing options vary based on user requirements and access needs. Individual users may opt for single-user licenses, while businesses requiring broader access may choose multi-user or enterprise licenses for cost-effective access to the report.
13. Are there any additional resources or data provided in the Pharma Pricing Research Tools Market report?
While the report offers comprehensive insights, it's advisable to review the specific contents or supplementary materials provided to ascertain if additional resources or data are available.
14. How can I stay updated on further developments or reports in the Pharma Pricing Research Tools Market?
To stay informed about further developments, trends, and reports in the Pharma Pricing Research Tools Market, consider subscribing to industry newsletters, following relevant companies and organizations, or regularly checking reputable industry news sources and publications.
Methodology
Step 1 - Identification of Relevant Samples Size from Population Database


Step 2 - Approaches for Defining Global Market Size (Value, Volume* & Price*)

Note*: In applicable scenarios
Step 3 - Data Sources
Primary Research
- Web Analytics
- Survey Reports
- Research Institute
- Latest Research Reports
- Opinion Leaders
Secondary Research
- Annual Reports
- White Paper
- Latest Press Release
- Industry Association
- Paid Database
- Investor Presentations

Step 4 - Data Triangulation
Involves using different sources of information in order to increase the validity of a study
These sources are likely to be stakeholders in a program - participants, other researchers, program staff, other community members, and so on.
Then we put all data in single framework & apply various statistical tools to find out the dynamic on the market.
During the analysis stage, feedback from the stakeholder groups would be compared to determine areas of agreement as well as areas of divergence
