

Key Insights
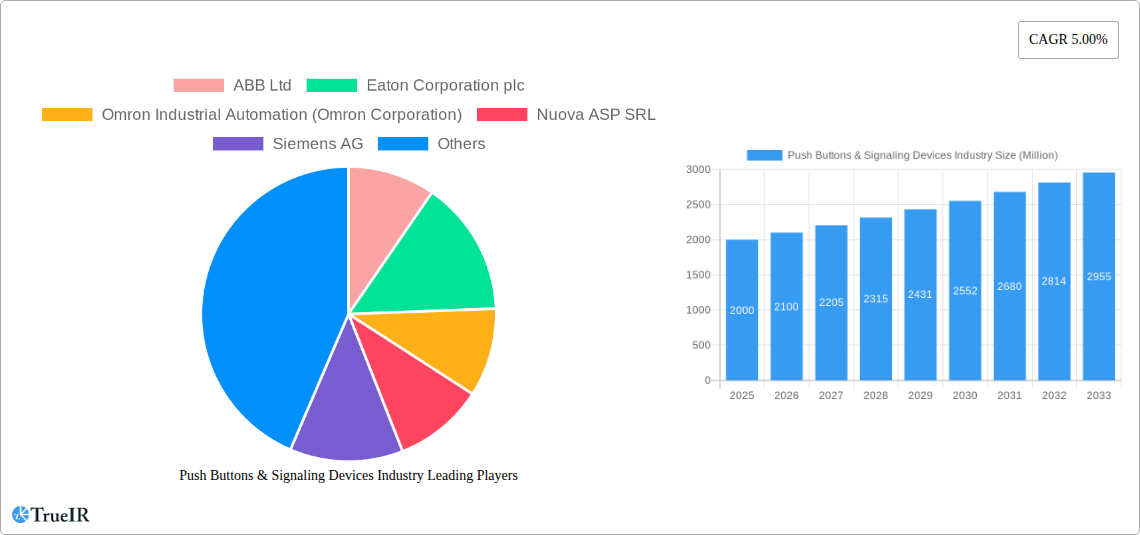
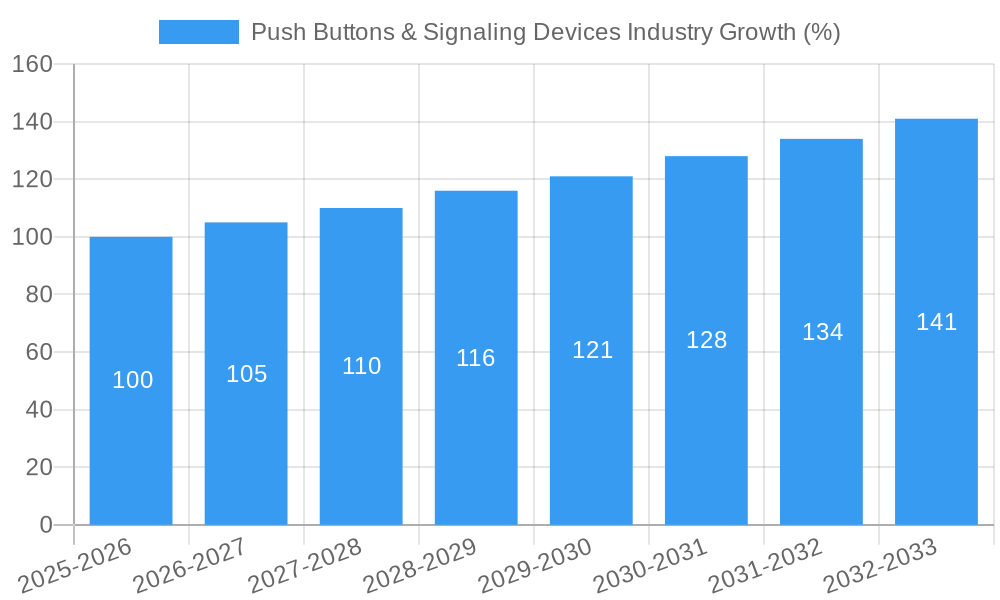
The global Push Buttons & Signaling Devices market is experiencing steady growth, projected to maintain a Compound Annual Growth Rate (CAGR) of 5.00% from 2025 to 2033. This expansion is driven by increasing automation across various industries, particularly automotive, energy & power, and manufacturing. The rising demand for enhanced safety features and improved human-machine interfaces (HMI) in industrial settings fuels the adoption of advanced push buttons and signaling devices. Technological advancements, such as the integration of smart sensors and digital communication protocols, are further contributing to market growth. The market is segmented by end-user industry, product type (round/square, lighted/non-lighted), and functionality (audible, visible). While the automotive sector currently holds a significant share, the energy and power sector is expected to witness considerable growth due to increasing infrastructure development and smart grid initiatives. The adoption of innovative materials and designs focusing on durability and reliability is a key trend, alongside the integration of these devices into larger industrial automation systems. However, factors like the high initial investment costs associated with advanced systems and the potential for obsolescence due to rapid technological changes might act as restraints. Key players such as ABB, Eaton, Omron, and Siemens are actively involved in developing innovative products and expanding their market presence through strategic partnerships and acquisitions.
The market's growth trajectory is anticipated to be influenced by several factors. The increasing adoption of Industry 4.0 principles, requiring robust and reliable HMI solutions, will positively impact the market. Furthermore, the burgeoning demand for sophisticated safety systems in hazardous environments will fuel the demand for specialized push buttons and signaling devices. Competition within the market remains strong, with established players constantly vying for market share through product innovation and strategic partnerships. Future growth is expected to be further driven by technological advancements such as the integration of wireless communication capabilities and the use of more environmentally friendly materials. While challenges like economic fluctuations and supply chain disruptions remain, the overall outlook for the push buttons and signaling devices market is positive, with continuous growth anticipated throughout the forecast period. We estimate the 2025 market size to be approximately $2 billion (a reasonable estimate given the 5% CAGR and common market sizes for related industrial automation segments) with a steady increase annually reflecting the projected growth.
This comprehensive report provides an in-depth analysis of the global Push Buttons & Signaling Devices industry, offering valuable insights into market trends, competitive dynamics, and future growth prospects. With a study period spanning 2019-2033, a base year of 2025, and a forecast period of 2025-2033, this report is an essential resource for industry stakeholders, investors, and strategic decision-makers. The market value is projected to reach xx Million by 2033.
Push Buttons & Signaling Devices Industry Market Structure & Competitive Landscape
The Push Buttons & Signaling Devices market is characterized by a moderately concentrated landscape, with key players such as ABB Ltd, Eaton Corporation plc, Omron Industrial Automation (Omron Corporation), Nuova ASP SRL, Siemens AG, Oslo Switch Inc, Schneider Electric, Switronic Industrial Corp, Rockwell Automation Inc, and BACO Controls Inc holding significant market share. However, the presence of numerous smaller players and regional manufacturers contributes to a competitive dynamic. The market's concentration ratio (CR4) is estimated at xx% in 2025, indicating a moderately consolidated structure.
Innovation plays a crucial role, driving the development of advanced features like enhanced durability, improved safety mechanisms, and smart connectivity. Regulatory compliance, particularly concerning safety standards and industrial automation regulations, significantly influences product design and market access. Product substitutes, such as touchscreens and alternative control systems, pose a moderate threat, particularly in specific niche applications.
The industry is witnessing considerable M&A activity, with a total of xx deals valued at xx Million recorded during the historical period (2019-2024). This consolidation trend is expected to continue, driven by the need to expand product portfolios, access new technologies, and gain market share. End-user segmentation is a key characteristic, with significant variations in demand across industries like automotive, energy and power, manufacturing, and food and beverage.
- Market Concentration: CR4 estimated at xx% in 2025.
- M&A Activity: xx deals valued at xx Million (2019-2024).
- Key Innovation Drivers: Enhanced durability, safety features, smart connectivity.
- Regulatory Impacts: Stringent safety and automation standards.
- Product Substitutes: Touchscreens, alternative control systems.
Push Buttons & Signaling Devices Industry Market Trends & Opportunities
The global Push Buttons & Signaling Devices market is experiencing robust growth, driven by increasing automation across various industries, rising demand for improved safety features, and technological advancements enabling seamless integration with industrial automation systems. The market size is estimated at xx Million in 2025 and is projected to witness a Compound Annual Growth Rate (CAGR) of xx% during the forecast period (2025-2033), reaching xx Million by 2033. This growth is fueled by several factors:
The increasing adoption of Industry 4.0 technologies is significantly driving the demand for smart and connected push buttons and signaling devices. Consumer preferences are shifting towards user-friendly, customizable, and reliable products. Competitive dynamics are characterized by ongoing innovation, strategic partnerships, and a focus on expanding into new geographical markets. Market penetration rates vary widely across different end-user industries, with the manufacturing sector exhibiting the highest adoption rate.
The growing emphasis on worker safety and improved process efficiency in industrial settings is further boosting the demand for advanced push buttons and signaling devices. Emerging economies, particularly in Asia-Pacific, are demonstrating significant growth potential, due to expanding industrial sectors and investments in infrastructure development.
Dominant Markets & Segments in Push Buttons & Signaling Devices Industry
The manufacturing sector represents the largest end-user segment, accounting for xx% of the total market value in 2025. This dominance is primarily attributed to the high level of automation employed in manufacturing processes. The automotive industry is another significant segment, driven by the increasing adoption of advanced driver-assistance systems (ADAS) and connected car technologies.
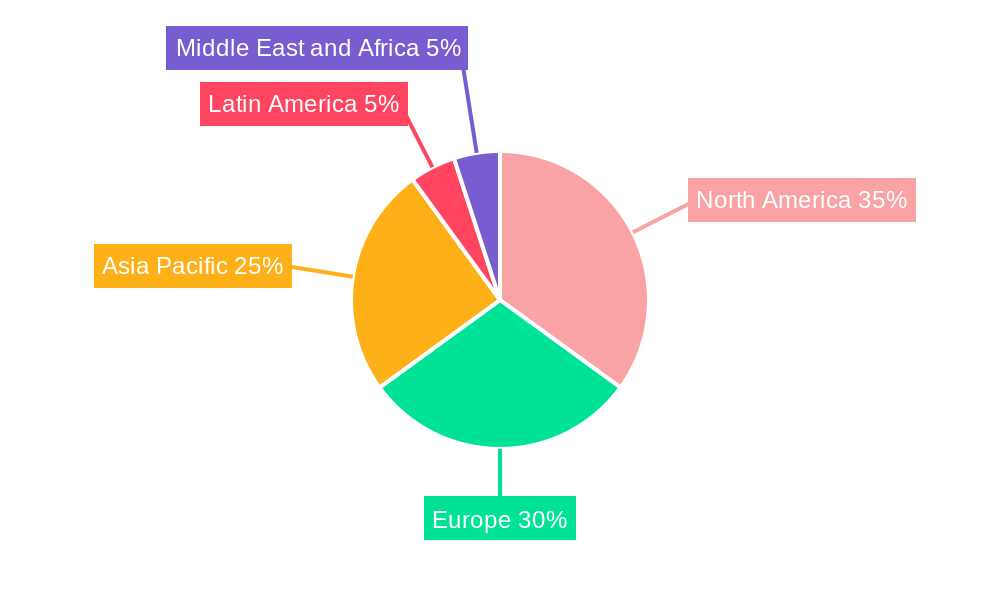
By product type, round or square body type push buttons hold the largest market share, due to their widespread application in various industrial settings. Geographically, North America and Europe currently dominate the market. However, Asia-Pacific is expected to witness the fastest growth rate during the forecast period.
- Leading End-User Industry: Manufacturing (xx% market share in 2025).
- Leading Product Type: Round or Square Body Type.
- Fastest-Growing Region: Asia-Pacific.
Key Growth Drivers:
- Increased Automation in Manufacturing: Demand for robust and reliable control devices.
- Rising Safety Concerns: Enhanced safety features in industrial settings.
- Technological Advancements: Integration with smart industrial systems.
- Infrastructure Development: Investment in manufacturing and automation projects.
Push Buttons & Signaling Devices Industry Product Analysis
The industry is witnessing significant product innovations, focusing on improved ergonomics, enhanced durability, and smart connectivity features. New products incorporate advanced materials, better sealing mechanisms, and customizable functionalities. These innovations aim to meet the evolving needs of different end-user industries, improving operational efficiency and worker safety. The competitive advantage lies in offering products with superior reliability, advanced functionalities, and seamless integration with existing industrial automation systems.
Key Drivers, Barriers & Challenges in Push Buttons & Signaling Devices Industry
Key Drivers:
- Automation in various industries: The increasing demand for automated processes across sectors is a major driver.
- Rising safety standards: Stringent regulations and increasing awareness of workplace safety are boosting demand.
- Technological advancements: Development of smart, connected, and more efficient devices.
Key Challenges:
- Supply chain disruptions: Fluctuations in raw material prices and logistical challenges impact production and cost.
- Intense competition: A large number of players competing on price and features creates a challenging environment.
- Regulatory compliance: Meeting various safety standards adds complexity to production and increases costs.
Growth Drivers in the Push Buttons & Signaling Devices Industry Market
Growth in the Push Buttons & Signaling Devices market is fueled by the rising adoption of automation across various industries like manufacturing, automotive, and energy. This increase in demand coupled with technological advancements leading to smarter, more efficient, and safer devices are key growth drivers. Government regulations focused on enhanced workplace safety are also playing a crucial role.
Challenges Impacting Push Buttons & Signaling Devices Industry Growth
Major challenges include intense competition from various manufacturers resulting in price pressures. Supply chain disruptions and the increasing complexity of meeting various international safety regulations create further hurdles. Economic downturns can negatively impact capital expenditures on automation, thereby impacting demand.
Key Players Shaping the Push Buttons & Signaling Devices Industry Market
- ABB Ltd
- Eaton Corporation plc
- Omron Industrial Automation (Omron Corporation)
- Nuova ASP SRL
- Siemens AG
- Oslo Switch Inc
- Schneider Electric
- Switronic Industrial Corp
- Rockwell Automation Inc
- BACO Controls Inc
Significant Push Buttons & Signaling Devices Industry Industry Milestones
- September 2022: The Blue Valley School District announced a new crisis alert system using specialized push buttons for emergency calls. This system's implementation signifies the industry's contribution to enhanced safety measures in educational institutions.
Future Outlook for Push Buttons & Signaling Devices Industry Market
The Push Buttons & Signaling Devices market is poised for continued growth, driven by ongoing technological advancements, increasing automation adoption across various sectors, and a rising focus on workplace safety. Strategic investments in research and development, coupled with strategic partnerships, will be crucial for companies seeking to capitalize on emerging opportunities. The market's expansion into emerging economies and the development of more sophisticated, integrated solutions present significant potential for growth.
Push Buttons & Signaling Devices Industry Segmentation
-
1. Product
- 1.1. Round or Square Body Type
- 1.2. Non-lighted Push Button
- 1.3. Other Products
-
2. Types
- 2.1. Audible
- 2.2. Visible
- 2.3. Other Types
-
3. End-user Industry
- 3.1. Automotive
- 3.2. Energy and Power
- 3.3. Manufacturing
- 3.4. Food and Beverage
- 3.5. Other End-user Industries
Push Buttons & Signaling Devices Industry Segmentation By Geography
- 1. North America
- 2. Europe
- 3. Asia Pacific
- 4. Latin America
- 5. Middle East and Africa
Push Buttons & Signaling Devices Industry REPORT HIGHLIGHTS
| Aspects | Details |
|---|---|
| Study Period | 2019-2033 |
| Base Year | 2024 |
| Estimated Year | 2025 |
| Forecast Period | 2025-2033 |
| Historical Period | 2019-2024 |
| Growth Rate | CAGR of 5.00% from 2019-2033 |
| Segmentation |
|
Table of Contents
- 1. Introduction
- 1.1. Research Scope
- 1.2. Market Segmentation
- 1.3. Research Methodology
- 1.4. Definitions and Assumptions
- 2. Executive Summary
- 2.1. Introduction
- 3. Market Dynamics
- 3.1. Introduction
- 3.2. Market Drivers
- 3.2.1. Creating Safe Working Environment For The Industrial Workers; Favorable Government Regulations For Industrial Safety
- 3.3. Market Restrains
- 3.3.1. High Initial Investment in Creating Supporting Infrastructure and Automation
- 3.4. Market Trends
- 3.4.1. Automotive Industry to Drive the Market Growth
- 4. Market Factor Analysis
- 4.1. Porters Five Forces
- 4.2. Supply/Value Chain
- 4.3. PESTEL analysis
- 4.4. Market Entropy
- 4.5. Patent/Trademark Analysis
- 5. Global Push Buttons & Signaling Devices Industry Analysis, Insights and Forecast, 2019-2031
- 5.1. Market Analysis, Insights and Forecast - by Product
- 5.1.1. Round or Square Body Type
- 5.1.2. Non-lighted Push Button
- 5.1.3. Other Products
- 5.2. Market Analysis, Insights and Forecast - by Types
- 5.2.1. Audible
- 5.2.2. Visible
- 5.2.3. Other Types
- 5.3. Market Analysis, Insights and Forecast - by End-user Industry
- 5.3.1. Automotive
- 5.3.2. Energy and Power
- 5.3.3. Manufacturing
- 5.3.4. Food and Beverage
- 5.3.5. Other End-user Industries
- 5.4. Market Analysis, Insights and Forecast - by Region
- 5.4.1. North America
- 5.4.2. Europe
- 5.4.3. Asia Pacific
- 5.4.4. Latin America
- 5.4.5. Middle East and Africa
- 5.1. Market Analysis, Insights and Forecast - by Product
- 6. North America Push Buttons & Signaling Devices Industry Analysis, Insights and Forecast, 2019-2031
- 6.1. Market Analysis, Insights and Forecast - by Product
- 6.1.1. Round or Square Body Type
- 6.1.2. Non-lighted Push Button
- 6.1.3. Other Products
- 6.2. Market Analysis, Insights and Forecast - by Types
- 6.2.1. Audible
- 6.2.2. Visible
- 6.2.3. Other Types
- 6.3. Market Analysis, Insights and Forecast - by End-user Industry
- 6.3.1. Automotive
- 6.3.2. Energy and Power
- 6.3.3. Manufacturing
- 6.3.4. Food and Beverage
- 6.3.5. Other End-user Industries
- 6.1. Market Analysis, Insights and Forecast - by Product
- 7. Europe Push Buttons & Signaling Devices Industry Analysis, Insights and Forecast, 2019-2031
- 7.1. Market Analysis, Insights and Forecast - by Product
- 7.1.1. Round or Square Body Type
- 7.1.2. Non-lighted Push Button
- 7.1.3. Other Products
- 7.2. Market Analysis, Insights and Forecast - by Types
- 7.2.1. Audible
- 7.2.2. Visible
- 7.2.3. Other Types
- 7.3. Market Analysis, Insights and Forecast - by End-user Industry
- 7.3.1. Automotive
- 7.3.2. Energy and Power
- 7.3.3. Manufacturing
- 7.3.4. Food and Beverage
- 7.3.5. Other End-user Industries
- 7.1. Market Analysis, Insights and Forecast - by Product
- 8. Asia Pacific Push Buttons & Signaling Devices Industry Analysis, Insights and Forecast, 2019-2031
- 8.1. Market Analysis, Insights and Forecast - by Product
- 8.1.1. Round or Square Body Type
- 8.1.2. Non-lighted Push Button
- 8.1.3. Other Products
- 8.2. Market Analysis, Insights and Forecast - by Types
- 8.2.1. Audible
- 8.2.2. Visible
- 8.2.3. Other Types
- 8.3. Market Analysis, Insights and Forecast - by End-user Industry
- 8.3.1. Automotive
- 8.3.2. Energy and Power
- 8.3.3. Manufacturing
- 8.3.4. Food and Beverage
- 8.3.5. Other End-user Industries
- 8.1. Market Analysis, Insights and Forecast - by Product
- 9. Latin America Push Buttons & Signaling Devices Industry Analysis, Insights and Forecast, 2019-2031
- 9.1. Market Analysis, Insights and Forecast - by Product
- 9.1.1. Round or Square Body Type
- 9.1.2. Non-lighted Push Button
- 9.1.3. Other Products
- 9.2. Market Analysis, Insights and Forecast - by Types
- 9.2.1. Audible
- 9.2.2. Visible
- 9.2.3. Other Types
- 9.3. Market Analysis, Insights and Forecast - by End-user Industry
- 9.3.1. Automotive
- 9.3.2. Energy and Power
- 9.3.3. Manufacturing
- 9.3.4. Food and Beverage
- 9.3.5. Other End-user Industries
- 9.1. Market Analysis, Insights and Forecast - by Product
- 10. Middle East and Africa Push Buttons & Signaling Devices Industry Analysis, Insights and Forecast, 2019-2031
- 10.1. Market Analysis, Insights and Forecast - by Product
- 10.1.1. Round or Square Body Type
- 10.1.2. Non-lighted Push Button
- 10.1.3. Other Products
- 10.2. Market Analysis, Insights and Forecast - by Types
- 10.2.1. Audible
- 10.2.2. Visible
- 10.2.3. Other Types
- 10.3. Market Analysis, Insights and Forecast - by End-user Industry
- 10.3.1. Automotive
- 10.3.2. Energy and Power
- 10.3.3. Manufacturing
- 10.3.4. Food and Beverage
- 10.3.5. Other End-user Industries
- 10.1. Market Analysis, Insights and Forecast - by Product
- 11. North America Push Buttons & Signaling Devices Industry Analysis, Insights and Forecast, 2019-2031
- 11.1. Market Analysis, Insights and Forecast - By Country/Sub-region
- 11.1.1.
- 12. Europe Push Buttons & Signaling Devices Industry Analysis, Insights and Forecast, 2019-2031
- 12.1. Market Analysis, Insights and Forecast - By Country/Sub-region
- 12.1.1.
- 13. Asia Pacific Push Buttons & Signaling Devices Industry Analysis, Insights and Forecast, 2019-2031
- 13.1. Market Analysis, Insights and Forecast - By Country/Sub-region
- 13.1.1.
- 14. Latin America Push Buttons & Signaling Devices Industry Analysis, Insights and Forecast, 2019-2031
- 14.1. Market Analysis, Insights and Forecast - By Country/Sub-region
- 14.1.1.
- 15. Middle East and Africa Push Buttons & Signaling Devices Industry Analysis, Insights and Forecast, 2019-2031
- 15.1. Market Analysis, Insights and Forecast - By Country/Sub-region
- 15.1.1.
- 16. Competitive Analysis
- 16.1. Global Market Share Analysis 2024
- 16.2. Company Profiles
- 16.2.1 ABB Ltd
- 16.2.1.1. Overview
- 16.2.1.2. Products
- 16.2.1.3. SWOT Analysis
- 16.2.1.4. Recent Developments
- 16.2.1.5. Financials (Based on Availability)
- 16.2.2 Eaton Corporation plc
- 16.2.2.1. Overview
- 16.2.2.2. Products
- 16.2.2.3. SWOT Analysis
- 16.2.2.4. Recent Developments
- 16.2.2.5. Financials (Based on Availability)
- 16.2.3 Omron Industrial Automation (Omron Corporation)
- 16.2.3.1. Overview
- 16.2.3.2. Products
- 16.2.3.3. SWOT Analysis
- 16.2.3.4. Recent Developments
- 16.2.3.5. Financials (Based on Availability)
- 16.2.4 Nuova ASP SRL
- 16.2.4.1. Overview
- 16.2.4.2. Products
- 16.2.4.3. SWOT Analysis
- 16.2.4.4. Recent Developments
- 16.2.4.5. Financials (Based on Availability)
- 16.2.5 Siemens AG
- 16.2.5.1. Overview
- 16.2.5.2. Products
- 16.2.5.3. SWOT Analysis
- 16.2.5.4. Recent Developments
- 16.2.5.5. Financials (Based on Availability)
- 16.2.6 Oslo Switch Inc *List Not Exhaustive
- 16.2.6.1. Overview
- 16.2.6.2. Products
- 16.2.6.3. SWOT Analysis
- 16.2.6.4. Recent Developments
- 16.2.6.5. Financials (Based on Availability)
- 16.2.7 Schneider Electric
- 16.2.7.1. Overview
- 16.2.7.2. Products
- 16.2.7.3. SWOT Analysis
- 16.2.7.4. Recent Developments
- 16.2.7.5. Financials (Based on Availability)
- 16.2.8 Switronic Industrial Corp
- 16.2.8.1. Overview
- 16.2.8.2. Products
- 16.2.8.3. SWOT Analysis
- 16.2.8.4. Recent Developments
- 16.2.8.5. Financials (Based on Availability)
- 16.2.9 Rockwell Automation Inc
- 16.2.9.1. Overview
- 16.2.9.2. Products
- 16.2.9.3. SWOT Analysis
- 16.2.9.4. Recent Developments
- 16.2.9.5. Financials (Based on Availability)
- 16.2.10 BACO Controls Inc
- 16.2.10.1. Overview
- 16.2.10.2. Products
- 16.2.10.3. SWOT Analysis
- 16.2.10.4. Recent Developments
- 16.2.10.5. Financials (Based on Availability)
- 16.2.1 ABB Ltd
List of Figures
- Figure 1: Global Push Buttons & Signaling Devices Industry Revenue Breakdown (Million, %) by Region 2024 & 2032
- Figure 2: North America Push Buttons & Signaling Devices Industry Revenue (Million), by Country 2024 & 2032
- Figure 3: North America Push Buttons & Signaling Devices Industry Revenue Share (%), by Country 2024 & 2032
- Figure 4: Europe Push Buttons & Signaling Devices Industry Revenue (Million), by Country 2024 & 2032
- Figure 5: Europe Push Buttons & Signaling Devices Industry Revenue Share (%), by Country 2024 & 2032
- Figure 6: Asia Pacific Push Buttons & Signaling Devices Industry Revenue (Million), by Country 2024 & 2032
- Figure 7: Asia Pacific Push Buttons & Signaling Devices Industry Revenue Share (%), by Country 2024 & 2032
- Figure 8: Latin America Push Buttons & Signaling Devices Industry Revenue (Million), by Country 2024 & 2032
- Figure 9: Latin America Push Buttons & Signaling Devices Industry Revenue Share (%), by Country 2024 & 2032
- Figure 10: Middle East and Africa Push Buttons & Signaling Devices Industry Revenue (Million), by Country 2024 & 2032
- Figure 11: Middle East and Africa Push Buttons & Signaling Devices Industry Revenue Share (%), by Country 2024 & 2032
- Figure 12: North America Push Buttons & Signaling Devices Industry Revenue (Million), by Product 2024 & 2032
- Figure 13: North America Push Buttons & Signaling Devices Industry Revenue Share (%), by Product 2024 & 2032
- Figure 14: North America Push Buttons & Signaling Devices Industry Revenue (Million), by Types 2024 & 2032
- Figure 15: North America Push Buttons & Signaling Devices Industry Revenue Share (%), by Types 2024 & 2032
- Figure 16: North America Push Buttons & Signaling Devices Industry Revenue (Million), by End-user Industry 2024 & 2032
- Figure 17: North America Push Buttons & Signaling Devices Industry Revenue Share (%), by End-user Industry 2024 & 2032
- Figure 18: North America Push Buttons & Signaling Devices Industry Revenue (Million), by Country 2024 & 2032
- Figure 19: North America Push Buttons & Signaling Devices Industry Revenue Share (%), by Country 2024 & 2032
- Figure 20: Europe Push Buttons & Signaling Devices Industry Revenue (Million), by Product 2024 & 2032
- Figure 21: Europe Push Buttons & Signaling Devices Industry Revenue Share (%), by Product 2024 & 2032
- Figure 22: Europe Push Buttons & Signaling Devices Industry Revenue (Million), by Types 2024 & 2032
- Figure 23: Europe Push Buttons & Signaling Devices Industry Revenue Share (%), by Types 2024 & 2032
- Figure 24: Europe Push Buttons & Signaling Devices Industry Revenue (Million), by End-user Industry 2024 & 2032
- Figure 25: Europe Push Buttons & Signaling Devices Industry Revenue Share (%), by End-user Industry 2024 & 2032
- Figure 26: Europe Push Buttons & Signaling Devices Industry Revenue (Million), by Country 2024 & 2032
- Figure 27: Europe Push Buttons & Signaling Devices Industry Revenue Share (%), by Country 2024 & 2032
- Figure 28: Asia Pacific Push Buttons & Signaling Devices Industry Revenue (Million), by Product 2024 & 2032
- Figure 29: Asia Pacific Push Buttons & Signaling Devices Industry Revenue Share (%), by Product 2024 & 2032
- Figure 30: Asia Pacific Push Buttons & Signaling Devices Industry Revenue (Million), by Types 2024 & 2032
- Figure 31: Asia Pacific Push Buttons & Signaling Devices Industry Revenue Share (%), by Types 2024 & 2032
- Figure 32: Asia Pacific Push Buttons & Signaling Devices Industry Revenue (Million), by End-user Industry 2024 & 2032
- Figure 33: Asia Pacific Push Buttons & Signaling Devices Industry Revenue Share (%), by End-user Industry 2024 & 2032
- Figure 34: Asia Pacific Push Buttons & Signaling Devices Industry Revenue (Million), by Country 2024 & 2032
- Figure 35: Asia Pacific Push Buttons & Signaling Devices Industry Revenue Share (%), by Country 2024 & 2032
- Figure 36: Latin America Push Buttons & Signaling Devices Industry Revenue (Million), by Product 2024 & 2032
- Figure 37: Latin America Push Buttons & Signaling Devices Industry Revenue Share (%), by Product 2024 & 2032
- Figure 38: Latin America Push Buttons & Signaling Devices Industry Revenue (Million), by Types 2024 & 2032
- Figure 39: Latin America Push Buttons & Signaling Devices Industry Revenue Share (%), by Types 2024 & 2032
- Figure 40: Latin America Push Buttons & Signaling Devices Industry Revenue (Million), by End-user Industry 2024 & 2032
- Figure 41: Latin America Push Buttons & Signaling Devices Industry Revenue Share (%), by End-user Industry 2024 & 2032
- Figure 42: Latin America Push Buttons & Signaling Devices Industry Revenue (Million), by Country 2024 & 2032
- Figure 43: Latin America Push Buttons & Signaling Devices Industry Revenue Share (%), by Country 2024 & 2032
- Figure 44: Middle East and Africa Push Buttons & Signaling Devices Industry Revenue (Million), by Product 2024 & 2032
- Figure 45: Middle East and Africa Push Buttons & Signaling Devices Industry Revenue Share (%), by Product 2024 & 2032
- Figure 46: Middle East and Africa Push Buttons & Signaling Devices Industry Revenue (Million), by Types 2024 & 2032
- Figure 47: Middle East and Africa Push Buttons & Signaling Devices Industry Revenue Share (%), by Types 2024 & 2032
- Figure 48: Middle East and Africa Push Buttons & Signaling Devices Industry Revenue (Million), by End-user Industry 2024 & 2032
- Figure 49: Middle East and Africa Push Buttons & Signaling Devices Industry Revenue Share (%), by End-user Industry 2024 & 2032
- Figure 50: Middle East and Africa Push Buttons & Signaling Devices Industry Revenue (Million), by Country 2024 & 2032
- Figure 51: Middle East and Africa Push Buttons & Signaling Devices Industry Revenue Share (%), by Country 2024 & 2032
List of Tables
- Table 1: Global Push Buttons & Signaling Devices Industry Revenue Million Forecast, by Region 2019 & 2032
- Table 2: Global Push Buttons & Signaling Devices Industry Revenue Million Forecast, by Product 2019 & 2032
- Table 3: Global Push Buttons & Signaling Devices Industry Revenue Million Forecast, by Types 2019 & 2032
- Table 4: Global Push Buttons & Signaling Devices Industry Revenue Million Forecast, by End-user Industry 2019 & 2032
- Table 5: Global Push Buttons & Signaling Devices Industry Revenue Million Forecast, by Region 2019 & 2032
- Table 6: Global Push Buttons & Signaling Devices Industry Revenue Million Forecast, by Country 2019 & 2032
- Table 7: Push Buttons & Signaling Devices Industry Revenue (Million) Forecast, by Application 2019 & 2032
- Table 8: Global Push Buttons & Signaling Devices Industry Revenue Million Forecast, by Country 2019 & 2032
- Table 9: Push Buttons & Signaling Devices Industry Revenue (Million) Forecast, by Application 2019 & 2032
- Table 10: Global Push Buttons & Signaling Devices Industry Revenue Million Forecast, by Country 2019 & 2032
- Table 11: Push Buttons & Signaling Devices Industry Revenue (Million) Forecast, by Application 2019 & 2032
- Table 12: Global Push Buttons & Signaling Devices Industry Revenue Million Forecast, by Country 2019 & 2032
- Table 13: Push Buttons & Signaling Devices Industry Revenue (Million) Forecast, by Application 2019 & 2032
- Table 14: Global Push Buttons & Signaling Devices Industry Revenue Million Forecast, by Country 2019 & 2032
- Table 15: Push Buttons & Signaling Devices Industry Revenue (Million) Forecast, by Application 2019 & 2032
- Table 16: Global Push Buttons & Signaling Devices Industry Revenue Million Forecast, by Product 2019 & 2032
- Table 17: Global Push Buttons & Signaling Devices Industry Revenue Million Forecast, by Types 2019 & 2032
- Table 18: Global Push Buttons & Signaling Devices Industry Revenue Million Forecast, by End-user Industry 2019 & 2032
- Table 19: Global Push Buttons & Signaling Devices Industry Revenue Million Forecast, by Country 2019 & 2032
- Table 20: Global Push Buttons & Signaling Devices Industry Revenue Million Forecast, by Product 2019 & 2032
- Table 21: Global Push Buttons & Signaling Devices Industry Revenue Million Forecast, by Types 2019 & 2032
- Table 22: Global Push Buttons & Signaling Devices Industry Revenue Million Forecast, by End-user Industry 2019 & 2032
- Table 23: Global Push Buttons & Signaling Devices Industry Revenue Million Forecast, by Country 2019 & 2032
- Table 24: Global Push Buttons & Signaling Devices Industry Revenue Million Forecast, by Product 2019 & 2032
- Table 25: Global Push Buttons & Signaling Devices Industry Revenue Million Forecast, by Types 2019 & 2032
- Table 26: Global Push Buttons & Signaling Devices Industry Revenue Million Forecast, by End-user Industry 2019 & 2032
- Table 27: Global Push Buttons & Signaling Devices Industry Revenue Million Forecast, by Country 2019 & 2032
- Table 28: Global Push Buttons & Signaling Devices Industry Revenue Million Forecast, by Product 2019 & 2032
- Table 29: Global Push Buttons & Signaling Devices Industry Revenue Million Forecast, by Types 2019 & 2032
- Table 30: Global Push Buttons & Signaling Devices Industry Revenue Million Forecast, by End-user Industry 2019 & 2032
- Table 31: Global Push Buttons & Signaling Devices Industry Revenue Million Forecast, by Country 2019 & 2032
- Table 32: Global Push Buttons & Signaling Devices Industry Revenue Million Forecast, by Product 2019 & 2032
- Table 33: Global Push Buttons & Signaling Devices Industry Revenue Million Forecast, by Types 2019 & 2032
- Table 34: Global Push Buttons & Signaling Devices Industry Revenue Million Forecast, by End-user Industry 2019 & 2032
- Table 35: Global Push Buttons & Signaling Devices Industry Revenue Million Forecast, by Country 2019 & 2032
Frequently Asked Questions
1. What is the projected Compound Annual Growth Rate (CAGR) of the Push Buttons & Signaling Devices Industry?
The projected CAGR is approximately 5.00%.
2. Which companies are prominent players in the Push Buttons & Signaling Devices Industry?
Key companies in the market include ABB Ltd, Eaton Corporation plc, Omron Industrial Automation (Omron Corporation), Nuova ASP SRL, Siemens AG, Oslo Switch Inc *List Not Exhaustive, Schneider Electric, Switronic Industrial Corp, Rockwell Automation Inc, BACO Controls Inc.
3. What are the main segments of the Push Buttons & Signaling Devices Industry?
The market segments include Product, Types, End-user Industry.
4. Can you provide details about the market size?
The market size is estimated to be USD XX Million as of 2022.
5. What are some drivers contributing to market growth?
Creating Safe Working Environment For The Industrial Workers; Favorable Government Regulations For Industrial Safety.
6. What are the notable trends driving market growth?
Automotive Industry to Drive the Market Growth.
7. Are there any restraints impacting market growth?
High Initial Investment in Creating Supporting Infrastructure and Automation.
8. Can you provide examples of recent developments in the market?
September 2022 - The Blue Valley School District announced a new crisis alert system that allows Blue Valley staff members to call for help by pushing a button with a specialized badge. This system will be added to schools during the 2022-23 school year.
9. What pricing options are available for accessing the report?
Pricing options include single-user, multi-user, and enterprise licenses priced at USD 4750, USD 5250, and USD 8750 respectively.
10. Is the market size provided in terms of value or volume?
The market size is provided in terms of value, measured in Million.
11. Are there any specific market keywords associated with the report?
Yes, the market keyword associated with the report is "Push Buttons & Signaling Devices Industry," which aids in identifying and referencing the specific market segment covered.
12. How do I determine which pricing option suits my needs best?
The pricing options vary based on user requirements and access needs. Individual users may opt for single-user licenses, while businesses requiring broader access may choose multi-user or enterprise licenses for cost-effective access to the report.
13. Are there any additional resources or data provided in the Push Buttons & Signaling Devices Industry report?
While the report offers comprehensive insights, it's advisable to review the specific contents or supplementary materials provided to ascertain if additional resources or data are available.
14. How can I stay updated on further developments or reports in the Push Buttons & Signaling Devices Industry?
To stay informed about further developments, trends, and reports in the Push Buttons & Signaling Devices Industry, consider subscribing to industry newsletters, following relevant companies and organizations, or regularly checking reputable industry news sources and publications.
Methodology
Step 1 - Identification of Relevant Samples Size from Population Database


Step 2 - Approaches for Defining Global Market Size (Value, Volume* & Price*)

Note*: In applicable scenarios
Step 3 - Data Sources
Primary Research
- Web Analytics
- Survey Reports
- Research Institute
- Latest Research Reports
- Opinion Leaders
Secondary Research
- Annual Reports
- White Paper
- Latest Press Release
- Industry Association
- Paid Database
- Investor Presentations

Step 4 - Data Triangulation
Involves using different sources of information in order to increase the validity of a study
These sources are likely to be stakeholders in a program - participants, other researchers, program staff, other community members, and so on.
Then we put all data in single framework & apply various statistical tools to find out the dynamic on the market.
During the analysis stage, feedback from the stakeholder groups would be compared to determine areas of agreement as well as areas of divergence
