

Key Insights
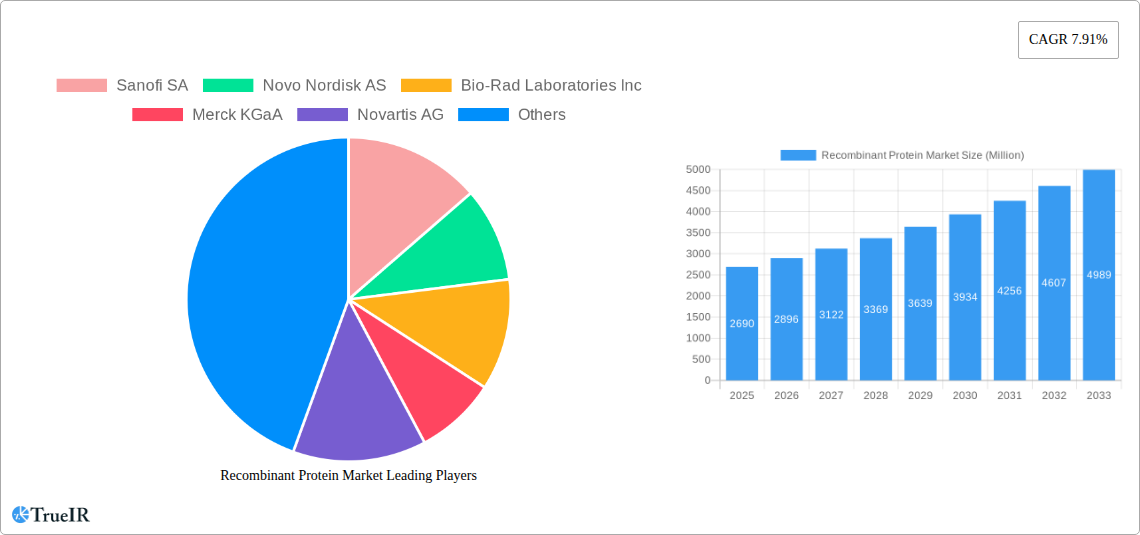
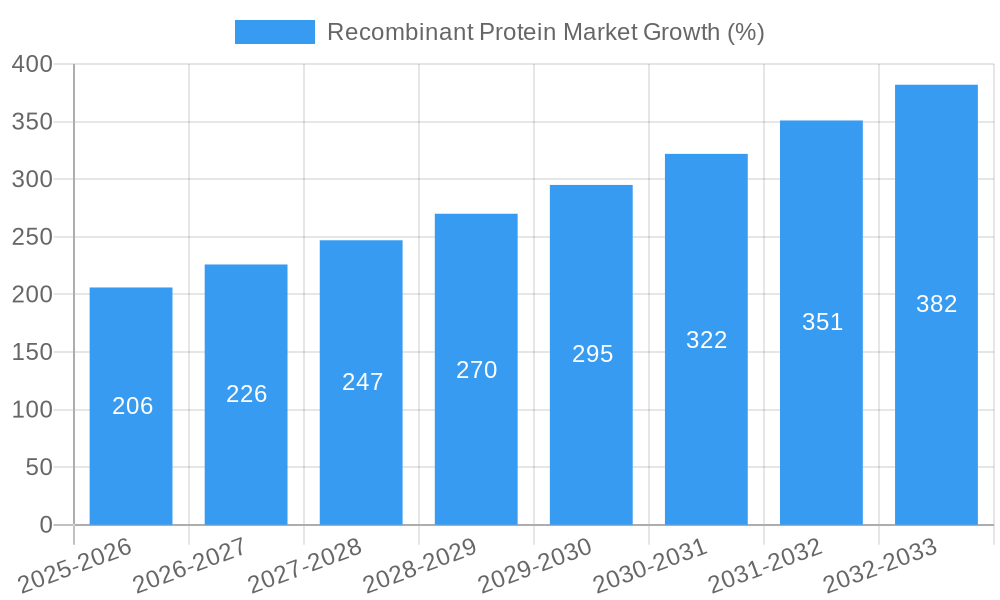
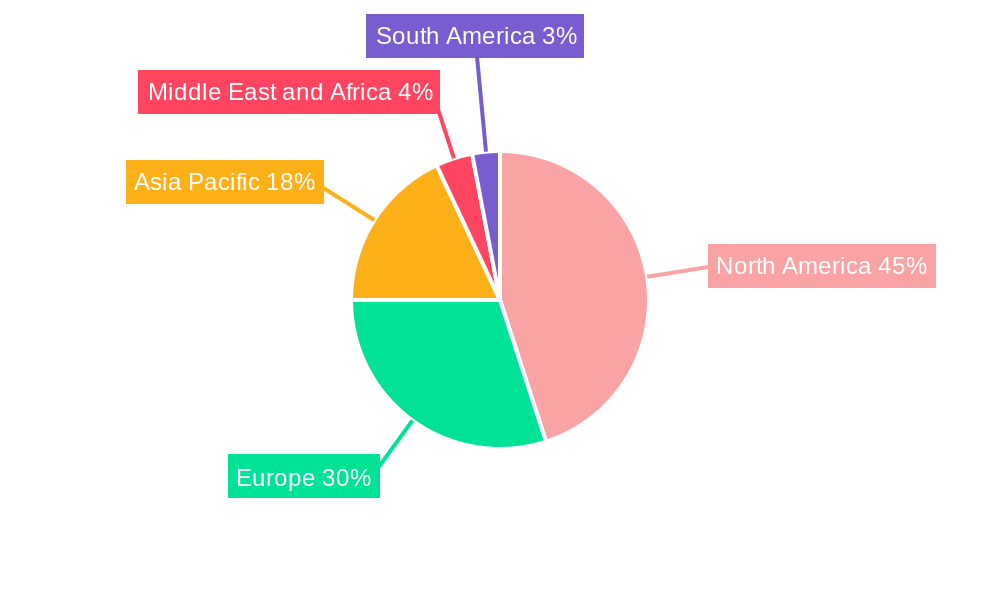
The Recombinant Protein market, valued at $2.69 billion in 2025, is projected to experience robust growth, driven by the escalating demand for biopharmaceuticals and advancements in biotechnology. The market's Compound Annual Growth Rate (CAGR) of 7.91% from 2025 to 2033 indicates a significant expansion, fueled primarily by the increasing prevalence of chronic diseases necessitating advanced therapies, and the rising adoption of recombinant proteins in research and development. Key segments contributing to this growth are therapeutic applications, notably in oncology and immunology, alongside the burgeoning biotechnology industry's reliance on recombinant proteins for various processes. The substantial investments in research and development by pharmaceutical and biotechnology companies further bolster market expansion. North America, currently holding a significant market share, is expected to maintain its dominance due to its well-established healthcare infrastructure, robust regulatory frameworks, and high adoption rate of innovative therapies. However, the Asia-Pacific region is poised for substantial growth, driven by rising healthcare spending and increasing awareness of advanced therapeutic options. Competitive dynamics within the market are shaped by a mix of established pharmaceutical giants and innovative biotechnology companies, all vying for market share through strategic partnerships, acquisitions, and the development of novel recombinant protein-based therapies.
The market's growth trajectory is anticipated to be influenced by several factors. Technological advancements in protein engineering and production techniques will continue to drive efficiency and cost-effectiveness. Stringent regulatory approvals and the high cost of developing and manufacturing these proteins remain challenges. However, the increasing availability of sophisticated analytical tools and the rise of personalized medicine are expected to mitigate these challenges. The market segmentation by product type (hormones, growth factors, antibodies, enzymes, and others) and application (research, therapeutic use, and biotechnology) reveals diverse opportunities. The continuous exploration of novel therapeutic applications, coupled with strategic collaborations across the value chain, will further accelerate the market's growth in the forecast period (2025-2033). The competitive landscape, characterized by the presence of major pharmaceutical players and emerging biotech companies, will intensify competition, driving innovation and offering diverse therapeutic options to patients globally.
Recombinant Protein Market: A Comprehensive Report (2019-2033)
This dynamic report provides a comprehensive analysis of the Recombinant Protein market, offering invaluable insights for industry stakeholders, investors, and researchers. Covering the period from 2019 to 2033, with a focus on 2025, this report delves into market size, growth drivers, competitive landscape, and future trends. Leveraging extensive data and expert analysis, this report is designed to empower strategic decision-making within the rapidly evolving recombinant protein landscape.
Recombinant Protein Market Market Structure & Competitive Landscape
The Recombinant Protein market is characterized by a moderately concentrated structure, with several key players holding significant market share. The Herfindahl-Hirschman Index (HHI) for 2024 is estimated at xx, indicating a moderately concentrated market. Innovation is a crucial driver, with companies continuously investing in R&D to develop novel recombinant proteins with enhanced efficacy and safety profiles. Stringent regulatory frameworks govern the development and approval of recombinant protein products, influencing market dynamics significantly. Product substitution is limited due to the highly specific nature of many recombinant proteins; however, biosimilars are increasingly competing with originator brands.
The market is segmented by end-user, primarily encompassing research applications, therapeutic use, and the biotechnology industry. Mergers and acquisitions (M&A) activity has been moderate over the past five years, with an estimated xx Million in transactions annually. Key M&A trends involve strategic acquisitions of companies with specialized technologies or strong product pipelines.
- Market Concentration: HHI (2024) - xx
- Innovation Drivers: R&D investment, technological advancements in protein engineering and production.
- Regulatory Impacts: Stringent regulatory approvals, impacting time to market and cost.
- Product Substitutes: Biosimilars, limited substitution due to product specificity.
- End-User Segmentation: Research applications, therapeutic use, biotechnology industry.
- M&A Trends: Strategic acquisitions, focusing on technology and product pipelines.
Recombinant Protein Market Market Trends & Opportunities
The global recombinant protein market is experiencing robust growth, with an estimated Compound Annual Growth Rate (CAGR) of xx% during the forecast period (2025-2033). This growth is fueled by several factors including the rising prevalence of chronic diseases, increasing demand for targeted therapies, advancements in biotechnology, and the growing adoption of recombinant proteins in research and development. Market penetration rates vary across different segments and geographical regions, with the highest penetration observed in developed economies. The therapeutic use segment is projected to dominate the market, driven by the increasing demand for biologics in various therapeutic areas. Technological advancements, including improved production methods and novel protein engineering techniques, are further expanding the market potential. Competitive dynamics are shaped by both established pharmaceutical companies and emerging biotechnology firms, leading to increased innovation and price competition. The market presents significant opportunities for companies that can effectively leverage these trends and develop innovative products.
Dominant Markets & Segments in Recombinant Protein Market
The North American region currently holds the largest market share in the recombinant protein market, followed by Europe. Within the product segment, antibodies and growth factors represent significant portions of the market, driven by their diverse applications in therapeutics and research. The therapeutic use segment continues to be the dominant application, accounting for a significant majority of market revenue.
- Key Growth Drivers (North America): Robust healthcare infrastructure, high R&D investments, strong regulatory support.
- Key Growth Drivers (Europe): High prevalence of chronic diseases, significant investments in biotechnology.
- Product Segment Dominance: Antibodies and growth factors drive significant market share due to therapeutic and research applications.
- Application Segment Dominance: Therapeutic applications consistently dominate owing to increasing demand for biologics.
Recombinant Protein Market Product Analysis
Significant advancements in recombinant protein technology have led to the development of novel products with enhanced efficacy, safety, and stability. These advancements include the use of advanced expression systems, improved purification methods, and protein engineering techniques to create customized proteins with tailored properties. The market offers a wide array of recombinant proteins, categorized by product type (hormone, growth factor, antibody, enzyme, and others) and application. The successful market fit of these products hinges on their ability to address unmet medical needs, cost-effectiveness, and regulatory approval.
Key Drivers, Barriers & Challenges in Recombinant Protein Market
Key Drivers: Increasing prevalence of chronic diseases driving demand for advanced therapeutics; substantial investments in biotechnology research and development; regulatory support for biopharmaceutical innovation.
Challenges: High production costs limiting accessibility; stringent regulatory pathways leading to longer approval times; intense competition among industry players; supply chain disruptions impacting availability and pricing. The estimated impact of these challenges leads to a reduction in market growth of approximately xx% annually.
Growth Drivers in the Recombinant Protein Market Market
The Recombinant Protein market's growth is primarily driven by technological advancements in protein engineering and production methods, expanding the range of applications and improving product efficacy. The rising prevalence of chronic diseases, particularly in aging populations, fuels the demand for targeted therapeutics, further boosting market growth. Favorable regulatory landscapes in certain regions encourage innovation and market expansion.
Challenges Impacting Recombinant Protein Market Growth
Stringent regulatory hurdles significantly increase the time and cost associated with bringing new recombinant protein products to market. Supply chain vulnerabilities, including raw material shortages and manufacturing bottlenecks, can disrupt production and impact market availability. Fierce competition among established players and emerging companies puts downward pressure on pricing and profitability.
Key Players Shaping the Recombinant Protein Market Market
- Sanofi SA
- Novo Nordisk AS
- Bio-Rad Laboratories Inc
- Merck KGaA
- Novartis AG
- Amgen Inc
- Thermo Fisher Scientific Inc
- Eli Lilly and Company
- Abbvie Inc
- Novavax Inc
- Pfizer Inc
- GlaxoSmithKline PLC
Significant Recombinant Protein Market Industry Milestones
- September 2022: Sartorius StedimBiotech acquired Albumedix Ltd., expanding its presence in recombinant albumin-based solutions.
- September 2022: Attralus, Inc. announced promising preclinical data for its pan-amyloid removal therapeutic candidate, AT-02, demonstrating a 50% reduction in cardiac amyloid deposits in a systemic amyloidosis animal model.
Future Outlook for Recombinant Protein Market Market
The recombinant protein market is poised for continued expansion, driven by ongoing technological advancements, the increasing prevalence of chronic diseases, and a growing pipeline of innovative products. Strategic partnerships and collaborations between pharmaceutical companies and biotechnology firms are expected to accelerate innovation and market penetration. The market offers substantial opportunities for companies capable of developing effective, safe, and cost-effective recombinant protein-based therapeutics.
Recombinant Protein Market Segmentation
-
1. Product
- 1.1. Hormone
- 1.2. Growth Factor
- 1.3. Antibody
- 1.4. Enzyme
- 1.5. Other Types of Products
-
2. Application
- 2.1. Research Application
- 2.2. Therapeutic Use
- 2.3. Biotechnology Industry
Recombinant Protein Market Segmentation By Geography
-
1. North America
- 1.1. United States
- 1.2. Canada
- 1.3. Mexico
-
2. Europe
- 2.1. Germany
- 2.2. United Kingdom
- 2.3. France
- 2.4. Italy
- 2.5. Spain
- 2.6. Rest of Europe
-
3. Asia Pacific
- 3.1. China
- 3.2. Japan
- 3.3. India
- 3.4. Australia
- 3.5. South Korea
- 3.6. Rest of Asia Pacific
-
4. Middle East and Africa
- 4.1. GCC
- 4.2. South Africa
- 4.3. Rest of Middle East and Africa
-
5. South America
- 5.1. Brazil
- 5.2. Argentina
- 5.3. Rest of South America
Recombinant Protein Market REPORT HIGHLIGHTS
| Aspects | Details |
|---|---|
| Study Period | 2019-2033 |
| Base Year | 2024 |
| Estimated Year | 2025 |
| Forecast Period | 2025-2033 |
| Historical Period | 2019-2024 |
| Growth Rate | CAGR of 7.91% from 2019-2033 |
| Segmentation |
|
Table of Contents
- 1. Introduction
- 1.1. Research Scope
- 1.2. Market Segmentation
- 1.3. Research Methodology
- 1.4. Definitions and Assumptions
- 2. Executive Summary
- 2.1. Introduction
- 3. Market Dynamics
- 3.1. Introduction
- 3.2. Market Drivers
- 3.2.1. Increasing Expenditure on Research and Development; Growing Burden of Chronic Diseases; Rising Inclination toward Biologics and Biosimilars; Technological Advancements in Recombinant Products
- 3.3. Market Restrains
- 3.3.1. Expensive and Time-consuming Production Process
- 3.4. Market Trends
- 3.4.1. Antibody Segment is Expected to Witness a Significant Growth Over the Forecast Period.
- 4. Market Factor Analysis
- 4.1. Porters Five Forces
- 4.2. Supply/Value Chain
- 4.3. PESTEL analysis
- 4.4. Market Entropy
- 4.5. Patent/Trademark Analysis
- 5. Global Recombinant Protein Market Analysis, Insights and Forecast, 2019-2031
- 5.1. Market Analysis, Insights and Forecast - by Product
- 5.1.1. Hormone
- 5.1.2. Growth Factor
- 5.1.3. Antibody
- 5.1.4. Enzyme
- 5.1.5. Other Types of Products
- 5.2. Market Analysis, Insights and Forecast - by Application
- 5.2.1. Research Application
- 5.2.2. Therapeutic Use
- 5.2.3. Biotechnology Industry
- 5.3. Market Analysis, Insights and Forecast - by Region
- 5.3.1. North America
- 5.3.2. Europe
- 5.3.3. Asia Pacific
- 5.3.4. Middle East and Africa
- 5.3.5. South America
- 5.1. Market Analysis, Insights and Forecast - by Product
- 6. North America Recombinant Protein Market Analysis, Insights and Forecast, 2019-2031
- 6.1. Market Analysis, Insights and Forecast - by Product
- 6.1.1. Hormone
- 6.1.2. Growth Factor
- 6.1.3. Antibody
- 6.1.4. Enzyme
- 6.1.5. Other Types of Products
- 6.2. Market Analysis, Insights and Forecast - by Application
- 6.2.1. Research Application
- 6.2.2. Therapeutic Use
- 6.2.3. Biotechnology Industry
- 6.1. Market Analysis, Insights and Forecast - by Product
- 7. Europe Recombinant Protein Market Analysis, Insights and Forecast, 2019-2031
- 7.1. Market Analysis, Insights and Forecast - by Product
- 7.1.1. Hormone
- 7.1.2. Growth Factor
- 7.1.3. Antibody
- 7.1.4. Enzyme
- 7.1.5. Other Types of Products
- 7.2. Market Analysis, Insights and Forecast - by Application
- 7.2.1. Research Application
- 7.2.2. Therapeutic Use
- 7.2.3. Biotechnology Industry
- 7.1. Market Analysis, Insights and Forecast - by Product
- 8. Asia Pacific Recombinant Protein Market Analysis, Insights and Forecast, 2019-2031
- 8.1. Market Analysis, Insights and Forecast - by Product
- 8.1.1. Hormone
- 8.1.2. Growth Factor
- 8.1.3. Antibody
- 8.1.4. Enzyme
- 8.1.5. Other Types of Products
- 8.2. Market Analysis, Insights and Forecast - by Application
- 8.2.1. Research Application
- 8.2.2. Therapeutic Use
- 8.2.3. Biotechnology Industry
- 8.1. Market Analysis, Insights and Forecast - by Product
- 9. Middle East and Africa Recombinant Protein Market Analysis, Insights and Forecast, 2019-2031
- 9.1. Market Analysis, Insights and Forecast - by Product
- 9.1.1. Hormone
- 9.1.2. Growth Factor
- 9.1.3. Antibody
- 9.1.4. Enzyme
- 9.1.5. Other Types of Products
- 9.2. Market Analysis, Insights and Forecast - by Application
- 9.2.1. Research Application
- 9.2.2. Therapeutic Use
- 9.2.3. Biotechnology Industry
- 9.1. Market Analysis, Insights and Forecast - by Product
- 10. South America Recombinant Protein Market Analysis, Insights and Forecast, 2019-2031
- 10.1. Market Analysis, Insights and Forecast - by Product
- 10.1.1. Hormone
- 10.1.2. Growth Factor
- 10.1.3. Antibody
- 10.1.4. Enzyme
- 10.1.5. Other Types of Products
- 10.2. Market Analysis, Insights and Forecast - by Application
- 10.2.1. Research Application
- 10.2.2. Therapeutic Use
- 10.2.3. Biotechnology Industry
- 10.1. Market Analysis, Insights and Forecast - by Product
- 11. North America Recombinant Protein Market Analysis, Insights and Forecast, 2019-2031
- 11.1. Market Analysis, Insights and Forecast - By Country/Sub-region
- 11.1.1 United States
- 11.1.2 Canada
- 11.1.3 Mexico
- 12. Europe Recombinant Protein Market Analysis, Insights and Forecast, 2019-2031
- 12.1. Market Analysis, Insights and Forecast - By Country/Sub-region
- 12.1.1 Germany
- 12.1.2 United Kingdom
- 12.1.3 France
- 12.1.4 Italy
- 12.1.5 Spain
- 12.1.6 Rest of Europe
- 13. Asia Pacific Recombinant Protein Market Analysis, Insights and Forecast, 2019-2031
- 13.1. Market Analysis, Insights and Forecast - By Country/Sub-region
- 13.1.1 China
- 13.1.2 Japan
- 13.1.3 India
- 13.1.4 Australia
- 13.1.5 South Korea
- 13.1.6 Rest of Asia Pacific
- 14. Middle East and Africa Recombinant Protein Market Analysis, Insights and Forecast, 2019-2031
- 14.1. Market Analysis, Insights and Forecast - By Country/Sub-region
- 14.1.1 GCC
- 14.1.2 South Africa
- 14.1.3 Rest of Middle East and Africa
- 15. South America Recombinant Protein Market Analysis, Insights and Forecast, 2019-2031
- 15.1. Market Analysis, Insights and Forecast - By Country/Sub-region
- 15.1.1 Brazil
- 15.1.2 Argentina
- 15.1.3 Rest of South America
- 16. Competitive Analysis
- 16.1. Global Market Share Analysis 2024
- 16.2. Company Profiles
- 16.2.1 Sanofi SA
- 16.2.1.1. Overview
- 16.2.1.2. Products
- 16.2.1.3. SWOT Analysis
- 16.2.1.4. Recent Developments
- 16.2.1.5. Financials (Based on Availability)
- 16.2.2 Novo Nordisk AS
- 16.2.2.1. Overview
- 16.2.2.2. Products
- 16.2.2.3. SWOT Analysis
- 16.2.2.4. Recent Developments
- 16.2.2.5. Financials (Based on Availability)
- 16.2.3 Bio-Rad Laboratories Inc
- 16.2.3.1. Overview
- 16.2.3.2. Products
- 16.2.3.3. SWOT Analysis
- 16.2.3.4. Recent Developments
- 16.2.3.5. Financials (Based on Availability)
- 16.2.4 Merck KGaA
- 16.2.4.1. Overview
- 16.2.4.2. Products
- 16.2.4.3. SWOT Analysis
- 16.2.4.4. Recent Developments
- 16.2.4.5. Financials (Based on Availability)
- 16.2.5 Novartis AG
- 16.2.5.1. Overview
- 16.2.5.2. Products
- 16.2.5.3. SWOT Analysis
- 16.2.5.4. Recent Developments
- 16.2.5.5. Financials (Based on Availability)
- 16.2.6 Amgen Inc
- 16.2.6.1. Overview
- 16.2.6.2. Products
- 16.2.6.3. SWOT Analysis
- 16.2.6.4. Recent Developments
- 16.2.6.5. Financials (Based on Availability)
- 16.2.7 Thermo Fisher Scientific Inc
- 16.2.7.1. Overview
- 16.2.7.2. Products
- 16.2.7.3. SWOT Analysis
- 16.2.7.4. Recent Developments
- 16.2.7.5. Financials (Based on Availability)
- 16.2.8 Eli Lilly and Company
- 16.2.8.1. Overview
- 16.2.8.2. Products
- 16.2.8.3. SWOT Analysis
- 16.2.8.4. Recent Developments
- 16.2.8.5. Financials (Based on Availability)
- 16.2.9 Abbvie Inc
- 16.2.9.1. Overview
- 16.2.9.2. Products
- 16.2.9.3. SWOT Analysis
- 16.2.9.4. Recent Developments
- 16.2.9.5. Financials (Based on Availability)
- 16.2.10 Novavax Inc
- 16.2.10.1. Overview
- 16.2.10.2. Products
- 16.2.10.3. SWOT Analysis
- 16.2.10.4. Recent Developments
- 16.2.10.5. Financials (Based on Availability)
- 16.2.11 Pfizer Inc
- 16.2.11.1. Overview
- 16.2.11.2. Products
- 16.2.11.3. SWOT Analysis
- 16.2.11.4. Recent Developments
- 16.2.11.5. Financials (Based on Availability)
- 16.2.12 GlaxoSmithKline PLC
- 16.2.12.1. Overview
- 16.2.12.2. Products
- 16.2.12.3. SWOT Analysis
- 16.2.12.4. Recent Developments
- 16.2.12.5. Financials (Based on Availability)
- 16.2.1 Sanofi SA
List of Figures
- Figure 1: Global Recombinant Protein Market Revenue Breakdown (Million, %) by Region 2024 & 2032
- Figure 2: Global Recombinant Protein Market Volume Breakdown (K Unit, %) by Region 2024 & 2032
- Figure 3: North America Recombinant Protein Market Revenue (Million), by Country 2024 & 2032
- Figure 4: North America Recombinant Protein Market Volume (K Unit), by Country 2024 & 2032
- Figure 5: North America Recombinant Protein Market Revenue Share (%), by Country 2024 & 2032
- Figure 6: North America Recombinant Protein Market Volume Share (%), by Country 2024 & 2032
- Figure 7: Europe Recombinant Protein Market Revenue (Million), by Country 2024 & 2032
- Figure 8: Europe Recombinant Protein Market Volume (K Unit), by Country 2024 & 2032
- Figure 9: Europe Recombinant Protein Market Revenue Share (%), by Country 2024 & 2032
- Figure 10: Europe Recombinant Protein Market Volume Share (%), by Country 2024 & 2032
- Figure 11: Asia Pacific Recombinant Protein Market Revenue (Million), by Country 2024 & 2032
- Figure 12: Asia Pacific Recombinant Protein Market Volume (K Unit), by Country 2024 & 2032
- Figure 13: Asia Pacific Recombinant Protein Market Revenue Share (%), by Country 2024 & 2032
- Figure 14: Asia Pacific Recombinant Protein Market Volume Share (%), by Country 2024 & 2032
- Figure 15: Middle East and Africa Recombinant Protein Market Revenue (Million), by Country 2024 & 2032
- Figure 16: Middle East and Africa Recombinant Protein Market Volume (K Unit), by Country 2024 & 2032
- Figure 17: Middle East and Africa Recombinant Protein Market Revenue Share (%), by Country 2024 & 2032
- Figure 18: Middle East and Africa Recombinant Protein Market Volume Share (%), by Country 2024 & 2032
- Figure 19: South America Recombinant Protein Market Revenue (Million), by Country 2024 & 2032
- Figure 20: South America Recombinant Protein Market Volume (K Unit), by Country 2024 & 2032
- Figure 21: South America Recombinant Protein Market Revenue Share (%), by Country 2024 & 2032
- Figure 22: South America Recombinant Protein Market Volume Share (%), by Country 2024 & 2032
- Figure 23: North America Recombinant Protein Market Revenue (Million), by Product 2024 & 2032
- Figure 24: North America Recombinant Protein Market Volume (K Unit), by Product 2024 & 2032
- Figure 25: North America Recombinant Protein Market Revenue Share (%), by Product 2024 & 2032
- Figure 26: North America Recombinant Protein Market Volume Share (%), by Product 2024 & 2032
- Figure 27: North America Recombinant Protein Market Revenue (Million), by Application 2024 & 2032
- Figure 28: North America Recombinant Protein Market Volume (K Unit), by Application 2024 & 2032
- Figure 29: North America Recombinant Protein Market Revenue Share (%), by Application 2024 & 2032
- Figure 30: North America Recombinant Protein Market Volume Share (%), by Application 2024 & 2032
- Figure 31: North America Recombinant Protein Market Revenue (Million), by Country 2024 & 2032
- Figure 32: North America Recombinant Protein Market Volume (K Unit), by Country 2024 & 2032
- Figure 33: North America Recombinant Protein Market Revenue Share (%), by Country 2024 & 2032
- Figure 34: North America Recombinant Protein Market Volume Share (%), by Country 2024 & 2032
- Figure 35: Europe Recombinant Protein Market Revenue (Million), by Product 2024 & 2032
- Figure 36: Europe Recombinant Protein Market Volume (K Unit), by Product 2024 & 2032
- Figure 37: Europe Recombinant Protein Market Revenue Share (%), by Product 2024 & 2032
- Figure 38: Europe Recombinant Protein Market Volume Share (%), by Product 2024 & 2032
- Figure 39: Europe Recombinant Protein Market Revenue (Million), by Application 2024 & 2032
- Figure 40: Europe Recombinant Protein Market Volume (K Unit), by Application 2024 & 2032
- Figure 41: Europe Recombinant Protein Market Revenue Share (%), by Application 2024 & 2032
- Figure 42: Europe Recombinant Protein Market Volume Share (%), by Application 2024 & 2032
- Figure 43: Europe Recombinant Protein Market Revenue (Million), by Country 2024 & 2032
- Figure 44: Europe Recombinant Protein Market Volume (K Unit), by Country 2024 & 2032
- Figure 45: Europe Recombinant Protein Market Revenue Share (%), by Country 2024 & 2032
- Figure 46: Europe Recombinant Protein Market Volume Share (%), by Country 2024 & 2032
- Figure 47: Asia Pacific Recombinant Protein Market Revenue (Million), by Product 2024 & 2032
- Figure 48: Asia Pacific Recombinant Protein Market Volume (K Unit), by Product 2024 & 2032
- Figure 49: Asia Pacific Recombinant Protein Market Revenue Share (%), by Product 2024 & 2032
- Figure 50: Asia Pacific Recombinant Protein Market Volume Share (%), by Product 2024 & 2032
- Figure 51: Asia Pacific Recombinant Protein Market Revenue (Million), by Application 2024 & 2032
- Figure 52: Asia Pacific Recombinant Protein Market Volume (K Unit), by Application 2024 & 2032
- Figure 53: Asia Pacific Recombinant Protein Market Revenue Share (%), by Application 2024 & 2032
- Figure 54: Asia Pacific Recombinant Protein Market Volume Share (%), by Application 2024 & 2032
- Figure 55: Asia Pacific Recombinant Protein Market Revenue (Million), by Country 2024 & 2032
- Figure 56: Asia Pacific Recombinant Protein Market Volume (K Unit), by Country 2024 & 2032
- Figure 57: Asia Pacific Recombinant Protein Market Revenue Share (%), by Country 2024 & 2032
- Figure 58: Asia Pacific Recombinant Protein Market Volume Share (%), by Country 2024 & 2032
- Figure 59: Middle East and Africa Recombinant Protein Market Revenue (Million), by Product 2024 & 2032
- Figure 60: Middle East and Africa Recombinant Protein Market Volume (K Unit), by Product 2024 & 2032
- Figure 61: Middle East and Africa Recombinant Protein Market Revenue Share (%), by Product 2024 & 2032
- Figure 62: Middle East and Africa Recombinant Protein Market Volume Share (%), by Product 2024 & 2032
- Figure 63: Middle East and Africa Recombinant Protein Market Revenue (Million), by Application 2024 & 2032
- Figure 64: Middle East and Africa Recombinant Protein Market Volume (K Unit), by Application 2024 & 2032
- Figure 65: Middle East and Africa Recombinant Protein Market Revenue Share (%), by Application 2024 & 2032
- Figure 66: Middle East and Africa Recombinant Protein Market Volume Share (%), by Application 2024 & 2032
- Figure 67: Middle East and Africa Recombinant Protein Market Revenue (Million), by Country 2024 & 2032
- Figure 68: Middle East and Africa Recombinant Protein Market Volume (K Unit), by Country 2024 & 2032
- Figure 69: Middle East and Africa Recombinant Protein Market Revenue Share (%), by Country 2024 & 2032
- Figure 70: Middle East and Africa Recombinant Protein Market Volume Share (%), by Country 2024 & 2032
- Figure 71: South America Recombinant Protein Market Revenue (Million), by Product 2024 & 2032
- Figure 72: South America Recombinant Protein Market Volume (K Unit), by Product 2024 & 2032
- Figure 73: South America Recombinant Protein Market Revenue Share (%), by Product 2024 & 2032
- Figure 74: South America Recombinant Protein Market Volume Share (%), by Product 2024 & 2032
- Figure 75: South America Recombinant Protein Market Revenue (Million), by Application 2024 & 2032
- Figure 76: South America Recombinant Protein Market Volume (K Unit), by Application 2024 & 2032
- Figure 77: South America Recombinant Protein Market Revenue Share (%), by Application 2024 & 2032
- Figure 78: South America Recombinant Protein Market Volume Share (%), by Application 2024 & 2032
- Figure 79: South America Recombinant Protein Market Revenue (Million), by Country 2024 & 2032
- Figure 80: South America Recombinant Protein Market Volume (K Unit), by Country 2024 & 2032
- Figure 81: South America Recombinant Protein Market Revenue Share (%), by Country 2024 & 2032
- Figure 82: South America Recombinant Protein Market Volume Share (%), by Country 2024 & 2032
List of Tables
- Table 1: Global Recombinant Protein Market Revenue Million Forecast, by Region 2019 & 2032
- Table 2: Global Recombinant Protein Market Volume K Unit Forecast, by Region 2019 & 2032
- Table 3: Global Recombinant Protein Market Revenue Million Forecast, by Product 2019 & 2032
- Table 4: Global Recombinant Protein Market Volume K Unit Forecast, by Product 2019 & 2032
- Table 5: Global Recombinant Protein Market Revenue Million Forecast, by Application 2019 & 2032
- Table 6: Global Recombinant Protein Market Volume K Unit Forecast, by Application 2019 & 2032
- Table 7: Global Recombinant Protein Market Revenue Million Forecast, by Region 2019 & 2032
- Table 8: Global Recombinant Protein Market Volume K Unit Forecast, by Region 2019 & 2032
- Table 9: Global Recombinant Protein Market Revenue Million Forecast, by Country 2019 & 2032
- Table 10: Global Recombinant Protein Market Volume K Unit Forecast, by Country 2019 & 2032
- Table 11: United States Recombinant Protein Market Revenue (Million) Forecast, by Application 2019 & 2032
- Table 12: United States Recombinant Protein Market Volume (K Unit) Forecast, by Application 2019 & 2032
- Table 13: Canada Recombinant Protein Market Revenue (Million) Forecast, by Application 2019 & 2032
- Table 14: Canada Recombinant Protein Market Volume (K Unit) Forecast, by Application 2019 & 2032
- Table 15: Mexico Recombinant Protein Market Revenue (Million) Forecast, by Application 2019 & 2032
- Table 16: Mexico Recombinant Protein Market Volume (K Unit) Forecast, by Application 2019 & 2032
- Table 17: Global Recombinant Protein Market Revenue Million Forecast, by Country 2019 & 2032
- Table 18: Global Recombinant Protein Market Volume K Unit Forecast, by Country 2019 & 2032
- Table 19: Germany Recombinant Protein Market Revenue (Million) Forecast, by Application 2019 & 2032
- Table 20: Germany Recombinant Protein Market Volume (K Unit) Forecast, by Application 2019 & 2032
- Table 21: United Kingdom Recombinant Protein Market Revenue (Million) Forecast, by Application 2019 & 2032
- Table 22: United Kingdom Recombinant Protein Market Volume (K Unit) Forecast, by Application 2019 & 2032
- Table 23: France Recombinant Protein Market Revenue (Million) Forecast, by Application 2019 & 2032
- Table 24: France Recombinant Protein Market Volume (K Unit) Forecast, by Application 2019 & 2032
- Table 25: Italy Recombinant Protein Market Revenue (Million) Forecast, by Application 2019 & 2032
- Table 26: Italy Recombinant Protein Market Volume (K Unit) Forecast, by Application 2019 & 2032
- Table 27: Spain Recombinant Protein Market Revenue (Million) Forecast, by Application 2019 & 2032
- Table 28: Spain Recombinant Protein Market Volume (K Unit) Forecast, by Application 2019 & 2032
- Table 29: Rest of Europe Recombinant Protein Market Revenue (Million) Forecast, by Application 2019 & 2032
- Table 30: Rest of Europe Recombinant Protein Market Volume (K Unit) Forecast, by Application 2019 & 2032
- Table 31: Global Recombinant Protein Market Revenue Million Forecast, by Country 2019 & 2032
- Table 32: Global Recombinant Protein Market Volume K Unit Forecast, by Country 2019 & 2032
- Table 33: China Recombinant Protein Market Revenue (Million) Forecast, by Application 2019 & 2032
- Table 34: China Recombinant Protein Market Volume (K Unit) Forecast, by Application 2019 & 2032
- Table 35: Japan Recombinant Protein Market Revenue (Million) Forecast, by Application 2019 & 2032
- Table 36: Japan Recombinant Protein Market Volume (K Unit) Forecast, by Application 2019 & 2032
- Table 37: India Recombinant Protein Market Revenue (Million) Forecast, by Application 2019 & 2032
- Table 38: India Recombinant Protein Market Volume (K Unit) Forecast, by Application 2019 & 2032
- Table 39: Australia Recombinant Protein Market Revenue (Million) Forecast, by Application 2019 & 2032
- Table 40: Australia Recombinant Protein Market Volume (K Unit) Forecast, by Application 2019 & 2032
- Table 41: South Korea Recombinant Protein Market Revenue (Million) Forecast, by Application 2019 & 2032
- Table 42: South Korea Recombinant Protein Market Volume (K Unit) Forecast, by Application 2019 & 2032
- Table 43: Rest of Asia Pacific Recombinant Protein Market Revenue (Million) Forecast, by Application 2019 & 2032
- Table 44: Rest of Asia Pacific Recombinant Protein Market Volume (K Unit) Forecast, by Application 2019 & 2032
- Table 45: Global Recombinant Protein Market Revenue Million Forecast, by Country 2019 & 2032
- Table 46: Global Recombinant Protein Market Volume K Unit Forecast, by Country 2019 & 2032
- Table 47: GCC Recombinant Protein Market Revenue (Million) Forecast, by Application 2019 & 2032
- Table 48: GCC Recombinant Protein Market Volume (K Unit) Forecast, by Application 2019 & 2032
- Table 49: South Africa Recombinant Protein Market Revenue (Million) Forecast, by Application 2019 & 2032
- Table 50: South Africa Recombinant Protein Market Volume (K Unit) Forecast, by Application 2019 & 2032
- Table 51: Rest of Middle East and Africa Recombinant Protein Market Revenue (Million) Forecast, by Application 2019 & 2032
- Table 52: Rest of Middle East and Africa Recombinant Protein Market Volume (K Unit) Forecast, by Application 2019 & 2032
- Table 53: Global Recombinant Protein Market Revenue Million Forecast, by Country 2019 & 2032
- Table 54: Global Recombinant Protein Market Volume K Unit Forecast, by Country 2019 & 2032
- Table 55: Brazil Recombinant Protein Market Revenue (Million) Forecast, by Application 2019 & 2032
- Table 56: Brazil Recombinant Protein Market Volume (K Unit) Forecast, by Application 2019 & 2032
- Table 57: Argentina Recombinant Protein Market Revenue (Million) Forecast, by Application 2019 & 2032
- Table 58: Argentina Recombinant Protein Market Volume (K Unit) Forecast, by Application 2019 & 2032
- Table 59: Rest of South America Recombinant Protein Market Revenue (Million) Forecast, by Application 2019 & 2032
- Table 60: Rest of South America Recombinant Protein Market Volume (K Unit) Forecast, by Application 2019 & 2032
- Table 61: Global Recombinant Protein Market Revenue Million Forecast, by Product 2019 & 2032
- Table 62: Global Recombinant Protein Market Volume K Unit Forecast, by Product 2019 & 2032
- Table 63: Global Recombinant Protein Market Revenue Million Forecast, by Application 2019 & 2032
- Table 64: Global Recombinant Protein Market Volume K Unit Forecast, by Application 2019 & 2032
- Table 65: Global Recombinant Protein Market Revenue Million Forecast, by Country 2019 & 2032
- Table 66: Global Recombinant Protein Market Volume K Unit Forecast, by Country 2019 & 2032
- Table 67: United States Recombinant Protein Market Revenue (Million) Forecast, by Application 2019 & 2032
- Table 68: United States Recombinant Protein Market Volume (K Unit) Forecast, by Application 2019 & 2032
- Table 69: Canada Recombinant Protein Market Revenue (Million) Forecast, by Application 2019 & 2032
- Table 70: Canada Recombinant Protein Market Volume (K Unit) Forecast, by Application 2019 & 2032
- Table 71: Mexico Recombinant Protein Market Revenue (Million) Forecast, by Application 2019 & 2032
- Table 72: Mexico Recombinant Protein Market Volume (K Unit) Forecast, by Application 2019 & 2032
- Table 73: Global Recombinant Protein Market Revenue Million Forecast, by Product 2019 & 2032
- Table 74: Global Recombinant Protein Market Volume K Unit Forecast, by Product 2019 & 2032
- Table 75: Global Recombinant Protein Market Revenue Million Forecast, by Application 2019 & 2032
- Table 76: Global Recombinant Protein Market Volume K Unit Forecast, by Application 2019 & 2032
- Table 77: Global Recombinant Protein Market Revenue Million Forecast, by Country 2019 & 2032
- Table 78: Global Recombinant Protein Market Volume K Unit Forecast, by Country 2019 & 2032
- Table 79: Germany Recombinant Protein Market Revenue (Million) Forecast, by Application 2019 & 2032
- Table 80: Germany Recombinant Protein Market Volume (K Unit) Forecast, by Application 2019 & 2032
- Table 81: United Kingdom Recombinant Protein Market Revenue (Million) Forecast, by Application 2019 & 2032
- Table 82: United Kingdom Recombinant Protein Market Volume (K Unit) Forecast, by Application 2019 & 2032
- Table 83: France Recombinant Protein Market Revenue (Million) Forecast, by Application 2019 & 2032
- Table 84: France Recombinant Protein Market Volume (K Unit) Forecast, by Application 2019 & 2032
- Table 85: Italy Recombinant Protein Market Revenue (Million) Forecast, by Application 2019 & 2032
- Table 86: Italy Recombinant Protein Market Volume (K Unit) Forecast, by Application 2019 & 2032
- Table 87: Spain Recombinant Protein Market Revenue (Million) Forecast, by Application 2019 & 2032
- Table 88: Spain Recombinant Protein Market Volume (K Unit) Forecast, by Application 2019 & 2032
- Table 89: Rest of Europe Recombinant Protein Market Revenue (Million) Forecast, by Application 2019 & 2032
- Table 90: Rest of Europe Recombinant Protein Market Volume (K Unit) Forecast, by Application 2019 & 2032
- Table 91: Global Recombinant Protein Market Revenue Million Forecast, by Product 2019 & 2032
- Table 92: Global Recombinant Protein Market Volume K Unit Forecast, by Product 2019 & 2032
- Table 93: Global Recombinant Protein Market Revenue Million Forecast, by Application 2019 & 2032
- Table 94: Global Recombinant Protein Market Volume K Unit Forecast, by Application 2019 & 2032
- Table 95: Global Recombinant Protein Market Revenue Million Forecast, by Country 2019 & 2032
- Table 96: Global Recombinant Protein Market Volume K Unit Forecast, by Country 2019 & 2032
- Table 97: China Recombinant Protein Market Revenue (Million) Forecast, by Application 2019 & 2032
- Table 98: China Recombinant Protein Market Volume (K Unit) Forecast, by Application 2019 & 2032
- Table 99: Japan Recombinant Protein Market Revenue (Million) Forecast, by Application 2019 & 2032
- Table 100: Japan Recombinant Protein Market Volume (K Unit) Forecast, by Application 2019 & 2032
- Table 101: India Recombinant Protein Market Revenue (Million) Forecast, by Application 2019 & 2032
- Table 102: India Recombinant Protein Market Volume (K Unit) Forecast, by Application 2019 & 2032
- Table 103: Australia Recombinant Protein Market Revenue (Million) Forecast, by Application 2019 & 2032
- Table 104: Australia Recombinant Protein Market Volume (K Unit) Forecast, by Application 2019 & 2032
- Table 105: South Korea Recombinant Protein Market Revenue (Million) Forecast, by Application 2019 & 2032
- Table 106: South Korea Recombinant Protein Market Volume (K Unit) Forecast, by Application 2019 & 2032
- Table 107: Rest of Asia Pacific Recombinant Protein Market Revenue (Million) Forecast, by Application 2019 & 2032
- Table 108: Rest of Asia Pacific Recombinant Protein Market Volume (K Unit) Forecast, by Application 2019 & 2032
- Table 109: Global Recombinant Protein Market Revenue Million Forecast, by Product 2019 & 2032
- Table 110: Global Recombinant Protein Market Volume K Unit Forecast, by Product 2019 & 2032
- Table 111: Global Recombinant Protein Market Revenue Million Forecast, by Application 2019 & 2032
- Table 112: Global Recombinant Protein Market Volume K Unit Forecast, by Application 2019 & 2032
- Table 113: Global Recombinant Protein Market Revenue Million Forecast, by Country 2019 & 2032
- Table 114: Global Recombinant Protein Market Volume K Unit Forecast, by Country 2019 & 2032
- Table 115: GCC Recombinant Protein Market Revenue (Million) Forecast, by Application 2019 & 2032
- Table 116: GCC Recombinant Protein Market Volume (K Unit) Forecast, by Application 2019 & 2032
- Table 117: South Africa Recombinant Protein Market Revenue (Million) Forecast, by Application 2019 & 2032
- Table 118: South Africa Recombinant Protein Market Volume (K Unit) Forecast, by Application 2019 & 2032
- Table 119: Rest of Middle East and Africa Recombinant Protein Market Revenue (Million) Forecast, by Application 2019 & 2032
- Table 120: Rest of Middle East and Africa Recombinant Protein Market Volume (K Unit) Forecast, by Application 2019 & 2032
- Table 121: Global Recombinant Protein Market Revenue Million Forecast, by Product 2019 & 2032
- Table 122: Global Recombinant Protein Market Volume K Unit Forecast, by Product 2019 & 2032
- Table 123: Global Recombinant Protein Market Revenue Million Forecast, by Application 2019 & 2032
- Table 124: Global Recombinant Protein Market Volume K Unit Forecast, by Application 2019 & 2032
- Table 125: Global Recombinant Protein Market Revenue Million Forecast, by Country 2019 & 2032
- Table 126: Global Recombinant Protein Market Volume K Unit Forecast, by Country 2019 & 2032
- Table 127: Brazil Recombinant Protein Market Revenue (Million) Forecast, by Application 2019 & 2032
- Table 128: Brazil Recombinant Protein Market Volume (K Unit) Forecast, by Application 2019 & 2032
- Table 129: Argentina Recombinant Protein Market Revenue (Million) Forecast, by Application 2019 & 2032
- Table 130: Argentina Recombinant Protein Market Volume (K Unit) Forecast, by Application 2019 & 2032
- Table 131: Rest of South America Recombinant Protein Market Revenue (Million) Forecast, by Application 2019 & 2032
- Table 132: Rest of South America Recombinant Protein Market Volume (K Unit) Forecast, by Application 2019 & 2032
Frequently Asked Questions
1. What is the projected Compound Annual Growth Rate (CAGR) of the Recombinant Protein Market?
The projected CAGR is approximately 7.91%.
2. Which companies are prominent players in the Recombinant Protein Market?
Key companies in the market include Sanofi SA, Novo Nordisk AS, Bio-Rad Laboratories Inc, Merck KGaA, Novartis AG, Amgen Inc, Thermo Fisher Scientific Inc, Eli Lilly and Company, Abbvie Inc, Novavax Inc, Pfizer Inc , GlaxoSmithKline PLC.
3. What are the main segments of the Recombinant Protein Market?
The market segments include Product, Application.
4. Can you provide details about the market size?
The market size is estimated to be USD 2.69 Million as of 2022.
5. What are some drivers contributing to market growth?
Increasing Expenditure on Research and Development; Growing Burden of Chronic Diseases; Rising Inclination toward Biologics and Biosimilars; Technological Advancements in Recombinant Products.
6. What are the notable trends driving market growth?
Antibody Segment is Expected to Witness a Significant Growth Over the Forecast Period..
7. Are there any restraints impacting market growth?
Expensive and Time-consuming Production Process.
8. Can you provide examples of recent developments in the market?
September 2022: the life science group Sartorius, through its French-listed subgroup Sartorius StedimBiotech, acquired AlbumedixLtd. Albumedix is one of the key players in the field of recombinant albumin-based solutions and is based in Nottingham, UK.
9. What pricing options are available for accessing the report?
Pricing options include single-user, multi-user, and enterprise licenses priced at USD 4750, USD 5250, and USD 8750 respectively.
10. Is the market size provided in terms of value or volume?
The market size is provided in terms of value, measured in Million and volume, measured in K Unit.
11. Are there any specific market keywords associated with the report?
Yes, the market keyword associated with the report is "Recombinant Protein Market," which aids in identifying and referencing the specific market segment covered.
12. How do I determine which pricing option suits my needs best?
The pricing options vary based on user requirements and access needs. Individual users may opt for single-user licenses, while businesses requiring broader access may choose multi-user or enterprise licenses for cost-effective access to the report.
13. Are there any additional resources or data provided in the Recombinant Protein Market report?
While the report offers comprehensive insights, it's advisable to review the specific contents or supplementary materials provided to ascertain if additional resources or data are available.
14. How can I stay updated on further developments or reports in the Recombinant Protein Market?
To stay informed about further developments, trends, and reports in the Recombinant Protein Market, consider subscribing to industry newsletters, following relevant companies and organizations, or regularly checking reputable industry news sources and publications.
Methodology
Step 1 - Identification of Relevant Samples Size from Population Database


Step 2 - Approaches for Defining Global Market Size (Value, Volume* & Price*)

Note*: In applicable scenarios
Step 3 - Data Sources
Primary Research
- Web Analytics
- Survey Reports
- Research Institute
- Latest Research Reports
- Opinion Leaders
Secondary Research
- Annual Reports
- White Paper
- Latest Press Release
- Industry Association
- Paid Database
- Investor Presentations

Step 4 - Data Triangulation
Involves using different sources of information in order to increase the validity of a study
These sources are likely to be stakeholders in a program - participants, other researchers, program staff, other community members, and so on.
Then we put all data in single framework & apply various statistical tools to find out the dynamic on the market.
During the analysis stage, feedback from the stakeholder groups would be compared to determine areas of agreement as well as areas of divergence
