

Key Insights
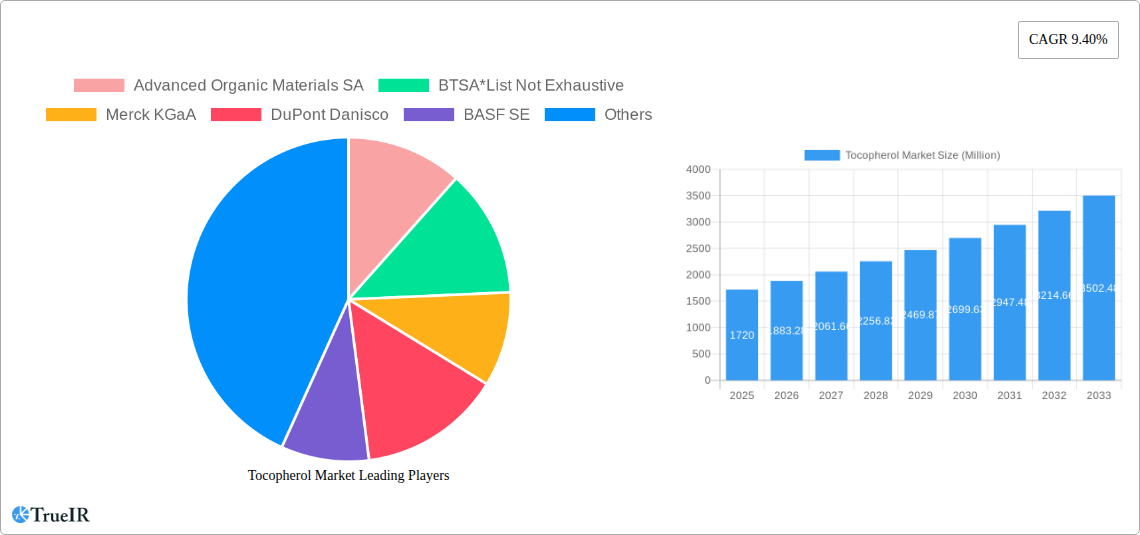
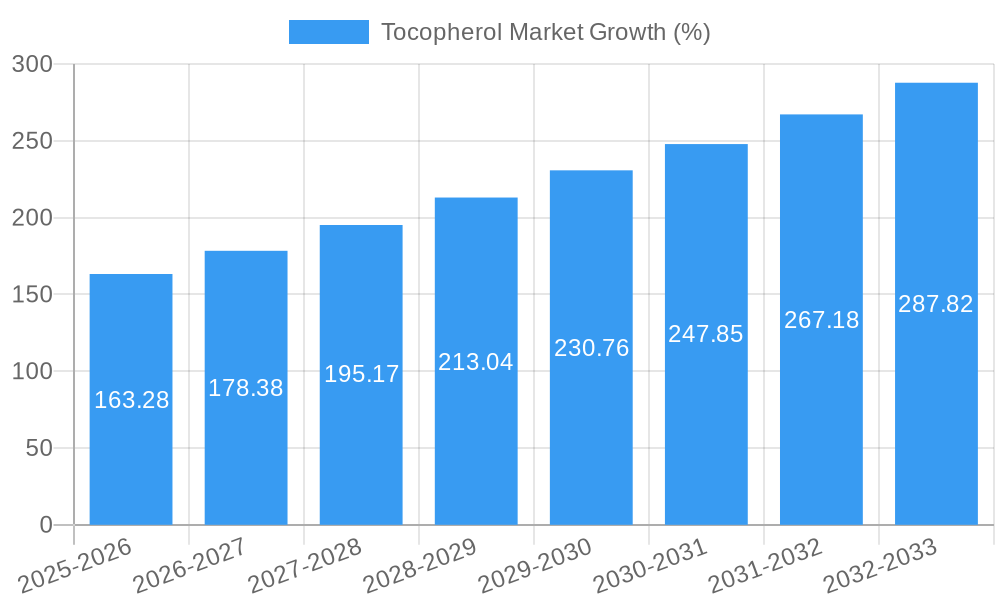
The global tocopherol market, valued at $1720 million in 2025, is projected to experience robust growth, driven by increasing demand across diverse sectors. The compound annual growth rate (CAGR) of 9.40% from 2025 to 2033 indicates a significant expansion, primarily fueled by the rising incorporation of tocopherols as natural antioxidants in food and beverage products. Consumer preference for clean-label ingredients and the growing awareness of the health benefits associated with tocopherol consumption are key market drivers. Furthermore, the expanding pharmaceutical and cosmetic industries are significantly contributing to market growth, with tocopherols utilized in various formulations for their antioxidant and skin-protective properties. Soybean oil remains the dominant source of tocopherols, followed by rapeseed and sunflower oils. However, the market is witnessing a trend towards diversification of sources to meet growing demand and ensure supply chain resilience. While the market faces restraints such as price fluctuations in raw materials and stringent regulatory compliance, the overall positive outlook for tocopherols is reinforced by ongoing research and development efforts focused on enhancing extraction methods and exploring novel applications.
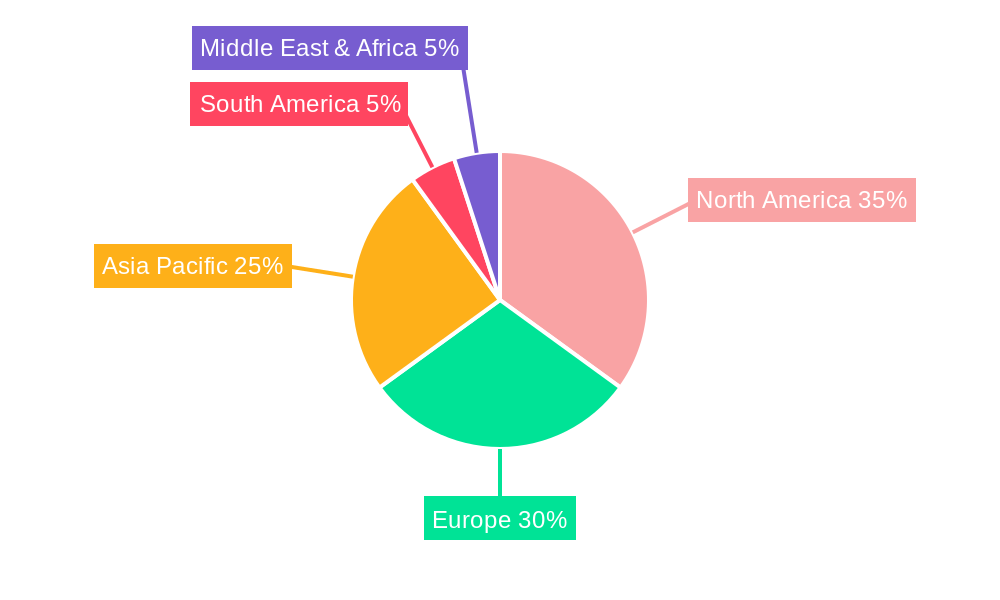
Geographic expansion is another crucial factor shaping the tocopherol market landscape. North America and Europe currently hold significant market shares due to established industries and high consumer demand. However, the Asia-Pacific region is projected to witness the fastest growth, driven by increasing disposable incomes, rising health consciousness, and burgeoning food and beverage industries in countries like China and India. This regional shift presents substantial growth opportunities for tocopherol producers and distributors. The competitive landscape comprises both established players like BASF SE, Cargill Inc., and Archer Daniels Midland, alongside emerging companies focusing on specialized applications and sustainable sourcing practices. This dynamic competitive environment is anticipated to accelerate innovation and further drive market growth throughout the forecast period.
Tocopherol Market: A Comprehensive Report (2019-2033)
This dynamic report provides a detailed analysis of the Tocopherol market, offering invaluable insights for businesses, investors, and researchers. With a comprehensive study period spanning 2019-2033, including a base year of 2025 and a forecast period of 2025-2033, this report leverages extensive market data to predict future trends and opportunities within this rapidly evolving sector. The estimated market size in 2025 is xx Million, poised for significant growth in the coming years. This in-depth analysis covers key market segments, leading players, and emerging trends, equipping you with the knowledge to navigate the complexities of the Tocopherol market effectively.
Tocopherol Market Structure & Competitive Landscape
The Tocopherol market exhibits a moderately concentrated structure, with several major players holding significant market share. In 2024, the top five companies accounted for approximately xx% of the global market. Key drivers of innovation include the development of sustainable sourcing methods, improved extraction techniques, and the expansion into novel applications. Regulatory changes, particularly those related to food safety and labeling, exert a considerable influence on market dynamics. Product substitutes, such as synthetic antioxidants, pose a competitive challenge, necessitating continuous innovation and value-added product development.
The market is segmented by source (Soybean Oil, Rapeseed Oil, Corn Oil, Sunflower Oil) and application (Food and Beverage, Feed, Pharmaceuticals, Cosmetics, Others). M&A activity has been relatively moderate in recent years, with xx major transactions recorded between 2019 and 2024, primarily focused on expanding geographic reach and product portfolios. This trend is expected to continue, driven by the desire for greater market share and diversification.
- Market Concentration: Top 5 players hold xx% market share (2024).
- Innovation Drivers: Sustainable sourcing, improved extraction, novel applications.
- Regulatory Impacts: Food safety regulations, labeling requirements.
- Product Substitutes: Synthetic antioxidants.
- End-User Segmentation: Significant growth across Food & Beverage, Pharmaceuticals, and Cosmetics sectors.
- M&A Trends: xx major transactions (2019-2024), focused on expansion and diversification.
Tocopherol Market Trends & Opportunities
The Tocopherol market is witnessing robust growth, driven by increasing consumer awareness of health and wellness, coupled with the rising demand for natural and organic products. The market is expected to experience a CAGR of xx% during the forecast period (2025-2033). Technological advancements, particularly in extraction and purification processes, are contributing to improved product quality and cost-effectiveness. Consumer preferences are shifting towards sustainably sourced and ethically produced Tocopherol, creating opportunities for companies adopting eco-friendly practices. Competitive dynamics are characterized by intense rivalry among major players, leading to price competition and product differentiation strategies. Market penetration rates are particularly high in developed economies but are experiencing significant growth in emerging markets.
Dominant Markets & Segments in Tocopherol Market
The Food and Beverage segment is currently the dominant application area for Tocopherol, driven by its widespread use as a preservative and antioxidant. The Soybean Oil segment holds the largest share within the source category, owing to its abundance and cost-effectiveness. Geographically, North America and Europe currently represent the largest markets, though Asia-Pacific is exhibiting the fastest growth rate.
- Key Growth Drivers (North America): Established infrastructure, strong regulatory frameworks.
- Key Growth Drivers (Asia-Pacific): Rapidly expanding food and beverage industry, rising disposable incomes.
- Dominant Segment: Food & Beverage application, Soybean Oil source.
- Fastest-Growing Region: Asia-Pacific.
Tocopherol Market Product Analysis
Recent innovations in Tocopherol production focus on improving purity, enhancing stability, and developing customized formulations for specific applications. Technological advancements in extraction and purification processes have led to higher yields and reduced production costs. These improvements, combined with the growing demand for natural and organic ingredients, are driving the adoption of Tocopherol across various industries. The competitive advantage lies in offering high-quality, sustainably sourced products tailored to specific customer needs.
Key Drivers, Barriers & Challenges in Tocopherol Market
Key Drivers: Growing demand for natural antioxidants, increasing health consciousness, expansion of applications in cosmetics and pharmaceuticals. Government initiatives promoting sustainable agriculture further propel market growth.
Challenges: Fluctuations in raw material prices, stringent regulatory requirements, and intense competition from synthetic alternatives pose significant challenges. Supply chain disruptions can impact production and lead to price volatility.
Growth Drivers in the Tocopherol Market Market
The rising demand for natural antioxidants in food and beverage applications remains a primary driver. Technological advancements in extraction methods are making production more efficient and cost-effective. Favorable government regulations supporting the use of natural ingredients further stimulate market growth.
Challenges Impacting Tocopherol Market Growth
Fluctuations in raw material prices (soybean, rapeseed, etc.) significantly impact profitability. Strict regulatory frameworks concerning food safety and labeling add to production costs. Intense competition from synthetic antioxidants and other preservatives presents a considerable challenge.
Key Players Shaping the Tocopherol Market Market
- Advanced Organic Materials SA
- BTSA*List Not Exhaustive
- Merck KGaA
- DuPont Danisco
- BASF SE
- Archer Daniels Midland
- Cargill Inc
- Royal DSM
- Kerry Group
- Evonik Industries
- Nippon Oil & Fat
Significant Tocopherol Market Industry Milestones
- 2021: Launch of a new sustainable sourcing initiative by BASF SE.
- 2022: Merck KGaA announces expansion of its Tocopherol production facility.
- 2023: Acquisition of a smaller Tocopherol producer by Cargill Inc. (Specific details not available for public information)
Future Outlook for Tocopherol Market Market
The Tocopherol market is poised for sustained growth, driven by increasing health consciousness, expanding applications, and ongoing innovation in production technologies. Strategic partnerships, focusing on sustainable sourcing and product differentiation, will play a key role in shaping future market dynamics. The market holds significant potential for growth in emerging economies with rising disposable incomes and changing dietary habits.
Tocopherol Market Segmentation
-
1. Source
- 1.1. Soybean Oil
- 1.2. Rapeseed Oil
- 1.3. Corn Oil
- 1.4. Sunflower Oil
-
2. Application
- 2.1. Food and Beverage
- 2.2. Feed
- 2.3. Pharmaceuticals
- 2.4. Cosmetics
- 2.5. Others
Tocopherol Market Segmentation By Geography
-
1. North America
- 1.1. United States
- 1.2. Canada
- 1.3. Mexico
- 1.4. Rest of North America
-
2. Europe
- 2.1. Germany
- 2.2. United Kingdom
- 2.3. France
- 2.4. Russia
- 2.5. Spain
- 2.6. Rest of Europe
-
3. Asia Pacific
- 3.1. India
- 3.2. Australia
- 3.3. China
- 3.4. Japan
- 3.5. Rest of Asia Pacific
-
4. South America
- 4.1. Brazil
- 4.2. Argentina
- 4.3. Rest of South America
- 5. Middle East
-
6. United Arab Emirates
- 6.1. Saudi Africa
- 6.2. Rest of Middle East
Tocopherol Market REPORT HIGHLIGHTS
| Aspects | Details |
|---|---|
| Study Period | 2019-2033 |
| Base Year | 2024 |
| Estimated Year | 2025 |
| Forecast Period | 2025-2033 |
| Historical Period | 2019-2024 |
| Growth Rate | CAGR of 9.40% from 2019-2033 |
| Segmentation |
|
Table of Contents
- 1. Introduction
- 1.1. Research Scope
- 1.2. Market Segmentation
- 1.3. Research Methodology
- 1.4. Definitions and Assumptions
- 2. Executive Summary
- 2.1. Introduction
- 3. Market Dynamics
- 3.1. Introduction
- 3.2. Market Drivers
- 3.2.1. Increasing Demand for Organic Plant Proteins; Increasing Application of Pea Protein in Food and Beverages
- 3.3. Market Restrains
- 3.3.1. Presence of Alternative protein sources
- 3.4. Market Trends
- 3.4.1. Strong Demand from Feed Industry
- 4. Market Factor Analysis
- 4.1. Porters Five Forces
- 4.2. Supply/Value Chain
- 4.3. PESTEL analysis
- 4.4. Market Entropy
- 4.5. Patent/Trademark Analysis
- 5. Global Tocopherol Market Analysis, Insights and Forecast, 2019-2031
- 5.1. Market Analysis, Insights and Forecast - by Source
- 5.1.1. Soybean Oil
- 5.1.2. Rapeseed Oil
- 5.1.3. Corn Oil
- 5.1.4. Sunflower Oil
- 5.2. Market Analysis, Insights and Forecast - by Application
- 5.2.1. Food and Beverage
- 5.2.2. Feed
- 5.2.3. Pharmaceuticals
- 5.2.4. Cosmetics
- 5.2.5. Others
- 5.3. Market Analysis, Insights and Forecast - by Region
- 5.3.1. North America
- 5.3.2. Europe
- 5.3.3. Asia Pacific
- 5.3.4. South America
- 5.3.5. Middle East
- 5.3.6. United Arab Emirates
- 5.1. Market Analysis, Insights and Forecast - by Source
- 6. North America Tocopherol Market Analysis, Insights and Forecast, 2019-2031
- 6.1. Market Analysis, Insights and Forecast - by Source
- 6.1.1. Soybean Oil
- 6.1.2. Rapeseed Oil
- 6.1.3. Corn Oil
- 6.1.4. Sunflower Oil
- 6.2. Market Analysis, Insights and Forecast - by Application
- 6.2.1. Food and Beverage
- 6.2.2. Feed
- 6.2.3. Pharmaceuticals
- 6.2.4. Cosmetics
- 6.2.5. Others
- 6.1. Market Analysis, Insights and Forecast - by Source
- 7. Europe Tocopherol Market Analysis, Insights and Forecast, 2019-2031
- 7.1. Market Analysis, Insights and Forecast - by Source
- 7.1.1. Soybean Oil
- 7.1.2. Rapeseed Oil
- 7.1.3. Corn Oil
- 7.1.4. Sunflower Oil
- 7.2. Market Analysis, Insights and Forecast - by Application
- 7.2.1. Food and Beverage
- 7.2.2. Feed
- 7.2.3. Pharmaceuticals
- 7.2.4. Cosmetics
- 7.2.5. Others
- 7.1. Market Analysis, Insights and Forecast - by Source
- 8. Asia Pacific Tocopherol Market Analysis, Insights and Forecast, 2019-2031
- 8.1. Market Analysis, Insights and Forecast - by Source
- 8.1.1. Soybean Oil
- 8.1.2. Rapeseed Oil
- 8.1.3. Corn Oil
- 8.1.4. Sunflower Oil
- 8.2. Market Analysis, Insights and Forecast - by Application
- 8.2.1. Food and Beverage
- 8.2.2. Feed
- 8.2.3. Pharmaceuticals
- 8.2.4. Cosmetics
- 8.2.5. Others
- 8.1. Market Analysis, Insights and Forecast - by Source
- 9. South America Tocopherol Market Analysis, Insights and Forecast, 2019-2031
- 9.1. Market Analysis, Insights and Forecast - by Source
- 9.1.1. Soybean Oil
- 9.1.2. Rapeseed Oil
- 9.1.3. Corn Oil
- 9.1.4. Sunflower Oil
- 9.2. Market Analysis, Insights and Forecast - by Application
- 9.2.1. Food and Beverage
- 9.2.2. Feed
- 9.2.3. Pharmaceuticals
- 9.2.4. Cosmetics
- 9.2.5. Others
- 9.1. Market Analysis, Insights and Forecast - by Source
- 10. Middle East Tocopherol Market Analysis, Insights and Forecast, 2019-2031
- 10.1. Market Analysis, Insights and Forecast - by Source
- 10.1.1. Soybean Oil
- 10.1.2. Rapeseed Oil
- 10.1.3. Corn Oil
- 10.1.4. Sunflower Oil
- 10.2. Market Analysis, Insights and Forecast - by Application
- 10.2.1. Food and Beverage
- 10.2.2. Feed
- 10.2.3. Pharmaceuticals
- 10.2.4. Cosmetics
- 10.2.5. Others
- 10.1. Market Analysis, Insights and Forecast - by Source
- 11. United Arab Emirates Tocopherol Market Analysis, Insights and Forecast, 2019-2031
- 11.1. Market Analysis, Insights and Forecast - by Source
- 11.1.1. Soybean Oil
- 11.1.2. Rapeseed Oil
- 11.1.3. Corn Oil
- 11.1.4. Sunflower Oil
- 11.2. Market Analysis, Insights and Forecast - by Application
- 11.2.1. Food and Beverage
- 11.2.2. Feed
- 11.2.3. Pharmaceuticals
- 11.2.4. Cosmetics
- 11.2.5. Others
- 11.1. Market Analysis, Insights and Forecast - by Source
- 12. North America Tocopherol Market Analysis, Insights and Forecast, 2019-2031
- 12.1. Market Analysis, Insights and Forecast - By Country/Sub-region
- 12.1.1 United States
- 12.1.2 Canada
- 12.1.3 Mexico
- 12.1.4 Rest of North America
- 13. Europe Tocopherol Market Analysis, Insights and Forecast, 2019-2031
- 13.1. Market Analysis, Insights and Forecast - By Country/Sub-region
- 13.1.1 Germany
- 13.1.2 United Kingdom
- 13.1.3 France
- 13.1.4 Russia
- 13.1.5 Spain
- 13.1.6 Rest of Europe
- 14. Asia Pacific Tocopherol Market Analysis, Insights and Forecast, 2019-2031
- 14.1. Market Analysis, Insights and Forecast - By Country/Sub-region
- 14.1.1 India
- 14.1.2 Australia
- 14.1.3 China
- 14.1.4 Japan
- 14.1.5 Rest of Asia Pacific
- 15. South America Tocopherol Market Analysis, Insights and Forecast, 2019-2031
- 15.1. Market Analysis, Insights and Forecast - By Country/Sub-region
- 15.1.1 Brazil
- 15.1.2 Argentina
- 15.1.3 Rest of South America
- 16. Middle East Tocopherol Market Analysis, Insights and Forecast, 2019-2031
- 16.1. Market Analysis, Insights and Forecast - By Country/Sub-region
- 16.1.1 Middle East
- 16.1.2 Africa
- 17. United Arab Emirates Tocopherol Market Analysis, Insights and Forecast, 2019-2031
- 17.1. Market Analysis, Insights and Forecast - By Country/Sub-region
- 17.1.1 Saudi Africa
- 17.1.2 Rest of Middle East
- 18. Competitive Analysis
- 18.1. Global Market Share Analysis 2024
- 18.2. Company Profiles
- 18.2.1 Advanced Organic Materials SA
- 18.2.1.1. Overview
- 18.2.1.2. Products
- 18.2.1.3. SWOT Analysis
- 18.2.1.4. Recent Developments
- 18.2.1.5. Financials (Based on Availability)
- 18.2.2 BTSA*List Not Exhaustive
- 18.2.2.1. Overview
- 18.2.2.2. Products
- 18.2.2.3. SWOT Analysis
- 18.2.2.4. Recent Developments
- 18.2.2.5. Financials (Based on Availability)
- 18.2.3 Merck KGaA
- 18.2.3.1. Overview
- 18.2.3.2. Products
- 18.2.3.3. SWOT Analysis
- 18.2.3.4. Recent Developments
- 18.2.3.5. Financials (Based on Availability)
- 18.2.4 DuPont Danisco
- 18.2.4.1. Overview
- 18.2.4.2. Products
- 18.2.4.3. SWOT Analysis
- 18.2.4.4. Recent Developments
- 18.2.4.5. Financials (Based on Availability)
- 18.2.5 BASF SE
- 18.2.5.1. Overview
- 18.2.5.2. Products
- 18.2.5.3. SWOT Analysis
- 18.2.5.4. Recent Developments
- 18.2.5.5. Financials (Based on Availability)
- 18.2.6 Archer Daniels Midland
- 18.2.6.1. Overview
- 18.2.6.2. Products
- 18.2.6.3. SWOT Analysis
- 18.2.6.4. Recent Developments
- 18.2.6.5. Financials (Based on Availability)
- 18.2.7 Cargill Inc
- 18.2.7.1. Overview
- 18.2.7.2. Products
- 18.2.7.3. SWOT Analysis
- 18.2.7.4. Recent Developments
- 18.2.7.5. Financials (Based on Availability)
- 18.2.8 Royal DSM
- 18.2.8.1. Overview
- 18.2.8.2. Products
- 18.2.8.3. SWOT Analysis
- 18.2.8.4. Recent Developments
- 18.2.8.5. Financials (Based on Availability)
- 18.2.9 Kerry Group
- 18.2.9.1. Overview
- 18.2.9.2. Products
- 18.2.9.3. SWOT Analysis
- 18.2.9.4. Recent Developments
- 18.2.9.5. Financials (Based on Availability)
- 18.2.10 Evonik Industries
- 18.2.10.1. Overview
- 18.2.10.2. Products
- 18.2.10.3. SWOT Analysis
- 18.2.10.4. Recent Developments
- 18.2.10.5. Financials (Based on Availability)
- 18.2.11 Nippon Oil & Fat
- 18.2.11.1. Overview
- 18.2.11.2. Products
- 18.2.11.3. SWOT Analysis
- 18.2.11.4. Recent Developments
- 18.2.11.5. Financials (Based on Availability)
- 18.2.1 Advanced Organic Materials SA
List of Figures
- Figure 1: Global Tocopherol Market Revenue Breakdown (Million, %) by Region 2024 & 2032
- Figure 2: Global Tocopherol Market Volume Breakdown (K Tons, %) by Region 2024 & 2032
- Figure 3: North America Tocopherol Market Revenue (Million), by Country 2024 & 2032
- Figure 4: North America Tocopherol Market Volume (K Tons), by Country 2024 & 2032
- Figure 5: North America Tocopherol Market Revenue Share (%), by Country 2024 & 2032
- Figure 6: North America Tocopherol Market Volume Share (%), by Country 2024 & 2032
- Figure 7: Europe Tocopherol Market Revenue (Million), by Country 2024 & 2032
- Figure 8: Europe Tocopherol Market Volume (K Tons), by Country 2024 & 2032
- Figure 9: Europe Tocopherol Market Revenue Share (%), by Country 2024 & 2032
- Figure 10: Europe Tocopherol Market Volume Share (%), by Country 2024 & 2032
- Figure 11: Asia Pacific Tocopherol Market Revenue (Million), by Country 2024 & 2032
- Figure 12: Asia Pacific Tocopherol Market Volume (K Tons), by Country 2024 & 2032
- Figure 13: Asia Pacific Tocopherol Market Revenue Share (%), by Country 2024 & 2032
- Figure 14: Asia Pacific Tocopherol Market Volume Share (%), by Country 2024 & 2032
- Figure 15: South America Tocopherol Market Revenue (Million), by Country 2024 & 2032
- Figure 16: South America Tocopherol Market Volume (K Tons), by Country 2024 & 2032
- Figure 17: South America Tocopherol Market Revenue Share (%), by Country 2024 & 2032
- Figure 18: South America Tocopherol Market Volume Share (%), by Country 2024 & 2032
- Figure 19: Middle East Tocopherol Market Revenue (Million), by Country 2024 & 2032
- Figure 20: Middle East Tocopherol Market Volume (K Tons), by Country 2024 & 2032
- Figure 21: Middle East Tocopherol Market Revenue Share (%), by Country 2024 & 2032
- Figure 22: Middle East Tocopherol Market Volume Share (%), by Country 2024 & 2032
- Figure 23: United Arab Emirates Tocopherol Market Revenue (Million), by Country 2024 & 2032
- Figure 24: United Arab Emirates Tocopherol Market Volume (K Tons), by Country 2024 & 2032
- Figure 25: United Arab Emirates Tocopherol Market Revenue Share (%), by Country 2024 & 2032
- Figure 26: United Arab Emirates Tocopherol Market Volume Share (%), by Country 2024 & 2032
- Figure 27: North America Tocopherol Market Revenue (Million), by Source 2024 & 2032
- Figure 28: North America Tocopherol Market Volume (K Tons), by Source 2024 & 2032
- Figure 29: North America Tocopherol Market Revenue Share (%), by Source 2024 & 2032
- Figure 30: North America Tocopherol Market Volume Share (%), by Source 2024 & 2032
- Figure 31: North America Tocopherol Market Revenue (Million), by Application 2024 & 2032
- Figure 32: North America Tocopherol Market Volume (K Tons), by Application 2024 & 2032
- Figure 33: North America Tocopherol Market Revenue Share (%), by Application 2024 & 2032
- Figure 34: North America Tocopherol Market Volume Share (%), by Application 2024 & 2032
- Figure 35: North America Tocopherol Market Revenue (Million), by Country 2024 & 2032
- Figure 36: North America Tocopherol Market Volume (K Tons), by Country 2024 & 2032
- Figure 37: North America Tocopherol Market Revenue Share (%), by Country 2024 & 2032
- Figure 38: North America Tocopherol Market Volume Share (%), by Country 2024 & 2032
- Figure 39: Europe Tocopherol Market Revenue (Million), by Source 2024 & 2032
- Figure 40: Europe Tocopherol Market Volume (K Tons), by Source 2024 & 2032
- Figure 41: Europe Tocopherol Market Revenue Share (%), by Source 2024 & 2032
- Figure 42: Europe Tocopherol Market Volume Share (%), by Source 2024 & 2032
- Figure 43: Europe Tocopherol Market Revenue (Million), by Application 2024 & 2032
- Figure 44: Europe Tocopherol Market Volume (K Tons), by Application 2024 & 2032
- Figure 45: Europe Tocopherol Market Revenue Share (%), by Application 2024 & 2032
- Figure 46: Europe Tocopherol Market Volume Share (%), by Application 2024 & 2032
- Figure 47: Europe Tocopherol Market Revenue (Million), by Country 2024 & 2032
- Figure 48: Europe Tocopherol Market Volume (K Tons), by Country 2024 & 2032
- Figure 49: Europe Tocopherol Market Revenue Share (%), by Country 2024 & 2032
- Figure 50: Europe Tocopherol Market Volume Share (%), by Country 2024 & 2032
- Figure 51: Asia Pacific Tocopherol Market Revenue (Million), by Source 2024 & 2032
- Figure 52: Asia Pacific Tocopherol Market Volume (K Tons), by Source 2024 & 2032
- Figure 53: Asia Pacific Tocopherol Market Revenue Share (%), by Source 2024 & 2032
- Figure 54: Asia Pacific Tocopherol Market Volume Share (%), by Source 2024 & 2032
- Figure 55: Asia Pacific Tocopherol Market Revenue (Million), by Application 2024 & 2032
- Figure 56: Asia Pacific Tocopherol Market Volume (K Tons), by Application 2024 & 2032
- Figure 57: Asia Pacific Tocopherol Market Revenue Share (%), by Application 2024 & 2032
- Figure 58: Asia Pacific Tocopherol Market Volume Share (%), by Application 2024 & 2032
- Figure 59: Asia Pacific Tocopherol Market Revenue (Million), by Country 2024 & 2032
- Figure 60: Asia Pacific Tocopherol Market Volume (K Tons), by Country 2024 & 2032
- Figure 61: Asia Pacific Tocopherol Market Revenue Share (%), by Country 2024 & 2032
- Figure 62: Asia Pacific Tocopherol Market Volume Share (%), by Country 2024 & 2032
- Figure 63: South America Tocopherol Market Revenue (Million), by Source 2024 & 2032
- Figure 64: South America Tocopherol Market Volume (K Tons), by Source 2024 & 2032
- Figure 65: South America Tocopherol Market Revenue Share (%), by Source 2024 & 2032
- Figure 66: South America Tocopherol Market Volume Share (%), by Source 2024 & 2032
- Figure 67: South America Tocopherol Market Revenue (Million), by Application 2024 & 2032
- Figure 68: South America Tocopherol Market Volume (K Tons), by Application 2024 & 2032
- Figure 69: South America Tocopherol Market Revenue Share (%), by Application 2024 & 2032
- Figure 70: South America Tocopherol Market Volume Share (%), by Application 2024 & 2032
- Figure 71: South America Tocopherol Market Revenue (Million), by Country 2024 & 2032
- Figure 72: South America Tocopherol Market Volume (K Tons), by Country 2024 & 2032
- Figure 73: South America Tocopherol Market Revenue Share (%), by Country 2024 & 2032
- Figure 74: South America Tocopherol Market Volume Share (%), by Country 2024 & 2032
- Figure 75: Middle East Tocopherol Market Revenue (Million), by Source 2024 & 2032
- Figure 76: Middle East Tocopherol Market Volume (K Tons), by Source 2024 & 2032
- Figure 77: Middle East Tocopherol Market Revenue Share (%), by Source 2024 & 2032
- Figure 78: Middle East Tocopherol Market Volume Share (%), by Source 2024 & 2032
- Figure 79: Middle East Tocopherol Market Revenue (Million), by Application 2024 & 2032
- Figure 80: Middle East Tocopherol Market Volume (K Tons), by Application 2024 & 2032
- Figure 81: Middle East Tocopherol Market Revenue Share (%), by Application 2024 & 2032
- Figure 82: Middle East Tocopherol Market Volume Share (%), by Application 2024 & 2032
- Figure 83: Middle East Tocopherol Market Revenue (Million), by Country 2024 & 2032
- Figure 84: Middle East Tocopherol Market Volume (K Tons), by Country 2024 & 2032
- Figure 85: Middle East Tocopherol Market Revenue Share (%), by Country 2024 & 2032
- Figure 86: Middle East Tocopherol Market Volume Share (%), by Country 2024 & 2032
- Figure 87: United Arab Emirates Tocopherol Market Revenue (Million), by Source 2024 & 2032
- Figure 88: United Arab Emirates Tocopherol Market Volume (K Tons), by Source 2024 & 2032
- Figure 89: United Arab Emirates Tocopherol Market Revenue Share (%), by Source 2024 & 2032
- Figure 90: United Arab Emirates Tocopherol Market Volume Share (%), by Source 2024 & 2032
- Figure 91: United Arab Emirates Tocopherol Market Revenue (Million), by Application 2024 & 2032
- Figure 92: United Arab Emirates Tocopherol Market Volume (K Tons), by Application 2024 & 2032
- Figure 93: United Arab Emirates Tocopherol Market Revenue Share (%), by Application 2024 & 2032
- Figure 94: United Arab Emirates Tocopherol Market Volume Share (%), by Application 2024 & 2032
- Figure 95: United Arab Emirates Tocopherol Market Revenue (Million), by Country 2024 & 2032
- Figure 96: United Arab Emirates Tocopherol Market Volume (K Tons), by Country 2024 & 2032
- Figure 97: United Arab Emirates Tocopherol Market Revenue Share (%), by Country 2024 & 2032
- Figure 98: United Arab Emirates Tocopherol Market Volume Share (%), by Country 2024 & 2032
List of Tables
- Table 1: Global Tocopherol Market Revenue Million Forecast, by Region 2019 & 2032
- Table 2: Global Tocopherol Market Volume K Tons Forecast, by Region 2019 & 2032
- Table 3: Global Tocopherol Market Revenue Million Forecast, by Source 2019 & 2032
- Table 4: Global Tocopherol Market Volume K Tons Forecast, by Source 2019 & 2032
- Table 5: Global Tocopherol Market Revenue Million Forecast, by Application 2019 & 2032
- Table 6: Global Tocopherol Market Volume K Tons Forecast, by Application 2019 & 2032
- Table 7: Global Tocopherol Market Revenue Million Forecast, by Region 2019 & 2032
- Table 8: Global Tocopherol Market Volume K Tons Forecast, by Region 2019 & 2032
- Table 9: Global Tocopherol Market Revenue Million Forecast, by Country 2019 & 2032
- Table 10: Global Tocopherol Market Volume K Tons Forecast, by Country 2019 & 2032
- Table 11: United States Tocopherol Market Revenue (Million) Forecast, by Application 2019 & 2032
- Table 12: United States Tocopherol Market Volume (K Tons) Forecast, by Application 2019 & 2032
- Table 13: Canada Tocopherol Market Revenue (Million) Forecast, by Application 2019 & 2032
- Table 14: Canada Tocopherol Market Volume (K Tons) Forecast, by Application 2019 & 2032
- Table 15: Mexico Tocopherol Market Revenue (Million) Forecast, by Application 2019 & 2032
- Table 16: Mexico Tocopherol Market Volume (K Tons) Forecast, by Application 2019 & 2032
- Table 17: Rest of North America Tocopherol Market Revenue (Million) Forecast, by Application 2019 & 2032
- Table 18: Rest of North America Tocopherol Market Volume (K Tons) Forecast, by Application 2019 & 2032
- Table 19: Global Tocopherol Market Revenue Million Forecast, by Country 2019 & 2032
- Table 20: Global Tocopherol Market Volume K Tons Forecast, by Country 2019 & 2032
- Table 21: Germany Tocopherol Market Revenue (Million) Forecast, by Application 2019 & 2032
- Table 22: Germany Tocopherol Market Volume (K Tons) Forecast, by Application 2019 & 2032
- Table 23: United Kingdom Tocopherol Market Revenue (Million) Forecast, by Application 2019 & 2032
- Table 24: United Kingdom Tocopherol Market Volume (K Tons) Forecast, by Application 2019 & 2032
- Table 25: France Tocopherol Market Revenue (Million) Forecast, by Application 2019 & 2032
- Table 26: France Tocopherol Market Volume (K Tons) Forecast, by Application 2019 & 2032
- Table 27: Russia Tocopherol Market Revenue (Million) Forecast, by Application 2019 & 2032
- Table 28: Russia Tocopherol Market Volume (K Tons) Forecast, by Application 2019 & 2032
- Table 29: Spain Tocopherol Market Revenue (Million) Forecast, by Application 2019 & 2032
- Table 30: Spain Tocopherol Market Volume (K Tons) Forecast, by Application 2019 & 2032
- Table 31: Rest of Europe Tocopherol Market Revenue (Million) Forecast, by Application 2019 & 2032
- Table 32: Rest of Europe Tocopherol Market Volume (K Tons) Forecast, by Application 2019 & 2032
- Table 33: Global Tocopherol Market Revenue Million Forecast, by Country 2019 & 2032
- Table 34: Global Tocopherol Market Volume K Tons Forecast, by Country 2019 & 2032
- Table 35: India Tocopherol Market Revenue (Million) Forecast, by Application 2019 & 2032
- Table 36: India Tocopherol Market Volume (K Tons) Forecast, by Application 2019 & 2032
- Table 37: Australia Tocopherol Market Revenue (Million) Forecast, by Application 2019 & 2032
- Table 38: Australia Tocopherol Market Volume (K Tons) Forecast, by Application 2019 & 2032
- Table 39: China Tocopherol Market Revenue (Million) Forecast, by Application 2019 & 2032
- Table 40: China Tocopherol Market Volume (K Tons) Forecast, by Application 2019 & 2032
- Table 41: Japan Tocopherol Market Revenue (Million) Forecast, by Application 2019 & 2032
- Table 42: Japan Tocopherol Market Volume (K Tons) Forecast, by Application 2019 & 2032
- Table 43: Rest of Asia Pacific Tocopherol Market Revenue (Million) Forecast, by Application 2019 & 2032
- Table 44: Rest of Asia Pacific Tocopherol Market Volume (K Tons) Forecast, by Application 2019 & 2032
- Table 45: Global Tocopherol Market Revenue Million Forecast, by Country 2019 & 2032
- Table 46: Global Tocopherol Market Volume K Tons Forecast, by Country 2019 & 2032
- Table 47: Brazil Tocopherol Market Revenue (Million) Forecast, by Application 2019 & 2032
- Table 48: Brazil Tocopherol Market Volume (K Tons) Forecast, by Application 2019 & 2032
- Table 49: Argentina Tocopherol Market Revenue (Million) Forecast, by Application 2019 & 2032
- Table 50: Argentina Tocopherol Market Volume (K Tons) Forecast, by Application 2019 & 2032
- Table 51: Rest of South America Tocopherol Market Revenue (Million) Forecast, by Application 2019 & 2032
- Table 52: Rest of South America Tocopherol Market Volume (K Tons) Forecast, by Application 2019 & 2032
- Table 53: Global Tocopherol Market Revenue Million Forecast, by Country 2019 & 2032
- Table 54: Global Tocopherol Market Volume K Tons Forecast, by Country 2019 & 2032
- Table 55: Middle East Tocopherol Market Revenue (Million) Forecast, by Application 2019 & 2032
- Table 56: Middle East Tocopherol Market Volume (K Tons) Forecast, by Application 2019 & 2032
- Table 57: Africa Tocopherol Market Revenue (Million) Forecast, by Application 2019 & 2032
- Table 58: Africa Tocopherol Market Volume (K Tons) Forecast, by Application 2019 & 2032
- Table 59: Global Tocopherol Market Revenue Million Forecast, by Country 2019 & 2032
- Table 60: Global Tocopherol Market Volume K Tons Forecast, by Country 2019 & 2032
- Table 61: Saudi Africa Tocopherol Market Revenue (Million) Forecast, by Application 2019 & 2032
- Table 62: Saudi Africa Tocopherol Market Volume (K Tons) Forecast, by Application 2019 & 2032
- Table 63: Rest of Middle East Tocopherol Market Revenue (Million) Forecast, by Application 2019 & 2032
- Table 64: Rest of Middle East Tocopherol Market Volume (K Tons) Forecast, by Application 2019 & 2032
- Table 65: Global Tocopherol Market Revenue Million Forecast, by Source 2019 & 2032
- Table 66: Global Tocopherol Market Volume K Tons Forecast, by Source 2019 & 2032
- Table 67: Global Tocopherol Market Revenue Million Forecast, by Application 2019 & 2032
- Table 68: Global Tocopherol Market Volume K Tons Forecast, by Application 2019 & 2032
- Table 69: Global Tocopherol Market Revenue Million Forecast, by Country 2019 & 2032
- Table 70: Global Tocopherol Market Volume K Tons Forecast, by Country 2019 & 2032
- Table 71: United States Tocopherol Market Revenue (Million) Forecast, by Application 2019 & 2032
- Table 72: United States Tocopherol Market Volume (K Tons) Forecast, by Application 2019 & 2032
- Table 73: Canada Tocopherol Market Revenue (Million) Forecast, by Application 2019 & 2032
- Table 74: Canada Tocopherol Market Volume (K Tons) Forecast, by Application 2019 & 2032
- Table 75: Mexico Tocopherol Market Revenue (Million) Forecast, by Application 2019 & 2032
- Table 76: Mexico Tocopherol Market Volume (K Tons) Forecast, by Application 2019 & 2032
- Table 77: Rest of North America Tocopherol Market Revenue (Million) Forecast, by Application 2019 & 2032
- Table 78: Rest of North America Tocopherol Market Volume (K Tons) Forecast, by Application 2019 & 2032
- Table 79: Global Tocopherol Market Revenue Million Forecast, by Source 2019 & 2032
- Table 80: Global Tocopherol Market Volume K Tons Forecast, by Source 2019 & 2032
- Table 81: Global Tocopherol Market Revenue Million Forecast, by Application 2019 & 2032
- Table 82: Global Tocopherol Market Volume K Tons Forecast, by Application 2019 & 2032
- Table 83: Global Tocopherol Market Revenue Million Forecast, by Country 2019 & 2032
- Table 84: Global Tocopherol Market Volume K Tons Forecast, by Country 2019 & 2032
- Table 85: Germany Tocopherol Market Revenue (Million) Forecast, by Application 2019 & 2032
- Table 86: Germany Tocopherol Market Volume (K Tons) Forecast, by Application 2019 & 2032
- Table 87: United Kingdom Tocopherol Market Revenue (Million) Forecast, by Application 2019 & 2032
- Table 88: United Kingdom Tocopherol Market Volume (K Tons) Forecast, by Application 2019 & 2032
- Table 89: France Tocopherol Market Revenue (Million) Forecast, by Application 2019 & 2032
- Table 90: France Tocopherol Market Volume (K Tons) Forecast, by Application 2019 & 2032
- Table 91: Russia Tocopherol Market Revenue (Million) Forecast, by Application 2019 & 2032
- Table 92: Russia Tocopherol Market Volume (K Tons) Forecast, by Application 2019 & 2032
- Table 93: Spain Tocopherol Market Revenue (Million) Forecast, by Application 2019 & 2032
- Table 94: Spain Tocopherol Market Volume (K Tons) Forecast, by Application 2019 & 2032
- Table 95: Rest of Europe Tocopherol Market Revenue (Million) Forecast, by Application 2019 & 2032
- Table 96: Rest of Europe Tocopherol Market Volume (K Tons) Forecast, by Application 2019 & 2032
- Table 97: Global Tocopherol Market Revenue Million Forecast, by Source 2019 & 2032
- Table 98: Global Tocopherol Market Volume K Tons Forecast, by Source 2019 & 2032
- Table 99: Global Tocopherol Market Revenue Million Forecast, by Application 2019 & 2032
- Table 100: Global Tocopherol Market Volume K Tons Forecast, by Application 2019 & 2032
- Table 101: Global Tocopherol Market Revenue Million Forecast, by Country 2019 & 2032
- Table 102: Global Tocopherol Market Volume K Tons Forecast, by Country 2019 & 2032
- Table 103: India Tocopherol Market Revenue (Million) Forecast, by Application 2019 & 2032
- Table 104: India Tocopherol Market Volume (K Tons) Forecast, by Application 2019 & 2032
- Table 105: Australia Tocopherol Market Revenue (Million) Forecast, by Application 2019 & 2032
- Table 106: Australia Tocopherol Market Volume (K Tons) Forecast, by Application 2019 & 2032
- Table 107: China Tocopherol Market Revenue (Million) Forecast, by Application 2019 & 2032
- Table 108: China Tocopherol Market Volume (K Tons) Forecast, by Application 2019 & 2032
- Table 109: Japan Tocopherol Market Revenue (Million) Forecast, by Application 2019 & 2032
- Table 110: Japan Tocopherol Market Volume (K Tons) Forecast, by Application 2019 & 2032
- Table 111: Rest of Asia Pacific Tocopherol Market Revenue (Million) Forecast, by Application 2019 & 2032
- Table 112: Rest of Asia Pacific Tocopherol Market Volume (K Tons) Forecast, by Application 2019 & 2032
- Table 113: Global Tocopherol Market Revenue Million Forecast, by Source 2019 & 2032
- Table 114: Global Tocopherol Market Volume K Tons Forecast, by Source 2019 & 2032
- Table 115: Global Tocopherol Market Revenue Million Forecast, by Application 2019 & 2032
- Table 116: Global Tocopherol Market Volume K Tons Forecast, by Application 2019 & 2032
- Table 117: Global Tocopherol Market Revenue Million Forecast, by Country 2019 & 2032
- Table 118: Global Tocopherol Market Volume K Tons Forecast, by Country 2019 & 2032
- Table 119: Brazil Tocopherol Market Revenue (Million) Forecast, by Application 2019 & 2032
- Table 120: Brazil Tocopherol Market Volume (K Tons) Forecast, by Application 2019 & 2032
- Table 121: Argentina Tocopherol Market Revenue (Million) Forecast, by Application 2019 & 2032
- Table 122: Argentina Tocopherol Market Volume (K Tons) Forecast, by Application 2019 & 2032
- Table 123: Rest of South America Tocopherol Market Revenue (Million) Forecast, by Application 2019 & 2032
- Table 124: Rest of South America Tocopherol Market Volume (K Tons) Forecast, by Application 2019 & 2032
- Table 125: Global Tocopherol Market Revenue Million Forecast, by Source 2019 & 2032
- Table 126: Global Tocopherol Market Volume K Tons Forecast, by Source 2019 & 2032
- Table 127: Global Tocopherol Market Revenue Million Forecast, by Application 2019 & 2032
- Table 128: Global Tocopherol Market Volume K Tons Forecast, by Application 2019 & 2032
- Table 129: Global Tocopherol Market Revenue Million Forecast, by Country 2019 & 2032
- Table 130: Global Tocopherol Market Volume K Tons Forecast, by Country 2019 & 2032
- Table 131: Global Tocopherol Market Revenue Million Forecast, by Source 2019 & 2032
- Table 132: Global Tocopherol Market Volume K Tons Forecast, by Source 2019 & 2032
- Table 133: Global Tocopherol Market Revenue Million Forecast, by Application 2019 & 2032
- Table 134: Global Tocopherol Market Volume K Tons Forecast, by Application 2019 & 2032
- Table 135: Global Tocopherol Market Revenue Million Forecast, by Country 2019 & 2032
- Table 136: Global Tocopherol Market Volume K Tons Forecast, by Country 2019 & 2032
- Table 137: Saudi Africa Tocopherol Market Revenue (Million) Forecast, by Application 2019 & 2032
- Table 138: Saudi Africa Tocopherol Market Volume (K Tons) Forecast, by Application 2019 & 2032
- Table 139: Rest of Middle East Tocopherol Market Revenue (Million) Forecast, by Application 2019 & 2032
- Table 140: Rest of Middle East Tocopherol Market Volume (K Tons) Forecast, by Application 2019 & 2032
Frequently Asked Questions
1. What is the projected Compound Annual Growth Rate (CAGR) of the Tocopherol Market?
The projected CAGR is approximately 9.40%.
2. Which companies are prominent players in the Tocopherol Market?
Key companies in the market include Advanced Organic Materials SA, BTSA*List Not Exhaustive, Merck KGaA, DuPont Danisco, BASF SE, Archer Daniels Midland, Cargill Inc, Royal DSM, Kerry Group , Evonik Industries, Nippon Oil & Fat.
3. What are the main segments of the Tocopherol Market?
The market segments include Source, Application.
4. Can you provide details about the market size?
The market size is estimated to be USD 1720 Million as of 2022.
5. What are some drivers contributing to market growth?
Increasing Demand for Organic Plant Proteins; Increasing Application of Pea Protein in Food and Beverages.
6. What are the notable trends driving market growth?
Strong Demand from Feed Industry.
7. Are there any restraints impacting market growth?
Presence of Alternative protein sources.
8. Can you provide examples of recent developments in the market?
N/A
9. What pricing options are available for accessing the report?
Pricing options include single-user, multi-user, and enterprise licenses priced at USD 4750, USD 5250, and USD 8750 respectively.
10. Is the market size provided in terms of value or volume?
The market size is provided in terms of value, measured in Million and volume, measured in K Tons.
11. Are there any specific market keywords associated with the report?
Yes, the market keyword associated with the report is "Tocopherol Market," which aids in identifying and referencing the specific market segment covered.
12. How do I determine which pricing option suits my needs best?
The pricing options vary based on user requirements and access needs. Individual users may opt for single-user licenses, while businesses requiring broader access may choose multi-user or enterprise licenses for cost-effective access to the report.
13. Are there any additional resources or data provided in the Tocopherol Market report?
While the report offers comprehensive insights, it's advisable to review the specific contents or supplementary materials provided to ascertain if additional resources or data are available.
14. How can I stay updated on further developments or reports in the Tocopherol Market?
To stay informed about further developments, trends, and reports in the Tocopherol Market, consider subscribing to industry newsletters, following relevant companies and organizations, or regularly checking reputable industry news sources and publications.
Methodology
Step 1 - Identification of Relevant Samples Size from Population Database


Step 2 - Approaches for Defining Global Market Size (Value, Volume* & Price*)

Note*: In applicable scenarios
Step 3 - Data Sources
Primary Research
- Web Analytics
- Survey Reports
- Research Institute
- Latest Research Reports
- Opinion Leaders
Secondary Research
- Annual Reports
- White Paper
- Latest Press Release
- Industry Association
- Paid Database
- Investor Presentations

Step 4 - Data Triangulation
Involves using different sources of information in order to increase the validity of a study
These sources are likely to be stakeholders in a program - participants, other researchers, program staff, other community members, and so on.
Then we put all data in single framework & apply various statistical tools to find out the dynamic on the market.
During the analysis stage, feedback from the stakeholder groups would be compared to determine areas of agreement as well as areas of divergence
