

Key Insights
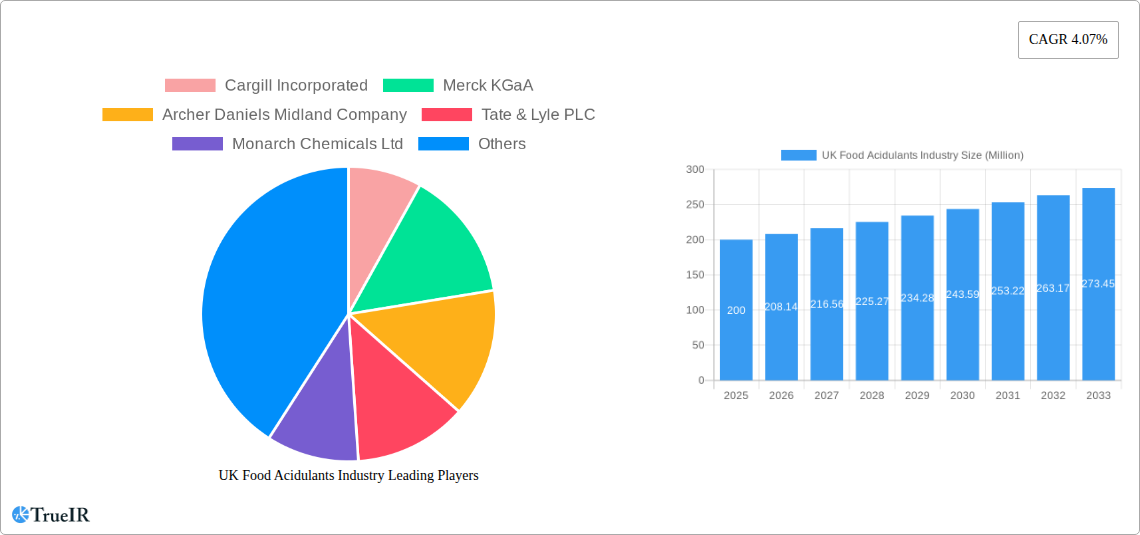
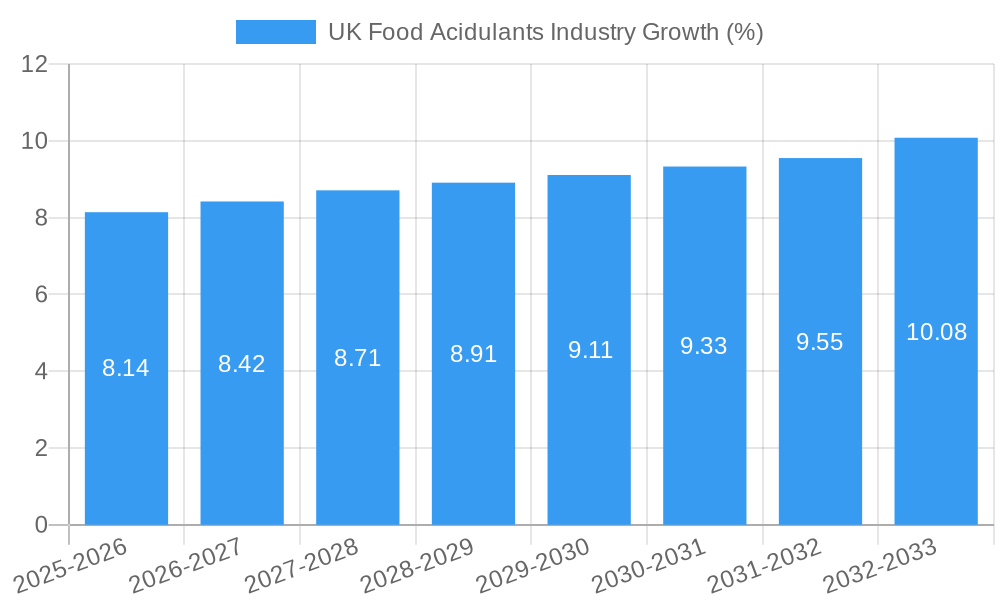
The UK food acidulants market, valued at approximately £200 million in 2025, is projected to experience steady growth, with a compound annual growth rate (CAGR) of 4.07% from 2025 to 2033. This expansion is driven by several key factors. The increasing demand for processed foods, particularly within the bakery, confectionery, and beverage sectors, fuels the need for acidulants to enhance flavor, extend shelf life, and control pH levels. Consumer preference for healthier food options also contributes to growth, as acidulants are used in low-sugar and low-sodium products. Furthermore, the rising popularity of functional foods and beverages incorporating natural and organic ingredients is stimulating demand for natural acidulants like citric acid and lactic acid, potentially outpacing the growth of traditional phosphoric acid. However, fluctuating raw material prices and stringent regulatory requirements regarding food additives pose challenges to market growth.
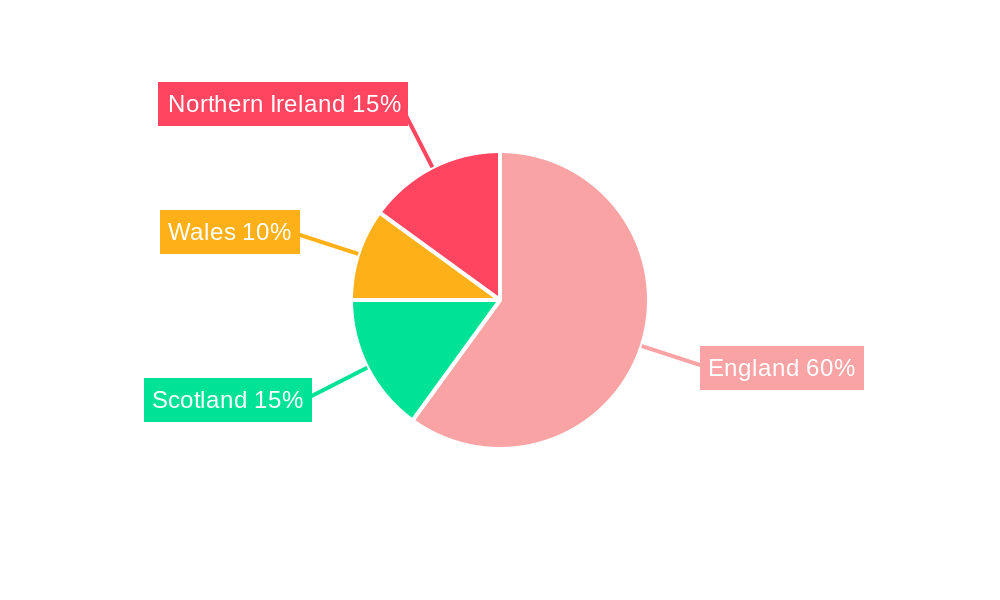
Segment-wise, citric acid dominates the market, followed by phosphoric acid and lactic acid. Beverages represent the largest application segment, driven by the widespread use of acidulants in carbonated drinks, juices, and functional beverages. The dairy and frozen products sector also shows significant growth potential, primarily due to the increasing demand for shelf-stable dairy products. Regional analysis shows the market is concentrated across England, Wales, Scotland, and Northern Ireland, with England holding the largest share due to its higher population density and robust food processing industry. Major players such as Cargill, Merck KGaA, and ADM are actively competing in this market, focused on innovation and expansion into new market segments and geographic regions to maintain a competitive edge. The projected market size in 2033 is estimated to be around £280 million, based on the provided CAGR.
UK Food Acidulants Industry Market Report: 2019-2033
This comprehensive report provides a detailed analysis of the UK food acidulants market, offering invaluable insights for industry stakeholders, investors, and researchers. Covering the period from 2019 to 2033, with a focus on 2025, this study unveils the market's structure, competitive landscape, dominant segments, and future growth trajectory. The report leverages extensive data and analysis to provide a clear understanding of the market's dynamics and potential. The UK food acidulants market is projected to reach a value of £xx Million by 2033, demonstrating substantial growth opportunities.
UK Food Acidulants Industry Market Structure & Competitive Landscape
The UK food acidulants market exhibits a moderately concentrated structure, with key players like Cargill Incorporated, Merck KGaA, Archer Daniels Midland Company, Tate & Lyle PLC, and Brenntag AG holding significant market share. The market’s concentration ratio (CR4) is estimated at xx%, indicating a relatively competitive environment. Innovation is a key driver, with companies constantly developing new acidulants and applications to cater to evolving consumer preferences and regulatory changes. Stringent food safety regulations significantly impact market dynamics, favoring companies with robust quality control systems. Product substitution, mainly between different types of acidulants (e.g., citric acid vs. lactic acid), is also an influencing factor. The market is segmented based on acidulant type (citric acid, phosphoric acid, lactic acid, and others) and application (beverages, dairy, bakery, meat, confectionery, and others). Mergers and acquisitions (M&A) activity has been moderate in recent years, with xx M&A deals recorded between 2019 and 2024, primarily driven by expansion strategies and the consolidation of market share.
- Market Concentration: CR4 estimated at xx%
- Innovation Drivers: New product development, improved functionality, sustainable sourcing
- Regulatory Impacts: Stringent food safety standards, labeling requirements, and additive regulations
- Product Substitutes: Interchangeability of acidulants based on application needs.
- End-User Segmentation: Beverages, dairy, bakery, meat, confectionery, etc.
- M&A Trends: xx deals recorded between 2019-2024, driven by growth strategies and consolidation.
UK Food Acidulants Industry Market Trends & Opportunities
The UK food acidulants market is experiencing robust growth, driven by factors including rising demand for processed foods, changing consumer preferences towards healthier and natural ingredients, and expanding applications in various food and beverage sectors. The market size is estimated at £xx Million in 2025 and is projected to grow at a CAGR of xx% from 2025 to 2033, reaching £xx Million. Technological advancements, such as the development of efficient production processes and the introduction of novel acidulants with enhanced functionalities, are further boosting market expansion. Increased consumer demand for clean-label products is also influencing the market, with manufacturers focusing on sourcing acidulants from natural sources. The competitive landscape is characterized by intense competition, with key players focusing on innovation, strategic partnerships, and expansion to maintain their market positions. Market penetration rates vary significantly across different segments, with beverages and dairy products representing the largest segments.
Dominant Markets & Segments in UK Food Acidulants Industry
The UK food acidulants market is dominated by the beverages segment, driven by high demand for carbonated soft drinks, juices, and other beverages where acidulants are essential for taste and preservation. The dairy and frozen products segment is also a significant contributor, with applications in cheese, yogurt, ice cream and other dairy-based products. Citric acid remains the leading acidulant type, accounting for a market share of xx%, owing to its versatility, cost-effectiveness, and widespread acceptance across diverse food applications. London and the South East are considered leading geographical areas.
- Key Growth Drivers for Beverages: Rising demand for carbonated drinks, juices, and functional beverages.
- Key Growth Drivers for Dairy & Frozen Products: Increased consumption of dairy products, growing popularity of frozen desserts.
- Key Growth Drivers for Citric Acid: Versatility, cost-effectiveness, and natural origin.
- Geographic Dominance: London and the South East.
UK Food Acidulants Industry Product Analysis
The UK food acidulants market showcases a diverse range of products, including citric acid, lactic acid, phosphoric acid, and other specialized acidulants. Continuous innovation focuses on enhancing product functionalities, such as improving taste, extending shelf life, and ensuring safety. Key competitive advantages lie in developing acidulants with natural origins, cleaner labels, and improved sustainability. Technological advancements involve optimizing production processes to reduce costs and environmental impact. This trend supports consumer preference for clean-label and eco-friendly products, thus contributing to market expansion.
Key Drivers, Barriers & Challenges in UK Food Acidulants Industry
Key Drivers: Growing demand for processed and convenience foods, increasing health consciousness leading to a demand for natural preservatives, expansion of the food and beverage industry, and evolving consumer preferences for various flavors and textures.
Challenges: Stringent regulations related to food additives, fluctuating raw material prices, growing competition from alternative preservatives, and potential supply chain disruptions. Increased regulatory scrutiny might lead to higher compliance costs, potentially impacting smaller players. The market faces challenges from changing consumer preferences towards natural preservatives and potentially stricter import regulations due to Brexit.
Growth Drivers in the UK Food Acidulants Industry Market
The UK food acidulants market is primarily driven by the rising demand for processed foods and beverages. The increasing health consciousness among consumers is also a major growth driver, as manufacturers seek natural and healthier alternatives for traditional preservatives. Technological advancements leading to improved production efficiency and the development of novel acidulants contribute to the market’s expansion.
Challenges Impacting UK Food Acidulants Industry Growth
Fluctuating raw material prices pose a significant challenge, impacting profitability and potentially causing price volatility in the market. Supply chain disruptions due to geopolitical factors or logistical issues can create shortages and impact production. Furthermore, stringent regulations related to food additives necessitate substantial investment in compliance, placing significant pressure on smaller players.
Key Players Shaping the UK Food Acidulants Industry Market
- Cargill Incorporated
- Merck KGaA
- Archer Daniels Midland Company
- Tate & Lyle PLC
- Monarch Chemicals Ltd
- Brenntag AG
- H Plus Limited
Significant UK Food Acidulants Industry Industry Milestones
- 2020: Introduction of a new, sustainably sourced citric acid by Cargill.
- 2021: Tate & Lyle launched a new range of clean-label acidulants.
- 2022: Merck KGaA invested in a new production facility for lactic acid.
- 2023: A significant merger between two smaller acidulant producers. (Specific details unavailable).
Future Outlook for UK Food Acidulants Industry Market
The UK food acidulants market is poised for continued growth, driven by factors such as the growing demand for convenience foods, expansion of the food service industry, and increasing demand for clean-label and natural products. Strategic opportunities exist for companies that can develop innovative products, optimize supply chains, and comply with stringent regulatory requirements. The market presents significant potential for growth and investment in the coming years.
UK Food Acidulants Industry Segmentation
-
1. Type
- 1.1. Citric Acid
- 1.2. Phosphoric Acid
- 1.3. Lactic Acid
- 1.4. Other Types
-
2. Application
- 2.1. Beverages
- 2.2. Dairy and Frozen Products
- 2.3. Bakery
- 2.4. Meat Industry
- 2.5. Confectionery
- 2.6. Other Applications
UK Food Acidulants Industry Segmentation By Geography
-
1. North America
- 1.1. United States
- 1.2. Canada
- 1.3. Mexico
-
2. South America
- 2.1. Brazil
- 2.2. Argentina
- 2.3. Rest of South America
-
3. Europe
- 3.1. United Kingdom
- 3.2. Germany
- 3.3. France
- 3.4. Italy
- 3.5. Spain
- 3.6. Russia
- 3.7. Benelux
- 3.8. Nordics
- 3.9. Rest of Europe
-
4. Middle East & Africa
- 4.1. Turkey
- 4.2. Israel
- 4.3. GCC
- 4.4. North Africa
- 4.5. South Africa
- 4.6. Rest of Middle East & Africa
-
5. Asia Pacific
- 5.1. China
- 5.2. India
- 5.3. Japan
- 5.4. South Korea
- 5.5. ASEAN
- 5.6. Oceania
- 5.7. Rest of Asia Pacific
UK Food Acidulants Industry REPORT HIGHLIGHTS
| Aspects | Details |
|---|---|
| Study Period | 2019-2033 |
| Base Year | 2024 |
| Estimated Year | 2025 |
| Forecast Period | 2025-2033 |
| Historical Period | 2019-2024 |
| Growth Rate | CAGR of 4.07% from 2019-2033 |
| Segmentation |
|
Table of Contents
- 1. Introduction
- 1.1. Research Scope
- 1.2. Market Segmentation
- 1.3. Research Methodology
- 1.4. Definitions and Assumptions
- 2. Executive Summary
- 2.1. Introduction
- 3. Market Dynamics
- 3.1. Introduction
- 3.2. Market Drivers
- 3.2.1. Rising Application in Dietary Supplements
- 3.3. Market Restrains
- 3.3.1. Increasing prevalence of hydroglycemia
- 3.4. Market Trends
- 3.4.1. Phosphoric Acid Promises Growth in Future
- 4. Market Factor Analysis
- 4.1. Porters Five Forces
- 4.2. Supply/Value Chain
- 4.3. PESTEL analysis
- 4.4. Market Entropy
- 4.5. Patent/Trademark Analysis
- 5. Global UK Food Acidulants Industry Analysis, Insights and Forecast, 2019-2031
- 5.1. Market Analysis, Insights and Forecast - by Type
- 5.1.1. Citric Acid
- 5.1.2. Phosphoric Acid
- 5.1.3. Lactic Acid
- 5.1.4. Other Types
- 5.2. Market Analysis, Insights and Forecast - by Application
- 5.2.1. Beverages
- 5.2.2. Dairy and Frozen Products
- 5.2.3. Bakery
- 5.2.4. Meat Industry
- 5.2.5. Confectionery
- 5.2.6. Other Applications
- 5.3. Market Analysis, Insights and Forecast - by Region
- 5.3.1. North America
- 5.3.2. South America
- 5.3.3. Europe
- 5.3.4. Middle East & Africa
- 5.3.5. Asia Pacific
- 5.1. Market Analysis, Insights and Forecast - by Type
- 6. North America UK Food Acidulants Industry Analysis, Insights and Forecast, 2019-2031
- 6.1. Market Analysis, Insights and Forecast - by Type
- 6.1.1. Citric Acid
- 6.1.2. Phosphoric Acid
- 6.1.3. Lactic Acid
- 6.1.4. Other Types
- 6.2. Market Analysis, Insights and Forecast - by Application
- 6.2.1. Beverages
- 6.2.2. Dairy and Frozen Products
- 6.2.3. Bakery
- 6.2.4. Meat Industry
- 6.2.5. Confectionery
- 6.2.6. Other Applications
- 6.1. Market Analysis, Insights and Forecast - by Type
- 7. South America UK Food Acidulants Industry Analysis, Insights and Forecast, 2019-2031
- 7.1. Market Analysis, Insights and Forecast - by Type
- 7.1.1. Citric Acid
- 7.1.2. Phosphoric Acid
- 7.1.3. Lactic Acid
- 7.1.4. Other Types
- 7.2. Market Analysis, Insights and Forecast - by Application
- 7.2.1. Beverages
- 7.2.2. Dairy and Frozen Products
- 7.2.3. Bakery
- 7.2.4. Meat Industry
- 7.2.5. Confectionery
- 7.2.6. Other Applications
- 7.1. Market Analysis, Insights and Forecast - by Type
- 8. Europe UK Food Acidulants Industry Analysis, Insights and Forecast, 2019-2031
- 8.1. Market Analysis, Insights and Forecast - by Type
- 8.1.1. Citric Acid
- 8.1.2. Phosphoric Acid
- 8.1.3. Lactic Acid
- 8.1.4. Other Types
- 8.2. Market Analysis, Insights and Forecast - by Application
- 8.2.1. Beverages
- 8.2.2. Dairy and Frozen Products
- 8.2.3. Bakery
- 8.2.4. Meat Industry
- 8.2.5. Confectionery
- 8.2.6. Other Applications
- 8.1. Market Analysis, Insights and Forecast - by Type
- 9. Middle East & Africa UK Food Acidulants Industry Analysis, Insights and Forecast, 2019-2031
- 9.1. Market Analysis, Insights and Forecast - by Type
- 9.1.1. Citric Acid
- 9.1.2. Phosphoric Acid
- 9.1.3. Lactic Acid
- 9.1.4. Other Types
- 9.2. Market Analysis, Insights and Forecast - by Application
- 9.2.1. Beverages
- 9.2.2. Dairy and Frozen Products
- 9.2.3. Bakery
- 9.2.4. Meat Industry
- 9.2.5. Confectionery
- 9.2.6. Other Applications
- 9.1. Market Analysis, Insights and Forecast - by Type
- 10. Asia Pacific UK Food Acidulants Industry Analysis, Insights and Forecast, 2019-2031
- 10.1. Market Analysis, Insights and Forecast - by Type
- 10.1.1. Citric Acid
- 10.1.2. Phosphoric Acid
- 10.1.3. Lactic Acid
- 10.1.4. Other Types
- 10.2. Market Analysis, Insights and Forecast - by Application
- 10.2.1. Beverages
- 10.2.2. Dairy and Frozen Products
- 10.2.3. Bakery
- 10.2.4. Meat Industry
- 10.2.5. Confectionery
- 10.2.6. Other Applications
- 10.1. Market Analysis, Insights and Forecast - by Type
- 11. England UK Food Acidulants Industry Analysis, Insights and Forecast, 2019-2031
- 12. Wales UK Food Acidulants Industry Analysis, Insights and Forecast, 2019-2031
- 13. Scotland UK Food Acidulants Industry Analysis, Insights and Forecast, 2019-2031
- 14. Northern UK Food Acidulants Industry Analysis, Insights and Forecast, 2019-2031
- 15. Ireland UK Food Acidulants Industry Analysis, Insights and Forecast, 2019-2031
- 16. Competitive Analysis
- 16.1. Global Market Share Analysis 2024
- 16.2. Company Profiles
- 16.2.1 Cargill Incorporated
- 16.2.1.1. Overview
- 16.2.1.2. Products
- 16.2.1.3. SWOT Analysis
- 16.2.1.4. Recent Developments
- 16.2.1.5. Financials (Based on Availability)
- 16.2.2 Merck KGaA
- 16.2.2.1. Overview
- 16.2.2.2. Products
- 16.2.2.3. SWOT Analysis
- 16.2.2.4. Recent Developments
- 16.2.2.5. Financials (Based on Availability)
- 16.2.3 Archer Daniels Midland Company
- 16.2.3.1. Overview
- 16.2.3.2. Products
- 16.2.3.3. SWOT Analysis
- 16.2.3.4. Recent Developments
- 16.2.3.5. Financials (Based on Availability)
- 16.2.4 Tate & Lyle PLC
- 16.2.4.1. Overview
- 16.2.4.2. Products
- 16.2.4.3. SWOT Analysis
- 16.2.4.4. Recent Developments
- 16.2.4.5. Financials (Based on Availability)
- 16.2.5 Monarch Chemicals Ltd
- 16.2.5.1. Overview
- 16.2.5.2. Products
- 16.2.5.3. SWOT Analysis
- 16.2.5.4. Recent Developments
- 16.2.5.5. Financials (Based on Availability)
- 16.2.6 Brenntag AG
- 16.2.6.1. Overview
- 16.2.6.2. Products
- 16.2.6.3. SWOT Analysis
- 16.2.6.4. Recent Developments
- 16.2.6.5. Financials (Based on Availability)
- 16.2.7 H Plus Limited*List Not Exhaustive
- 16.2.7.1. Overview
- 16.2.7.2. Products
- 16.2.7.3. SWOT Analysis
- 16.2.7.4. Recent Developments
- 16.2.7.5. Financials (Based on Availability)
- 16.2.1 Cargill Incorporated
List of Figures
- Figure 1: Global UK Food Acidulants Industry Revenue Breakdown (Million, %) by Region 2024 & 2032
- Figure 2: Global UK Food Acidulants Industry Volume Breakdown (K Tons, %) by Region 2024 & 2032
- Figure 3: United kingdom Region UK Food Acidulants Industry Revenue (Million), by Country 2024 & 2032
- Figure 4: United kingdom Region UK Food Acidulants Industry Volume (K Tons), by Country 2024 & 2032
- Figure 5: United kingdom Region UK Food Acidulants Industry Revenue Share (%), by Country 2024 & 2032
- Figure 6: United kingdom Region UK Food Acidulants Industry Volume Share (%), by Country 2024 & 2032
- Figure 7: North America UK Food Acidulants Industry Revenue (Million), by Type 2024 & 2032
- Figure 8: North America UK Food Acidulants Industry Volume (K Tons), by Type 2024 & 2032
- Figure 9: North America UK Food Acidulants Industry Revenue Share (%), by Type 2024 & 2032
- Figure 10: North America UK Food Acidulants Industry Volume Share (%), by Type 2024 & 2032
- Figure 11: North America UK Food Acidulants Industry Revenue (Million), by Application 2024 & 2032
- Figure 12: North America UK Food Acidulants Industry Volume (K Tons), by Application 2024 & 2032
- Figure 13: North America UK Food Acidulants Industry Revenue Share (%), by Application 2024 & 2032
- Figure 14: North America UK Food Acidulants Industry Volume Share (%), by Application 2024 & 2032
- Figure 15: North America UK Food Acidulants Industry Revenue (Million), by Country 2024 & 2032
- Figure 16: North America UK Food Acidulants Industry Volume (K Tons), by Country 2024 & 2032
- Figure 17: North America UK Food Acidulants Industry Revenue Share (%), by Country 2024 & 2032
- Figure 18: North America UK Food Acidulants Industry Volume Share (%), by Country 2024 & 2032
- Figure 19: South America UK Food Acidulants Industry Revenue (Million), by Type 2024 & 2032
- Figure 20: South America UK Food Acidulants Industry Volume (K Tons), by Type 2024 & 2032
- Figure 21: South America UK Food Acidulants Industry Revenue Share (%), by Type 2024 & 2032
- Figure 22: South America UK Food Acidulants Industry Volume Share (%), by Type 2024 & 2032
- Figure 23: South America UK Food Acidulants Industry Revenue (Million), by Application 2024 & 2032
- Figure 24: South America UK Food Acidulants Industry Volume (K Tons), by Application 2024 & 2032
- Figure 25: South America UK Food Acidulants Industry Revenue Share (%), by Application 2024 & 2032
- Figure 26: South America UK Food Acidulants Industry Volume Share (%), by Application 2024 & 2032
- Figure 27: South America UK Food Acidulants Industry Revenue (Million), by Country 2024 & 2032
- Figure 28: South America UK Food Acidulants Industry Volume (K Tons), by Country 2024 & 2032
- Figure 29: South America UK Food Acidulants Industry Revenue Share (%), by Country 2024 & 2032
- Figure 30: South America UK Food Acidulants Industry Volume Share (%), by Country 2024 & 2032
- Figure 31: Europe UK Food Acidulants Industry Revenue (Million), by Type 2024 & 2032
- Figure 32: Europe UK Food Acidulants Industry Volume (K Tons), by Type 2024 & 2032
- Figure 33: Europe UK Food Acidulants Industry Revenue Share (%), by Type 2024 & 2032
- Figure 34: Europe UK Food Acidulants Industry Volume Share (%), by Type 2024 & 2032
- Figure 35: Europe UK Food Acidulants Industry Revenue (Million), by Application 2024 & 2032
- Figure 36: Europe UK Food Acidulants Industry Volume (K Tons), by Application 2024 & 2032
- Figure 37: Europe UK Food Acidulants Industry Revenue Share (%), by Application 2024 & 2032
- Figure 38: Europe UK Food Acidulants Industry Volume Share (%), by Application 2024 & 2032
- Figure 39: Europe UK Food Acidulants Industry Revenue (Million), by Country 2024 & 2032
- Figure 40: Europe UK Food Acidulants Industry Volume (K Tons), by Country 2024 & 2032
- Figure 41: Europe UK Food Acidulants Industry Revenue Share (%), by Country 2024 & 2032
- Figure 42: Europe UK Food Acidulants Industry Volume Share (%), by Country 2024 & 2032
- Figure 43: Middle East & Africa UK Food Acidulants Industry Revenue (Million), by Type 2024 & 2032
- Figure 44: Middle East & Africa UK Food Acidulants Industry Volume (K Tons), by Type 2024 & 2032
- Figure 45: Middle East & Africa UK Food Acidulants Industry Revenue Share (%), by Type 2024 & 2032
- Figure 46: Middle East & Africa UK Food Acidulants Industry Volume Share (%), by Type 2024 & 2032
- Figure 47: Middle East & Africa UK Food Acidulants Industry Revenue (Million), by Application 2024 & 2032
- Figure 48: Middle East & Africa UK Food Acidulants Industry Volume (K Tons), by Application 2024 & 2032
- Figure 49: Middle East & Africa UK Food Acidulants Industry Revenue Share (%), by Application 2024 & 2032
- Figure 50: Middle East & Africa UK Food Acidulants Industry Volume Share (%), by Application 2024 & 2032
- Figure 51: Middle East & Africa UK Food Acidulants Industry Revenue (Million), by Country 2024 & 2032
- Figure 52: Middle East & Africa UK Food Acidulants Industry Volume (K Tons), by Country 2024 & 2032
- Figure 53: Middle East & Africa UK Food Acidulants Industry Revenue Share (%), by Country 2024 & 2032
- Figure 54: Middle East & Africa UK Food Acidulants Industry Volume Share (%), by Country 2024 & 2032
- Figure 55: Asia Pacific UK Food Acidulants Industry Revenue (Million), by Type 2024 & 2032
- Figure 56: Asia Pacific UK Food Acidulants Industry Volume (K Tons), by Type 2024 & 2032
- Figure 57: Asia Pacific UK Food Acidulants Industry Revenue Share (%), by Type 2024 & 2032
- Figure 58: Asia Pacific UK Food Acidulants Industry Volume Share (%), by Type 2024 & 2032
- Figure 59: Asia Pacific UK Food Acidulants Industry Revenue (Million), by Application 2024 & 2032
- Figure 60: Asia Pacific UK Food Acidulants Industry Volume (K Tons), by Application 2024 & 2032
- Figure 61: Asia Pacific UK Food Acidulants Industry Revenue Share (%), by Application 2024 & 2032
- Figure 62: Asia Pacific UK Food Acidulants Industry Volume Share (%), by Application 2024 & 2032
- Figure 63: Asia Pacific UK Food Acidulants Industry Revenue (Million), by Country 2024 & 2032
- Figure 64: Asia Pacific UK Food Acidulants Industry Volume (K Tons), by Country 2024 & 2032
- Figure 65: Asia Pacific UK Food Acidulants Industry Revenue Share (%), by Country 2024 & 2032
- Figure 66: Asia Pacific UK Food Acidulants Industry Volume Share (%), by Country 2024 & 2032
List of Tables
- Table 1: Global UK Food Acidulants Industry Revenue Million Forecast, by Region 2019 & 2032
- Table 2: Global UK Food Acidulants Industry Volume K Tons Forecast, by Region 2019 & 2032
- Table 3: Global UK Food Acidulants Industry Revenue Million Forecast, by Type 2019 & 2032
- Table 4: Global UK Food Acidulants Industry Volume K Tons Forecast, by Type 2019 & 2032
- Table 5: Global UK Food Acidulants Industry Revenue Million Forecast, by Application 2019 & 2032
- Table 6: Global UK Food Acidulants Industry Volume K Tons Forecast, by Application 2019 & 2032
- Table 7: Global UK Food Acidulants Industry Revenue Million Forecast, by Region 2019 & 2032
- Table 8: Global UK Food Acidulants Industry Volume K Tons Forecast, by Region 2019 & 2032
- Table 9: Global UK Food Acidulants Industry Revenue Million Forecast, by Country 2019 & 2032
- Table 10: Global UK Food Acidulants Industry Volume K Tons Forecast, by Country 2019 & 2032
- Table 11: England UK Food Acidulants Industry Revenue (Million) Forecast, by Application 2019 & 2032
- Table 12: England UK Food Acidulants Industry Volume (K Tons) Forecast, by Application 2019 & 2032
- Table 13: Wales UK Food Acidulants Industry Revenue (Million) Forecast, by Application 2019 & 2032
- Table 14: Wales UK Food Acidulants Industry Volume (K Tons) Forecast, by Application 2019 & 2032
- Table 15: Scotland UK Food Acidulants Industry Revenue (Million) Forecast, by Application 2019 & 2032
- Table 16: Scotland UK Food Acidulants Industry Volume (K Tons) Forecast, by Application 2019 & 2032
- Table 17: Northern UK Food Acidulants Industry Revenue (Million) Forecast, by Application 2019 & 2032
- Table 18: Northern UK Food Acidulants Industry Volume (K Tons) Forecast, by Application 2019 & 2032
- Table 19: Ireland UK Food Acidulants Industry Revenue (Million) Forecast, by Application 2019 & 2032
- Table 20: Ireland UK Food Acidulants Industry Volume (K Tons) Forecast, by Application 2019 & 2032
- Table 21: Global UK Food Acidulants Industry Revenue Million Forecast, by Type 2019 & 2032
- Table 22: Global UK Food Acidulants Industry Volume K Tons Forecast, by Type 2019 & 2032
- Table 23: Global UK Food Acidulants Industry Revenue Million Forecast, by Application 2019 & 2032
- Table 24: Global UK Food Acidulants Industry Volume K Tons Forecast, by Application 2019 & 2032
- Table 25: Global UK Food Acidulants Industry Revenue Million Forecast, by Country 2019 & 2032
- Table 26: Global UK Food Acidulants Industry Volume K Tons Forecast, by Country 2019 & 2032
- Table 27: United States UK Food Acidulants Industry Revenue (Million) Forecast, by Application 2019 & 2032
- Table 28: United States UK Food Acidulants Industry Volume (K Tons) Forecast, by Application 2019 & 2032
- Table 29: Canada UK Food Acidulants Industry Revenue (Million) Forecast, by Application 2019 & 2032
- Table 30: Canada UK Food Acidulants Industry Volume (K Tons) Forecast, by Application 2019 & 2032
- Table 31: Mexico UK Food Acidulants Industry Revenue (Million) Forecast, by Application 2019 & 2032
- Table 32: Mexico UK Food Acidulants Industry Volume (K Tons) Forecast, by Application 2019 & 2032
- Table 33: Global UK Food Acidulants Industry Revenue Million Forecast, by Type 2019 & 2032
- Table 34: Global UK Food Acidulants Industry Volume K Tons Forecast, by Type 2019 & 2032
- Table 35: Global UK Food Acidulants Industry Revenue Million Forecast, by Application 2019 & 2032
- Table 36: Global UK Food Acidulants Industry Volume K Tons Forecast, by Application 2019 & 2032
- Table 37: Global UK Food Acidulants Industry Revenue Million Forecast, by Country 2019 & 2032
- Table 38: Global UK Food Acidulants Industry Volume K Tons Forecast, by Country 2019 & 2032
- Table 39: Brazil UK Food Acidulants Industry Revenue (Million) Forecast, by Application 2019 & 2032
- Table 40: Brazil UK Food Acidulants Industry Volume (K Tons) Forecast, by Application 2019 & 2032
- Table 41: Argentina UK Food Acidulants Industry Revenue (Million) Forecast, by Application 2019 & 2032
- Table 42: Argentina UK Food Acidulants Industry Volume (K Tons) Forecast, by Application 2019 & 2032
- Table 43: Rest of South America UK Food Acidulants Industry Revenue (Million) Forecast, by Application 2019 & 2032
- Table 44: Rest of South America UK Food Acidulants Industry Volume (K Tons) Forecast, by Application 2019 & 2032
- Table 45: Global UK Food Acidulants Industry Revenue Million Forecast, by Type 2019 & 2032
- Table 46: Global UK Food Acidulants Industry Volume K Tons Forecast, by Type 2019 & 2032
- Table 47: Global UK Food Acidulants Industry Revenue Million Forecast, by Application 2019 & 2032
- Table 48: Global UK Food Acidulants Industry Volume K Tons Forecast, by Application 2019 & 2032
- Table 49: Global UK Food Acidulants Industry Revenue Million Forecast, by Country 2019 & 2032
- Table 50: Global UK Food Acidulants Industry Volume K Tons Forecast, by Country 2019 & 2032
- Table 51: United Kingdom UK Food Acidulants Industry Revenue (Million) Forecast, by Application 2019 & 2032
- Table 52: United Kingdom UK Food Acidulants Industry Volume (K Tons) Forecast, by Application 2019 & 2032
- Table 53: Germany UK Food Acidulants Industry Revenue (Million) Forecast, by Application 2019 & 2032
- Table 54: Germany UK Food Acidulants Industry Volume (K Tons) Forecast, by Application 2019 & 2032
- Table 55: France UK Food Acidulants Industry Revenue (Million) Forecast, by Application 2019 & 2032
- Table 56: France UK Food Acidulants Industry Volume (K Tons) Forecast, by Application 2019 & 2032
- Table 57: Italy UK Food Acidulants Industry Revenue (Million) Forecast, by Application 2019 & 2032
- Table 58: Italy UK Food Acidulants Industry Volume (K Tons) Forecast, by Application 2019 & 2032
- Table 59: Spain UK Food Acidulants Industry Revenue (Million) Forecast, by Application 2019 & 2032
- Table 60: Spain UK Food Acidulants Industry Volume (K Tons) Forecast, by Application 2019 & 2032
- Table 61: Russia UK Food Acidulants Industry Revenue (Million) Forecast, by Application 2019 & 2032
- Table 62: Russia UK Food Acidulants Industry Volume (K Tons) Forecast, by Application 2019 & 2032
- Table 63: Benelux UK Food Acidulants Industry Revenue (Million) Forecast, by Application 2019 & 2032
- Table 64: Benelux UK Food Acidulants Industry Volume (K Tons) Forecast, by Application 2019 & 2032
- Table 65: Nordics UK Food Acidulants Industry Revenue (Million) Forecast, by Application 2019 & 2032
- Table 66: Nordics UK Food Acidulants Industry Volume (K Tons) Forecast, by Application 2019 & 2032
- Table 67: Rest of Europe UK Food Acidulants Industry Revenue (Million) Forecast, by Application 2019 & 2032
- Table 68: Rest of Europe UK Food Acidulants Industry Volume (K Tons) Forecast, by Application 2019 & 2032
- Table 69: Global UK Food Acidulants Industry Revenue Million Forecast, by Type 2019 & 2032
- Table 70: Global UK Food Acidulants Industry Volume K Tons Forecast, by Type 2019 & 2032
- Table 71: Global UK Food Acidulants Industry Revenue Million Forecast, by Application 2019 & 2032
- Table 72: Global UK Food Acidulants Industry Volume K Tons Forecast, by Application 2019 & 2032
- Table 73: Global UK Food Acidulants Industry Revenue Million Forecast, by Country 2019 & 2032
- Table 74: Global UK Food Acidulants Industry Volume K Tons Forecast, by Country 2019 & 2032
- Table 75: Turkey UK Food Acidulants Industry Revenue (Million) Forecast, by Application 2019 & 2032
- Table 76: Turkey UK Food Acidulants Industry Volume (K Tons) Forecast, by Application 2019 & 2032
- Table 77: Israel UK Food Acidulants Industry Revenue (Million) Forecast, by Application 2019 & 2032
- Table 78: Israel UK Food Acidulants Industry Volume (K Tons) Forecast, by Application 2019 & 2032
- Table 79: GCC UK Food Acidulants Industry Revenue (Million) Forecast, by Application 2019 & 2032
- Table 80: GCC UK Food Acidulants Industry Volume (K Tons) Forecast, by Application 2019 & 2032
- Table 81: North Africa UK Food Acidulants Industry Revenue (Million) Forecast, by Application 2019 & 2032
- Table 82: North Africa UK Food Acidulants Industry Volume (K Tons) Forecast, by Application 2019 & 2032
- Table 83: South Africa UK Food Acidulants Industry Revenue (Million) Forecast, by Application 2019 & 2032
- Table 84: South Africa UK Food Acidulants Industry Volume (K Tons) Forecast, by Application 2019 & 2032
- Table 85: Rest of Middle East & Africa UK Food Acidulants Industry Revenue (Million) Forecast, by Application 2019 & 2032
- Table 86: Rest of Middle East & Africa UK Food Acidulants Industry Volume (K Tons) Forecast, by Application 2019 & 2032
- Table 87: Global UK Food Acidulants Industry Revenue Million Forecast, by Type 2019 & 2032
- Table 88: Global UK Food Acidulants Industry Volume K Tons Forecast, by Type 2019 & 2032
- Table 89: Global UK Food Acidulants Industry Revenue Million Forecast, by Application 2019 & 2032
- Table 90: Global UK Food Acidulants Industry Volume K Tons Forecast, by Application 2019 & 2032
- Table 91: Global UK Food Acidulants Industry Revenue Million Forecast, by Country 2019 & 2032
- Table 92: Global UK Food Acidulants Industry Volume K Tons Forecast, by Country 2019 & 2032
- Table 93: China UK Food Acidulants Industry Revenue (Million) Forecast, by Application 2019 & 2032
- Table 94: China UK Food Acidulants Industry Volume (K Tons) Forecast, by Application 2019 & 2032
- Table 95: India UK Food Acidulants Industry Revenue (Million) Forecast, by Application 2019 & 2032
- Table 96: India UK Food Acidulants Industry Volume (K Tons) Forecast, by Application 2019 & 2032
- Table 97: Japan UK Food Acidulants Industry Revenue (Million) Forecast, by Application 2019 & 2032
- Table 98: Japan UK Food Acidulants Industry Volume (K Tons) Forecast, by Application 2019 & 2032
- Table 99: South Korea UK Food Acidulants Industry Revenue (Million) Forecast, by Application 2019 & 2032
- Table 100: South Korea UK Food Acidulants Industry Volume (K Tons) Forecast, by Application 2019 & 2032
- Table 101: ASEAN UK Food Acidulants Industry Revenue (Million) Forecast, by Application 2019 & 2032
- Table 102: ASEAN UK Food Acidulants Industry Volume (K Tons) Forecast, by Application 2019 & 2032
- Table 103: Oceania UK Food Acidulants Industry Revenue (Million) Forecast, by Application 2019 & 2032
- Table 104: Oceania UK Food Acidulants Industry Volume (K Tons) Forecast, by Application 2019 & 2032
- Table 105: Rest of Asia Pacific UK Food Acidulants Industry Revenue (Million) Forecast, by Application 2019 & 2032
- Table 106: Rest of Asia Pacific UK Food Acidulants Industry Volume (K Tons) Forecast, by Application 2019 & 2032
Frequently Asked Questions
1. What is the projected Compound Annual Growth Rate (CAGR) of the UK Food Acidulants Industry?
The projected CAGR is approximately 4.07%.
2. Which companies are prominent players in the UK Food Acidulants Industry?
Key companies in the market include Cargill Incorporated, Merck KGaA, Archer Daniels Midland Company, Tate & Lyle PLC, Monarch Chemicals Ltd, Brenntag AG, H Plus Limited*List Not Exhaustive.
3. What are the main segments of the UK Food Acidulants Industry?
The market segments include Type, Application.
4. Can you provide details about the market size?
The market size is estimated to be USD XX Million as of 2022.
5. What are some drivers contributing to market growth?
Rising Application in Dietary Supplements.
6. What are the notable trends driving market growth?
Phosphoric Acid Promises Growth in Future.
7. Are there any restraints impacting market growth?
Increasing prevalence of hydroglycemia.
8. Can you provide examples of recent developments in the market?
N/A
9. What pricing options are available for accessing the report?
Pricing options include single-user, multi-user, and enterprise licenses priced at USD 3800, USD 4500, and USD 5800 respectively.
10. Is the market size provided in terms of value or volume?
The market size is provided in terms of value, measured in Million and volume, measured in K Tons.
11. Are there any specific market keywords associated with the report?
Yes, the market keyword associated with the report is "UK Food Acidulants Industry," which aids in identifying and referencing the specific market segment covered.
12. How do I determine which pricing option suits my needs best?
The pricing options vary based on user requirements and access needs. Individual users may opt for single-user licenses, while businesses requiring broader access may choose multi-user or enterprise licenses for cost-effective access to the report.
13. Are there any additional resources or data provided in the UK Food Acidulants Industry report?
While the report offers comprehensive insights, it's advisable to review the specific contents or supplementary materials provided to ascertain if additional resources or data are available.
14. How can I stay updated on further developments or reports in the UK Food Acidulants Industry?
To stay informed about further developments, trends, and reports in the UK Food Acidulants Industry, consider subscribing to industry newsletters, following relevant companies and organizations, or regularly checking reputable industry news sources and publications.
Methodology
Step 1 - Identification of Relevant Samples Size from Population Database


Step 2 - Approaches for Defining Global Market Size (Value, Volume* & Price*)

Note*: In applicable scenarios
Step 3 - Data Sources
Primary Research
- Web Analytics
- Survey Reports
- Research Institute
- Latest Research Reports
- Opinion Leaders
Secondary Research
- Annual Reports
- White Paper
- Latest Press Release
- Industry Association
- Paid Database
- Investor Presentations

Step 4 - Data Triangulation
Involves using different sources of information in order to increase the validity of a study
These sources are likely to be stakeholders in a program - participants, other researchers, program staff, other community members, and so on.
Then we put all data in single framework & apply various statistical tools to find out the dynamic on the market.
During the analysis stage, feedback from the stakeholder groups would be compared to determine areas of agreement as well as areas of divergence
