

Key Insights
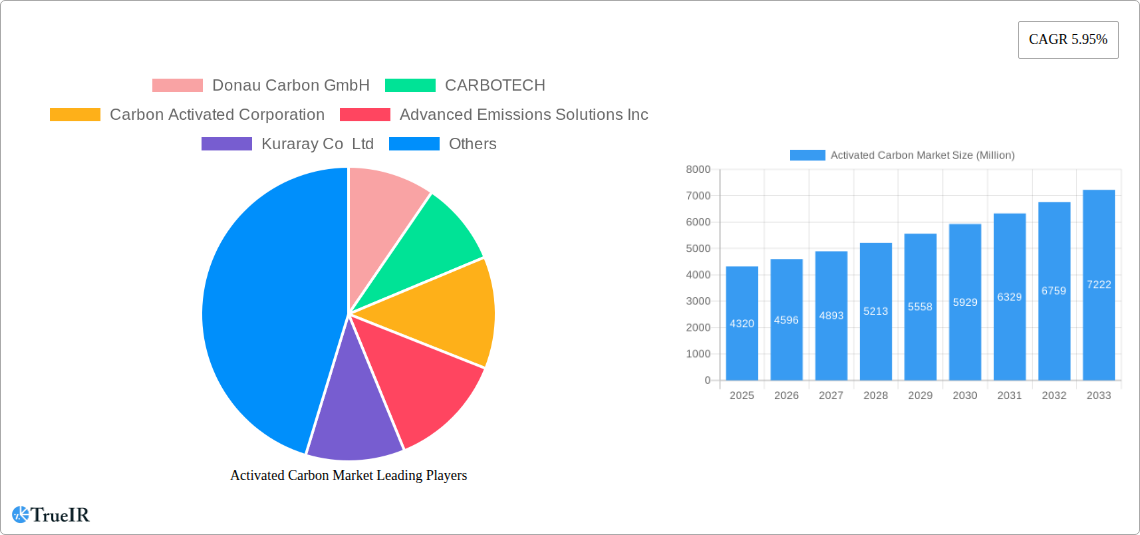
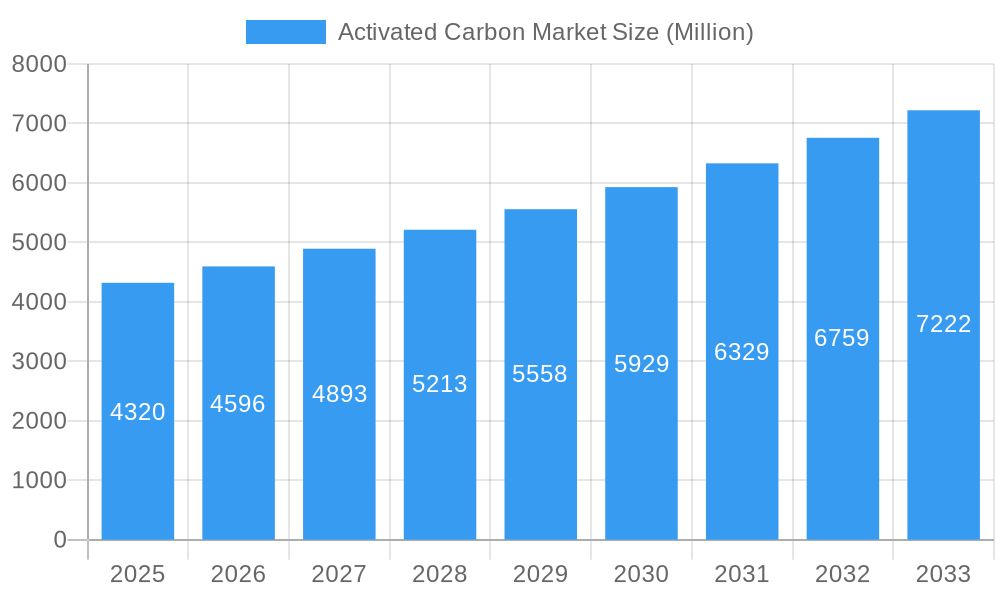
The global activated carbon market, valued at $4.32 billion in 2025, is projected to experience robust growth, exhibiting a compound annual growth rate (CAGR) of 5.95% from 2025 to 2033. This expansion is driven by several key factors. Increasing environmental regulations concerning water and air purification are significantly boosting demand across various sectors, particularly water treatment and industrial processing. The rising prevalence of chronic diseases necessitates advanced medical treatments, further fueling the adoption of activated carbon in pharmaceutical applications. Furthermore, the growing focus on sustainable solutions in diverse industries, such as food and beverage processing, is driving the demand for eco-friendly filtration and purification technologies using activated carbon. The market is segmented by product type (powdered, granular, extruded/pelletized), application (gas/water purification, metal extraction, medicine), and end-user industry (water treatment, food & beverage, healthcare, automotive, industrial processing). The Asia-Pacific region, led by China and India, is anticipated to dominate the market due to rapid industrialization and increasing investments in infrastructure development. However, fluctuating raw material prices and stringent regulations related to carbon production pose potential challenges to market growth.
Activated Carbon Market Market Size (In Billion)
The competitive landscape is characterized by a mix of established multinational corporations and specialized regional players. Companies such as Donau Carbon GmbH, Cabot Corporation, and Kuraray Co. Ltd. are prominent players, leveraging their established brand presence and technological expertise. However, smaller, agile companies are also gaining traction, focusing on niche applications and innovative product development. The future growth trajectory will likely depend on advancements in carbon production technologies, which could lead to cost reductions and enhance performance characteristics, making activated carbon a more sustainable and economical solution for a wider range of applications. Furthermore, strategic collaborations and mergers & acquisitions are expected to shape the industry structure in the coming years. The market is likely to witness increased innovation in product formulations tailored to specific applications, potentially leading to premium pricing and higher profit margins for specialized players.
Activated Carbon Market Company Market Share
Activated Carbon Market: A Comprehensive Report (2019-2033)
This dynamic report provides a comprehensive analysis of the Activated Carbon Market, offering invaluable insights for businesses, investors, and researchers seeking to understand this rapidly evolving industry. Covering the period from 2019 to 2033, with a focus on 2025, this report leverages rigorous data analysis and expert insights to illuminate market trends, competitive dynamics, and future opportunities. The global activated carbon market size is estimated at xx Million in 2025 and is projected to reach xx Million by 2033, exhibiting a CAGR of xx% during the forecast period (2025-2033).
Activated Carbon Market Structure & Competitive Landscape
The Activated Carbon market is characterized by a moderately concentrated landscape, with several large players and numerous smaller, specialized companies vying for market share. The Herfindahl-Hirschman Index (HHI) is estimated at xx, indicating a moderately competitive environment. Key innovation drivers include advancements in material science leading to improved adsorption capacity and efficiency, as well as the development of sustainable and environmentally friendly production methods. Regulatory pressures, particularly related to environmental protection and emissions control, significantly shape the market, driving demand for higher-quality and specialized activated carbons.
Product substitutes, such as zeolites and other adsorbents, pose a competitive threat, but activated carbon's superior performance in several applications maintains its dominant position. End-user segmentation is diverse, with significant contributions from water treatment, food and beverage, and healthcare sectors. Mergers and acquisitions (M&A) activity has been relatively high in recent years, with xx M&A deals recorded between 2019 and 2024, primarily driven by larger companies seeking to expand their product portfolios and geographic reach.
Activated Carbon Market Market Trends & Opportunities
The Activated Carbon Market is witnessing robust growth, driven by several key factors. The increasing need for clean water and air, stringent environmental regulations, and rising industrial activity are propelling market expansion. Technological advancements, such as the development of novel activated carbon materials with enhanced performance characteristics, are opening new application areas and driving innovation. Consumer preference for environmentally friendly products and sustainable practices is also influencing market demand.
The competitive landscape is marked by both intense rivalry and collaborative efforts. Established players are focusing on expanding their production capacity, enhancing product offerings, and entering new geographical markets. Smaller companies are specializing in niche applications or leveraging innovative technologies to gain a foothold. The market penetration rate for activated carbon in various end-use applications is growing steadily, driven by increasing awareness of its benefits and rising regulatory scrutiny.
The market size is projected to experience significant growth in the coming years. The Compound Annual Growth Rate (CAGR) for the forecast period is estimated at xx%, reflecting a healthy and dynamic market.
Dominant Markets & Segments in Activated Carbon Market
The Asia-Pacific region is currently the leading market for activated carbon, driven by robust industrial growth, increasing urbanization, and expanding water and wastewater treatment infrastructure. China and India are major contributors to this regional dominance.
By Product Type: Granular Activated Carbons (GAC) currently holds the largest market share, due to its versatility and suitability for a wide range of applications. However, Powdered Activated Carbons (PAC) are experiencing strong growth due to their cost-effectiveness and efficacy in specific applications.
By Application: Water purification is the leading application segment, driven by growing concerns about water scarcity and water quality. Gas purification is another significant application area, particularly in industrial and automotive sectors.
By End-user Industry: The water treatment industry is the largest end-user segment, followed by the food and beverage industry. Growth in the healthcare sector is also contributing to market expansion.
Key growth drivers include:
- Stringent environmental regulations
- Increasing industrialization
- Growing demand for clean water and air
- Rising disposable incomes
Further analysis reveals strong potential in emerging economies due to infrastructural developments and governmental initiatives promoting environmental protection.
Activated Carbon Market Product Analysis
Activated carbon products are continuously evolving, with advancements in material science leading to the development of more efficient and specialized materials. Innovations focus on enhanced adsorption capacity, improved selectivity, and greater durability. These advancements are expanding the applications of activated carbon into new areas, such as energy storage and environmental remediation. Competitive advantages stem from superior product performance, cost-effectiveness, and ability to meet specific customer requirements. The market is witnessing a trend toward customized solutions tailored to individual applications, reflecting growing customer demand for specialized products.
Key Drivers, Barriers & Challenges in Activated Carbon Market
Key Drivers:
- Increasing demand for clean water and air due to rising environmental concerns.
- Stringent government regulations on emissions and wastewater treatment.
- Growing industrialization and urbanization driving demand in various sectors.
- Technological advancements leading to improved activated carbon performance.
Key Challenges and Restraints:
- Fluctuations in raw material prices, impacting production costs and profitability.
- Competition from alternative adsorbents and technologies.
- Stringent environmental regulations requiring compliance with emission standards.
- Potential supply chain disruptions affecting raw material availability.
The impact of these challenges is reflected in xx% of the market’s overall growth (predicted).
Growth Drivers in the Activated Carbon Market Market
The Activated Carbon market is propelled by factors including the stringent environmental regulations across the globe, demanding cleaner water and air. The increasing industrialization and urbanization contribute significantly to the growing demand for activated carbon in various sectors. Furthermore, continuous technological advancements lead to improved product performance and efficiency, expanding its applicability.
Challenges Impacting Activated Carbon Market Growth
Challenges hindering market growth include the volatile raw material prices affecting profitability and supply chain disruptions impacting availability. Competition from alternative adsorbents and technologies also poses significant pressure. Regulatory changes and compliance costs impose additional burdens on manufacturers.
Key Players Shaping the Activated Carbon Market Market
- Donau Carbon GmbH
- CARBOTECH
- Carbon Activated Corporation
- Advanced Emissions Solutions Inc
- Kuraray Co Ltd
- CPL Activated Carbons
- Evoqua Water Technologies LLC
- Cabot Corporation
- Kureha Corporation
- Ingevity
- Silcarbon Aktivkohle GmbH
- Haycarb (Pvt ) Ltd
- Puragen Activated Carbons
- Jacobi Carbons Group
- Albemarle Corporation
- Veolia (Veolia Water Technologies)
- List Not Exhaustive
Significant Activated Carbon Market Industry Milestones
- March 2022: Cabot Corporation sold its activated carbon unit, Norit Activated Carbon, to One Equity Partners. This divestiture created an independent company with ten production facilities in seven countries, impacting market dynamics through increased competition and potential for innovation.
Future Outlook for Activated Carbon Market Market
The Activated Carbon market is poised for continued growth, driven by persistent demand for clean water and air, stringent environmental regulations, and ongoing technological advancements. Strategic opportunities lie in developing innovative products tailored to specific applications, expanding into new geographical markets, and forming strategic partnerships to enhance market reach and penetration. The market potential is substantial, particularly in emerging economies undergoing rapid industrialization and urbanization.
Activated Carbon Market Segmentation
-
1. Product Type
- 1.1. Powdered Activated Carbons (PAC)
- 1.2. Granular Activated Carbons (GAC)
- 1.3. Extruded or Pelletized Activated Carbon
-
2. Application
- 2.1. Gas Purification
- 2.2. Water Purification
- 2.3. Metal Extraction
- 2.4. Medicine
- 2.5. Other Applications
-
3. End-user Industry
- 3.1. Water Treatment
- 3.2. Food and Beverage
- 3.3. Healthcare
- 3.4. Automotive
- 3.5. Industrial Processing
- 3.6. Other End-user Industries
Activated Carbon Market Segmentation By Geography
-
1. Asia Pacific
- 1.1. China
- 1.2. India
- 1.3. Japan
- 1.4. South Korea
- 1.5. Rest of Asia Pacific
-
2. North America
- 2.1. United States
- 2.2. Canada
- 2.3. Mexico
-
3. Europe
- 3.1. Germany
- 3.2. United Kingdom
- 3.3. France
- 3.4. Italy
- 3.5. Spain
- 3.6. Rest of Europe
-
4. South America
- 4.1. Brazil
- 4.2. Argentina
- 4.3. Rest of South America
-
5. Middle East and Africa
- 5.1. Saudi Arabia
- 5.2. South Africa
- 5.3. Rest of Middle East and Africa
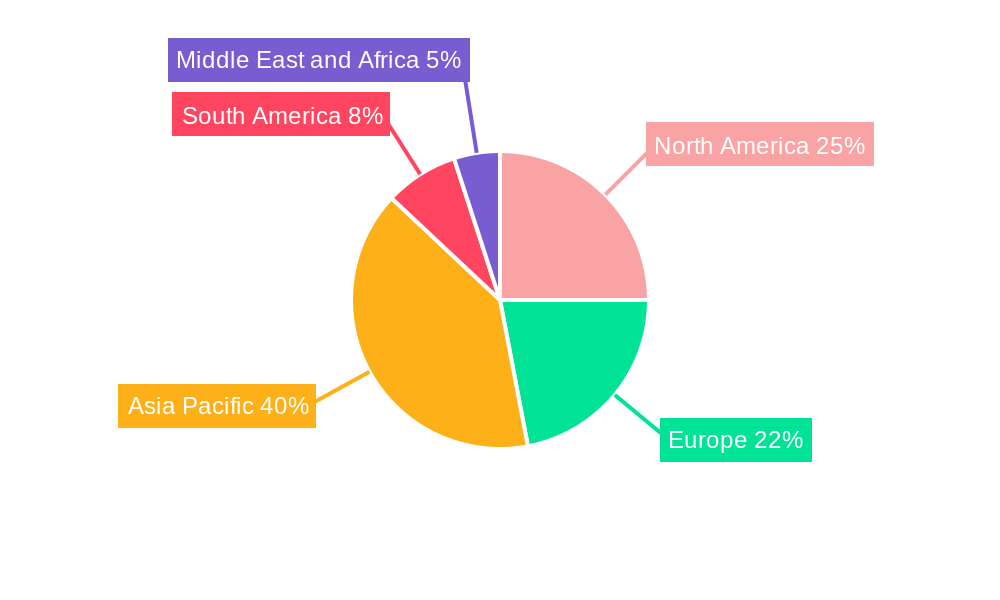
Activated Carbon Market Regional Market Share
Geographic Coverage of Activated Carbon Market
Activated Carbon Market REPORT HIGHLIGHTS
| Aspects | Details |
|---|---|
| Study Period | 2020-2034 |
| Base Year | 2025 |
| Estimated Year | 2026 |
| Forecast Period | 2026-2034 |
| Historical Period | 2020-2025 |
| Growth Rate | CAGR of 5.95% from 2020-2034 |
| Segmentation |
|
Table of Contents
- 1. Introduction
- 1.1. Research Scope
- 1.2. Market Segmentation
- 1.3. Research Objective
- 1.4. Definitions and Assumptions
- 2. Executive Summary
- 2.1. Market Snapshot
- 3. Market Dynamics
- 3.1. Market Drivers
- 3.2. Market Restrains
- 3.3. Market Trends
- 3.4. Market Opportunities
- 4. Market Factor Analysis
- 4.1. Porters Five Forces
- 4.1.1. Bargaining Power of Suppliers
- 4.1.2. Bargaining Power of Buyers
- 4.1.3. Threat of New Entrants
- 4.1.4. Threat of Substitutes
- 4.1.5. Competitive Rivalry
- 4.2. PESTEL analysis
- 4.3. BCG Analysis
- 4.3.1. Stars (High Growth, High Market Share)
- 4.3.2. Cash Cows (Low Growth, High Market Share)
- 4.3.3. Question Mark (High Growth, Low Market Share)
- 4.3.4. Dogs (Low Growth, Low Market Share)
- 4.4. Ansoff Matrix Analysis
- 4.5. Supply Chain Analysis
- 4.6. Regulatory Landscape
- 4.7. Current Market Potential and Opportunity Assessment (TAM–SAM–SOM Framework)
- 4.8. TIR Analyst Note
- 4.1. Porters Five Forces
- 5. Market Analysis, Insights and Forecast 2021-2033
- 5.1. Market Analysis, Insights and Forecast - by Product Type
- 5.1.1. Powdered Activated Carbons (PAC)
- 5.1.2. Granular Activated Carbons (GAC)
- 5.1.3. Extruded or Pelletized Activated Carbon
- 5.2. Market Analysis, Insights and Forecast - by Application
- 5.2.1. Gas Purification
- 5.2.2. Water Purification
- 5.2.3. Metal Extraction
- 5.2.4. Medicine
- 5.2.5. Other Applications
- 5.3. Market Analysis, Insights and Forecast - by End-user Industry
- 5.3.1. Water Treatment
- 5.3.2. Food and Beverage
- 5.3.3. Healthcare
- 5.3.4. Automotive
- 5.3.5. Industrial Processing
- 5.3.6. Other End-user Industries
- 5.4. Market Analysis, Insights and Forecast - by Region
- 5.4.1. Asia Pacific
- 5.4.2. North America
- 5.4.3. Europe
- 5.4.4. South America
- 5.4.5. Middle East and Africa
- 5.1. Market Analysis, Insights and Forecast - by Product Type
- 6. Global Activated Carbon Market Analysis, Insights and Forecast, 2021-2033
- 6.1. Market Analysis, Insights and Forecast - by Product Type
- 6.1.1. Powdered Activated Carbons (PAC)
- 6.1.2. Granular Activated Carbons (GAC)
- 6.1.3. Extruded or Pelletized Activated Carbon
- 6.2. Market Analysis, Insights and Forecast - by Application
- 6.2.1. Gas Purification
- 6.2.2. Water Purification
- 6.2.3. Metal Extraction
- 6.2.4. Medicine
- 6.2.5. Other Applications
- 6.3. Market Analysis, Insights and Forecast - by End-user Industry
- 6.3.1. Water Treatment
- 6.3.2. Food and Beverage
- 6.3.3. Healthcare
- 6.3.4. Automotive
- 6.3.5. Industrial Processing
- 6.3.6. Other End-user Industries
- 6.1. Market Analysis, Insights and Forecast - by Product Type
- 7. Asia Pacific Activated Carbon Market Analysis, Insights and Forecast, 2020-2032
- 7.1. Market Analysis, Insights and Forecast - by Product Type
- 7.1.1. Powdered Activated Carbons (PAC)
- 7.1.2. Granular Activated Carbons (GAC)
- 7.1.3. Extruded or Pelletized Activated Carbon
- 7.2. Market Analysis, Insights and Forecast - by Application
- 7.2.1. Gas Purification
- 7.2.2. Water Purification
- 7.2.3. Metal Extraction
- 7.2.4. Medicine
- 7.2.5. Other Applications
- 7.3. Market Analysis, Insights and Forecast - by End-user Industry
- 7.3.1. Water Treatment
- 7.3.2. Food and Beverage
- 7.3.3. Healthcare
- 7.3.4. Automotive
- 7.3.5. Industrial Processing
- 7.3.6. Other End-user Industries
- 7.1. Market Analysis, Insights and Forecast - by Product Type
- 8. North America Activated Carbon Market Analysis, Insights and Forecast, 2020-2032
- 8.1. Market Analysis, Insights and Forecast - by Product Type
- 8.1.1. Powdered Activated Carbons (PAC)
- 8.1.2. Granular Activated Carbons (GAC)
- 8.1.3. Extruded or Pelletized Activated Carbon
- 8.2. Market Analysis, Insights and Forecast - by Application
- 8.2.1. Gas Purification
- 8.2.2. Water Purification
- 8.2.3. Metal Extraction
- 8.2.4. Medicine
- 8.2.5. Other Applications
- 8.3. Market Analysis, Insights and Forecast - by End-user Industry
- 8.3.1. Water Treatment
- 8.3.2. Food and Beverage
- 8.3.3. Healthcare
- 8.3.4. Automotive
- 8.3.5. Industrial Processing
- 8.3.6. Other End-user Industries
- 8.1. Market Analysis, Insights and Forecast - by Product Type
- 9. Europe Activated Carbon Market Analysis, Insights and Forecast, 2020-2032
- 9.1. Market Analysis, Insights and Forecast - by Product Type
- 9.1.1. Powdered Activated Carbons (PAC)
- 9.1.2. Granular Activated Carbons (GAC)
- 9.1.3. Extruded or Pelletized Activated Carbon
- 9.2. Market Analysis, Insights and Forecast - by Application
- 9.2.1. Gas Purification
- 9.2.2. Water Purification
- 9.2.3. Metal Extraction
- 9.2.4. Medicine
- 9.2.5. Other Applications
- 9.3. Market Analysis, Insights and Forecast - by End-user Industry
- 9.3.1. Water Treatment
- 9.3.2. Food and Beverage
- 9.3.3. Healthcare
- 9.3.4. Automotive
- 9.3.5. Industrial Processing
- 9.3.6. Other End-user Industries
- 9.1. Market Analysis, Insights and Forecast - by Product Type
- 10. South America Activated Carbon Market Analysis, Insights and Forecast, 2020-2032
- 10.1. Market Analysis, Insights and Forecast - by Product Type
- 10.1.1. Powdered Activated Carbons (PAC)
- 10.1.2. Granular Activated Carbons (GAC)
- 10.1.3. Extruded or Pelletized Activated Carbon
- 10.2. Market Analysis, Insights and Forecast - by Application
- 10.2.1. Gas Purification
- 10.2.2. Water Purification
- 10.2.3. Metal Extraction
- 10.2.4. Medicine
- 10.2.5. Other Applications
- 10.3. Market Analysis, Insights and Forecast - by End-user Industry
- 10.3.1. Water Treatment
- 10.3.2. Food and Beverage
- 10.3.3. Healthcare
- 10.3.4. Automotive
- 10.3.5. Industrial Processing
- 10.3.6. Other End-user Industries
- 10.1. Market Analysis, Insights and Forecast - by Product Type
- 11. Middle East and Africa Activated Carbon Market Analysis, Insights and Forecast, 2020-2032
- 11.1. Market Analysis, Insights and Forecast - by Product Type
- 11.1.1. Powdered Activated Carbons (PAC)
- 11.1.2. Granular Activated Carbons (GAC)
- 11.1.3. Extruded or Pelletized Activated Carbon
- 11.2. Market Analysis, Insights and Forecast - by Application
- 11.2.1. Gas Purification
- 11.2.2. Water Purification
- 11.2.3. Metal Extraction
- 11.2.4. Medicine
- 11.2.5. Other Applications
- 11.3. Market Analysis, Insights and Forecast - by End-user Industry
- 11.3.1. Water Treatment
- 11.3.2. Food and Beverage
- 11.3.3. Healthcare
- 11.3.4. Automotive
- 11.3.5. Industrial Processing
- 11.3.6. Other End-user Industries
- 11.1. Market Analysis, Insights and Forecast - by Product Type
- 12. Competitive Analysis
- 12.1. Company Profiles
- 12.1.1 Donau Carbon GmbH
- 12.1.1.1. Company Overview
- 12.1.1.2. Products
- 12.1.1.3. Company Financials
- 12.1.1.4. SWOT Analysis
- 12.1.2 CARBOTECH
- 12.1.2.1. Company Overview
- 12.1.2.2. Products
- 12.1.2.3. Company Financials
- 12.1.2.4. SWOT Analysis
- 12.1.3 Carbon Activated Corporation
- 12.1.3.1. Company Overview
- 12.1.3.2. Products
- 12.1.3.3. Company Financials
- 12.1.3.4. SWOT Analysis
- 12.1.4 Advanced Emissions Solutions Inc
- 12.1.4.1. Company Overview
- 12.1.4.2. Products
- 12.1.4.3. Company Financials
- 12.1.4.4. SWOT Analysis
- 12.1.5 Kuraray Co Ltd
- 12.1.5.1. Company Overview
- 12.1.5.2. Products
- 12.1.5.3. Company Financials
- 12.1.5.4. SWOT Analysis
- 12.1.6 CPL Activated Carbons
- 12.1.6.1. Company Overview
- 12.1.6.2. Products
- 12.1.6.3. Company Financials
- 12.1.6.4. SWOT Analysis
- 12.1.7 Evoqua Water Technologies LLC
- 12.1.7.1. Company Overview
- 12.1.7.2. Products
- 12.1.7.3. Company Financials
- 12.1.7.4. SWOT Analysis
- 12.1.8 Cabot Corporation
- 12.1.8.1. Company Overview
- 12.1.8.2. Products
- 12.1.8.3. Company Financials
- 12.1.8.4. SWOT Analysis
- 12.1.9 Kureha Corporation
- 12.1.9.1. Company Overview
- 12.1.9.2. Products
- 12.1.9.3. Company Financials
- 12.1.9.4. SWOT Analysis
- 12.1.10 Ingevity
- 12.1.10.1. Company Overview
- 12.1.10.2. Products
- 12.1.10.3. Company Financials
- 12.1.10.4. SWOT Analysis
- 12.1.11 Silcarbon Aktivkohle GmbH
- 12.1.11.1. Company Overview
- 12.1.11.2. Products
- 12.1.11.3. Company Financials
- 12.1.11.4. SWOT Analysis
- 12.1.12 Haycarb (Pvt ) Ltd
- 12.1.12.1. Company Overview
- 12.1.12.2. Products
- 12.1.12.3. Company Financials
- 12.1.12.4. SWOT Analysis
- 12.1.13 Puragen Activated Carbons
- 12.1.13.1. Company Overview
- 12.1.13.2. Products
- 12.1.13.3. Company Financials
- 12.1.13.4. SWOT Analysis
- 12.1.14 Jacobi Carbons Group
- 12.1.14.1. Company Overview
- 12.1.14.2. Products
- 12.1.14.3. Company Financials
- 12.1.14.4. SWOT Analysis
- 12.1.15 Albemarle Corporation
- 12.1.15.1. Company Overview
- 12.1.15.2. Products
- 12.1.15.3. Company Financials
- 12.1.15.4. SWOT Analysis
- 12.1.16 Veolia (Veolia Water Technologies)*List Not Exhaustive
- 12.1.16.1. Company Overview
- 12.1.16.2. Products
- 12.1.16.3. Company Financials
- 12.1.16.4. SWOT Analysis
- 12.1.1 Donau Carbon GmbH
- 12.2. Market Entropy
- 12.2.1 Company's Key Areas Served
- 12.2.2 Recent Developments
- 12.3. Company Market Share Analysis 2025
- 12.3.1 Top 5 Companies Market Share Analysis
- 12.3.2 Top 3 Companies Market Share Analysis
- 12.4. List of Potential Customers
- 13. Research Methodology
List of Figures
- Figure 1: Global Activated Carbon Market Revenue Breakdown (Million, %) by Region 2025 & 2033
- Figure 2: Asia Pacific Activated Carbon Market Revenue (Million), by Product Type 2025 & 2033
- Figure 3: Asia Pacific Activated Carbon Market Revenue Share (%), by Product Type 2025 & 2033
- Figure 4: Asia Pacific Activated Carbon Market Revenue (Million), by Application 2025 & 2033
- Figure 5: Asia Pacific Activated Carbon Market Revenue Share (%), by Application 2025 & 2033
- Figure 6: Asia Pacific Activated Carbon Market Revenue (Million), by End-user Industry 2025 & 2033
- Figure 7: Asia Pacific Activated Carbon Market Revenue Share (%), by End-user Industry 2025 & 2033
- Figure 8: Asia Pacific Activated Carbon Market Revenue (Million), by Country 2025 & 2033
- Figure 9: Asia Pacific Activated Carbon Market Revenue Share (%), by Country 2025 & 2033
- Figure 10: North America Activated Carbon Market Revenue (Million), by Product Type 2025 & 2033
- Figure 11: North America Activated Carbon Market Revenue Share (%), by Product Type 2025 & 2033
- Figure 12: North America Activated Carbon Market Revenue (Million), by Application 2025 & 2033
- Figure 13: North America Activated Carbon Market Revenue Share (%), by Application 2025 & 2033
- Figure 14: North America Activated Carbon Market Revenue (Million), by End-user Industry 2025 & 2033
- Figure 15: North America Activated Carbon Market Revenue Share (%), by End-user Industry 2025 & 2033
- Figure 16: North America Activated Carbon Market Revenue (Million), by Country 2025 & 2033
- Figure 17: North America Activated Carbon Market Revenue Share (%), by Country 2025 & 2033
- Figure 18: Europe Activated Carbon Market Revenue (Million), by Product Type 2025 & 2033
- Figure 19: Europe Activated Carbon Market Revenue Share (%), by Product Type 2025 & 2033
- Figure 20: Europe Activated Carbon Market Revenue (Million), by Application 2025 & 2033
- Figure 21: Europe Activated Carbon Market Revenue Share (%), by Application 2025 & 2033
- Figure 22: Europe Activated Carbon Market Revenue (Million), by End-user Industry 2025 & 2033
- Figure 23: Europe Activated Carbon Market Revenue Share (%), by End-user Industry 2025 & 2033
- Figure 24: Europe Activated Carbon Market Revenue (Million), by Country 2025 & 2033
- Figure 25: Europe Activated Carbon Market Revenue Share (%), by Country 2025 & 2033
- Figure 26: South America Activated Carbon Market Revenue (Million), by Product Type 2025 & 2033
- Figure 27: South America Activated Carbon Market Revenue Share (%), by Product Type 2025 & 2033
- Figure 28: South America Activated Carbon Market Revenue (Million), by Application 2025 & 2033
- Figure 29: South America Activated Carbon Market Revenue Share (%), by Application 2025 & 2033
- Figure 30: South America Activated Carbon Market Revenue (Million), by End-user Industry 2025 & 2033
- Figure 31: South America Activated Carbon Market Revenue Share (%), by End-user Industry 2025 & 2033
- Figure 32: South America Activated Carbon Market Revenue (Million), by Country 2025 & 2033
- Figure 33: South America Activated Carbon Market Revenue Share (%), by Country 2025 & 2033
- Figure 34: Middle East and Africa Activated Carbon Market Revenue (Million), by Product Type 2025 & 2033
- Figure 35: Middle East and Africa Activated Carbon Market Revenue Share (%), by Product Type 2025 & 2033
- Figure 36: Middle East and Africa Activated Carbon Market Revenue (Million), by Application 2025 & 2033
- Figure 37: Middle East and Africa Activated Carbon Market Revenue Share (%), by Application 2025 & 2033
- Figure 38: Middle East and Africa Activated Carbon Market Revenue (Million), by End-user Industry 2025 & 2033
- Figure 39: Middle East and Africa Activated Carbon Market Revenue Share (%), by End-user Industry 2025 & 2033
- Figure 40: Middle East and Africa Activated Carbon Market Revenue (Million), by Country 2025 & 2033
- Figure 41: Middle East and Africa Activated Carbon Market Revenue Share (%), by Country 2025 & 2033
List of Tables
- Table 1: Global Activated Carbon Market Revenue Million Forecast, by Product Type 2020 & 2033
- Table 2: Global Activated Carbon Market Revenue Million Forecast, by Application 2020 & 2033
- Table 3: Global Activated Carbon Market Revenue Million Forecast, by End-user Industry 2020 & 2033
- Table 4: Global Activated Carbon Market Revenue Million Forecast, by Region 2020 & 2033
- Table 5: Global Activated Carbon Market Revenue Million Forecast, by Product Type 2020 & 2033
- Table 6: Global Activated Carbon Market Revenue Million Forecast, by Application 2020 & 2033
- Table 7: Global Activated Carbon Market Revenue Million Forecast, by End-user Industry 2020 & 2033
- Table 8: Global Activated Carbon Market Revenue Million Forecast, by Country 2020 & 2033
- Table 9: China Activated Carbon Market Revenue (Million) Forecast, by Application 2020 & 2033
- Table 10: India Activated Carbon Market Revenue (Million) Forecast, by Application 2020 & 2033
- Table 11: Japan Activated Carbon Market Revenue (Million) Forecast, by Application 2020 & 2033
- Table 12: South Korea Activated Carbon Market Revenue (Million) Forecast, by Application 2020 & 2033
- Table 13: Rest of Asia Pacific Activated Carbon Market Revenue (Million) Forecast, by Application 2020 & 2033
- Table 14: Global Activated Carbon Market Revenue Million Forecast, by Product Type 2020 & 2033
- Table 15: Global Activated Carbon Market Revenue Million Forecast, by Application 2020 & 2033
- Table 16: Global Activated Carbon Market Revenue Million Forecast, by End-user Industry 2020 & 2033
- Table 17: Global Activated Carbon Market Revenue Million Forecast, by Country 2020 & 2033
- Table 18: United States Activated Carbon Market Revenue (Million) Forecast, by Application 2020 & 2033
- Table 19: Canada Activated Carbon Market Revenue (Million) Forecast, by Application 2020 & 2033
- Table 20: Mexico Activated Carbon Market Revenue (Million) Forecast, by Application 2020 & 2033
- Table 21: Global Activated Carbon Market Revenue Million Forecast, by Product Type 2020 & 2033
- Table 22: Global Activated Carbon Market Revenue Million Forecast, by Application 2020 & 2033
- Table 23: Global Activated Carbon Market Revenue Million Forecast, by End-user Industry 2020 & 2033
- Table 24: Global Activated Carbon Market Revenue Million Forecast, by Country 2020 & 2033
- Table 25: Germany Activated Carbon Market Revenue (Million) Forecast, by Application 2020 & 2033
- Table 26: United Kingdom Activated Carbon Market Revenue (Million) Forecast, by Application 2020 & 2033
- Table 27: France Activated Carbon Market Revenue (Million) Forecast, by Application 2020 & 2033
- Table 28: Italy Activated Carbon Market Revenue (Million) Forecast, by Application 2020 & 2033
- Table 29: Spain Activated Carbon Market Revenue (Million) Forecast, by Application 2020 & 2033
- Table 30: Rest of Europe Activated Carbon Market Revenue (Million) Forecast, by Application 2020 & 2033
- Table 31: Global Activated Carbon Market Revenue Million Forecast, by Product Type 2020 & 2033
- Table 32: Global Activated Carbon Market Revenue Million Forecast, by Application 2020 & 2033
- Table 33: Global Activated Carbon Market Revenue Million Forecast, by End-user Industry 2020 & 2033
- Table 34: Global Activated Carbon Market Revenue Million Forecast, by Country 2020 & 2033
- Table 35: Brazil Activated Carbon Market Revenue (Million) Forecast, by Application 2020 & 2033
- Table 36: Argentina Activated Carbon Market Revenue (Million) Forecast, by Application 2020 & 2033
- Table 37: Rest of South America Activated Carbon Market Revenue (Million) Forecast, by Application 2020 & 2033
- Table 38: Global Activated Carbon Market Revenue Million Forecast, by Product Type 2020 & 2033
- Table 39: Global Activated Carbon Market Revenue Million Forecast, by Application 2020 & 2033
- Table 40: Global Activated Carbon Market Revenue Million Forecast, by End-user Industry 2020 & 2033
- Table 41: Global Activated Carbon Market Revenue Million Forecast, by Country 2020 & 2033
- Table 42: Saudi Arabia Activated Carbon Market Revenue (Million) Forecast, by Application 2020 & 2033
- Table 43: South Africa Activated Carbon Market Revenue (Million) Forecast, by Application 2020 & 2033
- Table 44: Rest of Middle East and Africa Activated Carbon Market Revenue (Million) Forecast, by Application 2020 & 2033
Frequently Asked Questions
1. What is the projected Compound Annual Growth Rate (CAGR) of the Activated Carbon Market?
The projected CAGR is approximately 5.95%.
2. Which companies are prominent players in the Activated Carbon Market?
Key companies in the market include Donau Carbon GmbH, CARBOTECH, Carbon Activated Corporation, Advanced Emissions Solutions Inc, Kuraray Co Ltd, CPL Activated Carbons, Evoqua Water Technologies LLC, Cabot Corporation, Kureha Corporation, Ingevity, Silcarbon Aktivkohle GmbH, Haycarb (Pvt ) Ltd, Puragen Activated Carbons, Jacobi Carbons Group, Albemarle Corporation, Veolia (Veolia Water Technologies)*List Not Exhaustive.
3. What are the main segments of the Activated Carbon Market?
The market segments include Product Type, Application, End-user Industry.
4. Can you provide details about the market size?
The market size is estimated to be USD 4.32 Million as of 2022.
5. What are some drivers contributing to market growth?
Conformance to Stringent Environmental Regulations in Water Treatment Applications in the United States; Augmenting Prominence for Air Pollution Control (Especially Mercury Removal).
6. What are the notable trends driving market growth?
Water Treatment Industry to Dominate the Market.
7. Are there any restraints impacting market growth?
Narrower Markets Due to Increased Costs of Some Grades of Activated Carbon; Threat of Substitutes Like Silica Gel and Development of Better Alternatives.
8. Can you provide examples of recent developments in the market?
March 2022: Cabot Corporation sold off its activated carbon unit, Norit Activated Carbon, to One Equity Partners. Following the divestiture, Norit Activated Carbon became an independent company serving its customers with a broad portfolio of activated carbon solutions through its ten production facilities in seven countries.
9. What pricing options are available for accessing the report?
Pricing options include single-user, multi-user, and enterprise licenses priced at USD 4750, USD 5250, and USD 8750 respectively.
10. Is the market size provided in terms of value or volume?
The market size is provided in terms of value, measured in Million.
11. Are there any specific market keywords associated with the report?
Yes, the market keyword associated with the report is "Activated Carbon Market," which aids in identifying and referencing the specific market segment covered.
12. How do I determine which pricing option suits my needs best?
The pricing options vary based on user requirements and access needs. Individual users may opt for single-user licenses, while businesses requiring broader access may choose multi-user or enterprise licenses for cost-effective access to the report.
13. Are there any additional resources or data provided in the Activated Carbon Market report?
While the report offers comprehensive insights, it's advisable to review the specific contents or supplementary materials provided to ascertain if additional resources or data are available.
14. How can I stay updated on further developments or reports in the Activated Carbon Market?
To stay informed about further developments, trends, and reports in the Activated Carbon Market, consider subscribing to industry newsletters, following relevant companies and organizations, or regularly checking reputable industry news sources and publications.
Methodology
Step 1 - Identification of Relevant Samples Size from Population Database


Step 2 - Approaches for Defining Global Market Size (Value, Volume* & Price*)

Note*: In applicable scenarios
Step 3 - Data Sources
Primary Research
- Web Analytics
- Survey Reports
- Research Institute
- Latest Research Reports
- Opinion Leaders
Secondary Research
- Annual Reports
- White Paper
- Latest Press Release
- Industry Association
- Paid Database
- Investor Presentations

Step 4 - Data Triangulation
Involves using different sources of information in order to increase the validity of a study
These sources are likely to be stakeholders in a program - participants, other researchers, program staff, other community members, and so on.
Then we put all data in single framework & apply various statistical tools to find out the dynamic on the market.
During the analysis stage, feedback from the stakeholder groups would be compared to determine areas of agreement as well as areas of divergence