

Key Insights
The global Polyurethane Composites Market is poised for significant expansion, projected to reach USD 870.93 million in 2025 and experience a robust Compound Annual Growth Rate (CAGR) of 5.96% throughout the forecast period of 2025-2033. This dynamic growth is fueled by the increasing demand for lightweight, durable, and high-performance materials across a multitude of industries. Key drivers include the automotive sector's continuous pursuit of fuel efficiency through material substitution, the construction industry's adoption of advanced insulation and structural components, and the burgeoning renewable energy sector's reliance on resilient wind turbine blades. The inherent versatility of polyurethane composites, allowing for customization in terms of strength, flexibility, and thermal properties, further propels their market penetration. Innovations in manufacturing processes and the development of eco-friendlier polyurethane formulations are also contributing to sustained market advancement, addressing both performance and sustainability concerns.
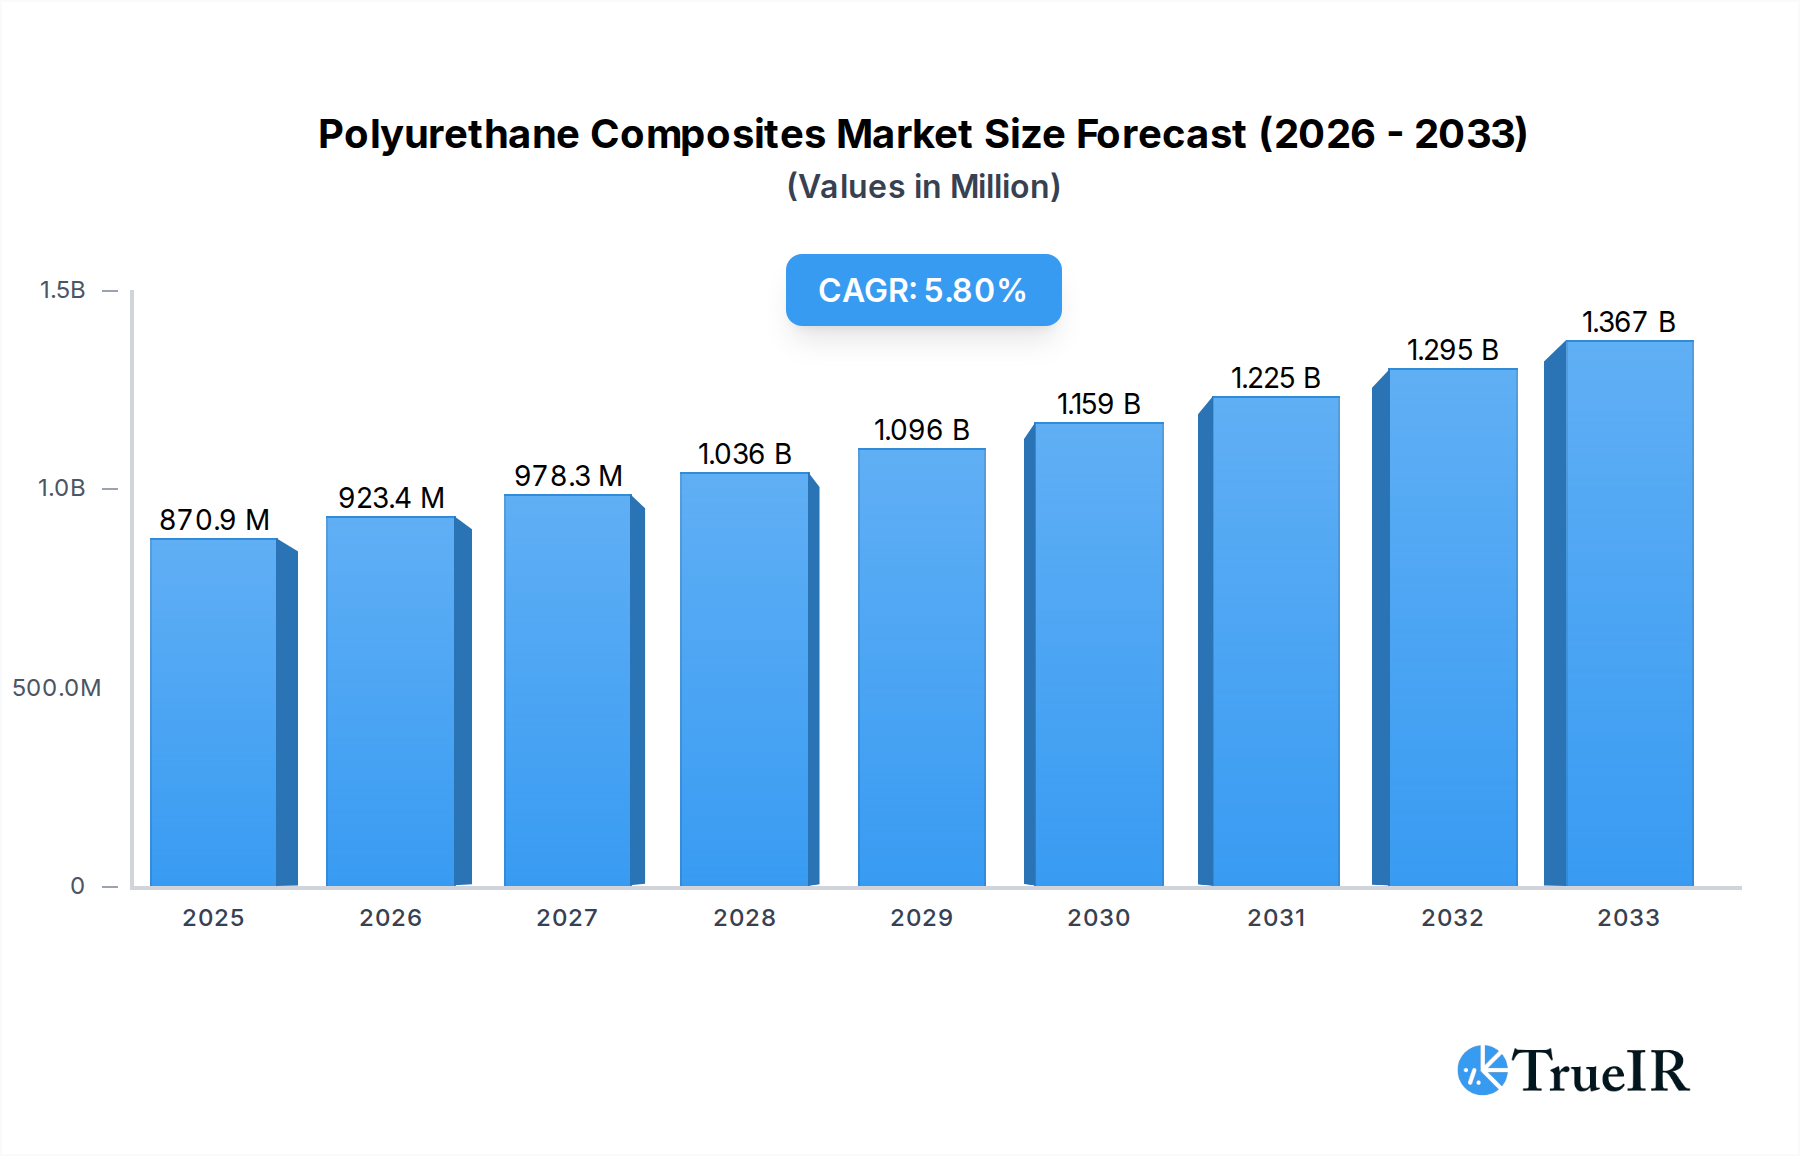
Polyurethane Composites Market Market Size (In Million)
The market's trajectory is characterized by distinct trends, including a growing preference for carbon fiber composites due to their superior strength-to-weight ratio, particularly in aerospace and high-performance transportation. Simultaneously, glass fiber composites continue to hold a significant share, offering a cost-effective and versatile solution for various applications. The electrical and electronics sector is increasingly leveraging polyurethane composites for their insulating properties and durability. While the market presents substantial opportunities, challenges such as the volatility of raw material prices and the complexities associated with end-of-life recycling of composite materials require strategic attention. Nevertheless, the overarching demand for advanced materials, coupled with ongoing technological advancements and a growing emphasis on sustainable solutions, positions the Polyurethane Composites Market for sustained and significant growth in the coming years.

Polyurethane Composites Market Company Market Share
Polyurethane Composites Market Market Structure & Competitive Landscape
The global Polyurethane Composites market exhibits a dynamic and evolving structure, characterized by moderate to high market concentration among a few key players, including ELANTAS, BASF SE, Huntsman International LLC, Linecross, Webasto Group, Henkel Corporation, and Covestro AG. Innovation serves as a primary driver, fueled by continuous research and development in enhanced material properties, sustainable formulations, and application-specific solutions. Regulatory impacts, particularly those concerning environmental sustainability and safety standards, are increasingly shaping market entry and product development.
The threat of product substitutes, such as traditional composites and advanced polymers, remains a significant factor influencing competitive dynamics. End-user segmentation across Transportation, Building & Construction, Electrical & Electronics, Wind Energy, and Others highlights the diverse application landscape. Merger and Acquisition (M&A) trends are expected to continue, with an estimated XX volume of deals in the historical period (2019-2024) as companies seek to expand their product portfolios, geographic reach, and technological capabilities. The polyurethane composites market size is projected to witness substantial growth, driven by these structural elements and emerging opportunities.
Polyurethane Composites Market Market Trends & Opportunities
The Polyurethane Composites market is poised for robust expansion, projected to grow at a Compound Annual Growth Rate (CAGR) of approximately XX% during the forecast period of 2025–2033. The global polyurethane composites market value is estimated to reach xx million by 2033, up from xx million in the base year of 2025. This significant polyurethane composites market growth is underpinned by a confluence of technological advancements, shifting consumer preferences towards lightweight and durable materials, and evolving competitive dynamics.
Technological shifts are paramount, with ongoing innovation in polyurethane resin formulations and reinforcement techniques (Glass, Carbon, and others) leading to composites with superior mechanical strength, thermal insulation, and chemical resistance. These advancements are directly addressing the growing demand for high-performance materials in critical sectors. Consumer preferences are increasingly leaning towards sustainable and eco-friendly solutions, prompting manufacturers to develop bio-based polyurethanes and explore advanced recycling methods for composite materials. This aligns with the rising environmental consciousness and stringent regulations aimed at reducing carbon footprints.
The competitive landscape is intensifying, marked by strategic collaborations, product diversification, and a focus on cost-efficiency. Companies are investing heavily in R&D to develop novel applications and improve existing ones, thereby enhancing their market penetration rates. The polyurethane composites market share is expected to see increased fragmentation as smaller, specialized players emerge, catering to niche applications and driving innovation. Emerging opportunities lie in the development of advanced composites for additive manufacturing, smart composites with integrated sensors, and high-performance materials for extreme environments. The increasing adoption of these advanced materials is a key trend that will define the polyurethane composites market outlook.
Dominant Markets & Segments in Polyurethane Composites Market
The Polyurethane Composites market demonstrates significant regional dominance and segment leadership, driven by specific industry demands and supportive policies.
Dominant Region/Country:
- Asia Pacific is anticipated to be the dominant region, propelled by rapid industrialization, extensive infrastructure development, and a burgeoning manufacturing sector. Countries like China and India are key contributors, owing to their large domestic markets and increasing investments in automotive, construction, and renewable energy sectors. Government initiatives promoting sustainable building practices and the expansion of the electric vehicle industry are further bolstering polyurethane composites market demand in this region.
Dominant Fiber Type:
- Glass Fiber currently holds the dominant position within the fiber type segment. Its widespread availability, cost-effectiveness, and favorable strength-to-weight ratio make it the preferred choice for a broad spectrum of applications.
- Key Growth Drivers for Glass Fiber:
- Transportation: Extensive use in automotive body panels, interior components, and truck trailers for weight reduction and fuel efficiency.
- Building & Construction: Applications in insulation panels, facade elements, and structural components due to its durability and thermal properties.
- Wind Energy: Integral to the manufacturing of wind turbine blades, where its strength and resilience are crucial.
- Electrical & Electronics: Used in enclosures and insulating components owing to its electrical insulation properties.
- The increasing demand for cost-effective yet high-performance materials ensures the continued dominance of glass fiber composites.
- Key Growth Drivers for Glass Fiber:
Dominant End-user Industry:
- Transportation is the leading end-user industry for polyurethane composites, a trend expected to persist and accelerate. The automotive sector, in particular, is a major consumer, driven by the imperative to reduce vehicle weight for enhanced fuel economy and reduced emissions.
- Key Growth Drivers for Transportation:
- Lightweighting Initiatives: Strong regulatory push and consumer demand for fuel-efficient and electric vehicles.
- Durability & Safety: Polyurethane composites offer excellent impact resistance and structural integrity, crucial for vehicle safety.
- Design Flexibility: Enables complex part designs, leading to improved aesthetics and functionality in vehicles.
- Aerospace Applications: Growing use in aircraft interiors and structural components for weight savings.
- Key Growth Drivers for Transportation:
- Building & Construction represents another significant and rapidly growing segment. The demand for energy-efficient buildings, durable construction materials, and rapid urbanization are key factors driving adoption.
- Key Growth Drivers for Building & Construction:
- Energy Efficiency: Use in insulation panels, roofing membranes, and façade systems to improve thermal performance.
- Infrastructure Development: Applications in bridges, tunnels, and pre-fabricated construction components.
- Durability & Weather Resistance: Excellent resistance to moisture, chemicals, and environmental degradation.
- Key Growth Drivers for Building & Construction:
- The Wind Energy sector also presents substantial growth opportunities, particularly with the global expansion of renewable energy infrastructure. Polyurethane composites are essential for the large, complex structures of wind turbine blades.
- While Electrical & Electronics and Others are also important segments, their growth trajectories are closely tied to the overall economic development and technological advancements within their respective sub-sectors. The ability of polyurethane composites to offer tailored properties, such as electrical insulation and flame retardancy, will continue to drive their adoption across all end-user industries.
Polyurethane Composites Market Product Analysis
The Polyurethane Composites market is characterized by continuous product innovation aimed at enhancing performance, sustainability, and application versatility. Advancements focus on improving mechanical properties like tensile strength, impact resistance, and durability, while also developing composites with superior thermal and acoustic insulation capabilities. Key innovations include the development of bio-based polyurethane resins derived from renewable resources, addressing growing environmental concerns and regulatory pressures for sustainable materials. Furthermore, the integration of smart functionalities, such as embedded sensors for structural health monitoring, is an emerging area of competitive advantage, enabling the creation of advanced composite materials for critical applications.
Key Drivers, Barriers & Challenges in Polyurethane Composites Market
Key Drivers:
- Lightweighting Imperative: Driven by fuel efficiency standards in transportation and energy savings in construction, creating a strong demand for high-strength, low-density polyurethane composites.
- Technological Advancements: Continuous innovation in resin formulations, reinforcement materials (e.g., advanced glass and carbon fibers), and manufacturing processes enhances material performance and expands application possibilities.
- Growing Demand for Sustainability: Increasing environmental regulations and consumer preference for eco-friendly materials are pushing for the development and adoption of bio-based and recyclable polyurethane composites.
- Infrastructure Development: Significant global investment in infrastructure projects, particularly in developing economies, fuels the demand for durable and long-lasting construction materials.
Barriers & Challenges:
- Cost Volatility of Raw Materials: Fluctuations in the prices of key raw materials like isocyanates and polyols can impact the overall cost-effectiveness of polyurethane composites, posing a challenge for widespread adoption.
- Recycling Complexity: Developing efficient and cost-effective recycling processes for thermoset polyurethane composites remains a technical hurdle, limiting their circular economy potential.
- Competition from Traditional Materials: Established materials like metals and conventional plastics offer strong competition, particularly in cost-sensitive applications.
- Skilled Labor Shortage: The specialized nature of composite manufacturing requires a skilled workforce, and a shortage of such labor can hinder production and growth.
- Regulatory Hurdles: Navigating complex and evolving environmental, health, and safety regulations across different regions can be challenging for manufacturers.
Growth Drivers in the Polyurethane Composites Market Market
The Polyurethane Composites market is propelled by several key growth drivers. The unwavering global focus on lightweighting across the transportation sector, including automotive and aerospace, for enhanced fuel efficiency and reduced emissions is a primary catalyst. Continuous technological advancements in polyurethane chemistry and fiber reinforcement technologies are yielding composites with superior mechanical properties, expanding their application scope. Furthermore, increasing governmental support for renewable energy infrastructure, particularly wind power, which heavily relies on composite materials for turbine blades, is a significant growth engine. The growing emphasis on sustainable construction and energy-efficient buildings is also driving demand for polyurethane composites in insulation, structural components, and facade elements.
Challenges Impacting Polyurethane Composites Market Growth
Despite robust growth, the Polyurethane Composites market faces several challenges. The volatility in raw material prices, particularly for petrochemical-based inputs, can impact profit margins and pricing strategies. The complexity and cost of recycling thermoset polyurethane composites pose a significant barrier to achieving full circularity. Intense competition from established materials like steel, aluminum, and traditional plastics, especially in price-sensitive segments, can limit market penetration. Moreover, developing and retaining a skilled workforce for advanced composite manufacturing remains a persistent challenge. Navigating evolving regulatory landscapes concerning environmental impact and product safety across different geographies adds another layer of complexity for market players.
Key Players Shaping the Polyurethane Composites Market Market
- ELANTAS
- BASF SE
- Huntsman International LLC
- Linecross
- Webasto Group
- Henkel Corporation
- Covestro AG
Significant Polyurethane Composites Market Industry Milestones
- 2020: Launch of advanced bio-based polyurethane resin formulations, offering enhanced sustainability profiles and performance characteristics for automotive applications.
- 2021: Significant investment in R&D by major players to develop high-performance carbon fiber reinforced polyurethane composites for aerospace and high-end automotive segments.
- 2022: Increased M&A activity focused on acquiring companies with expertise in additive manufacturing of composite materials, signaling a trend towards 3D printing solutions.
- 2023: Introduction of novel polyurethane composite systems with improved fire retardancy and thermal insulation properties, catering to the stringent demands of the building and construction industry.
- 2024: Growing emphasis on developing closed-loop recycling processes for polyurethane composites, with pilot programs initiated by industry consortia to address end-of-life challenges.
Future Outlook for Polyurethane Composites Market Market
The future outlook for the Polyurethane Composites market is highly promising, driven by sustained demand for lightweight, high-strength, and sustainable materials. Strategic opportunities lie in the continued innovation of bio-based and recyclable composites, aligning with global sustainability mandates. The expansion of electric vehicles will further boost demand for advanced composites in automotive manufacturing. Moreover, the increasing adoption of smart composites with integrated functionalities and the growing utilization of these materials in renewable energy sectors, particularly wind energy and emerging offshore applications, are key growth catalysts. The market is expected to witness further consolidation through strategic mergers and acquisitions, alongside the emergence of specialized players focusing on niche, high-value applications.
Polyurethane Composites Market Segmentation
-
1. Fiber Type
- 1.1. Glass
- 1.2. Carbon
- 1.3. Others
-
2. End-user Industry
- 2.1. Transportation
- 2.2. Building & Construction
- 2.3. Electrical & Electronics
- 2.4. Wind Energy
- 2.5. Others
Polyurethane Composites Market Segmentation By Geography
-
1. Asia Pacific
- 1.1. China
- 1.2. India
- 1.3. Japan
- 1.4. South Korea
- 1.5. Rest of Asia Pacific
-
2. North America
- 2.1. United States
- 2.2. Canada
- 2.3. Mexico
-
3. Europe
- 3.1. Germany
- 3.2. United Kingdom
- 3.3. Italy
- 3.4. France
- 3.5. Rest of Europe
-
4. South America
- 4.1. Brazil
- 4.2. Argentina
- 4.3. Rest of South America
-
5. Middle East and Africa
- 5.1. Saudi Arabia
- 5.2. South Africa
- 5.3. Rest of Middle East and Africa
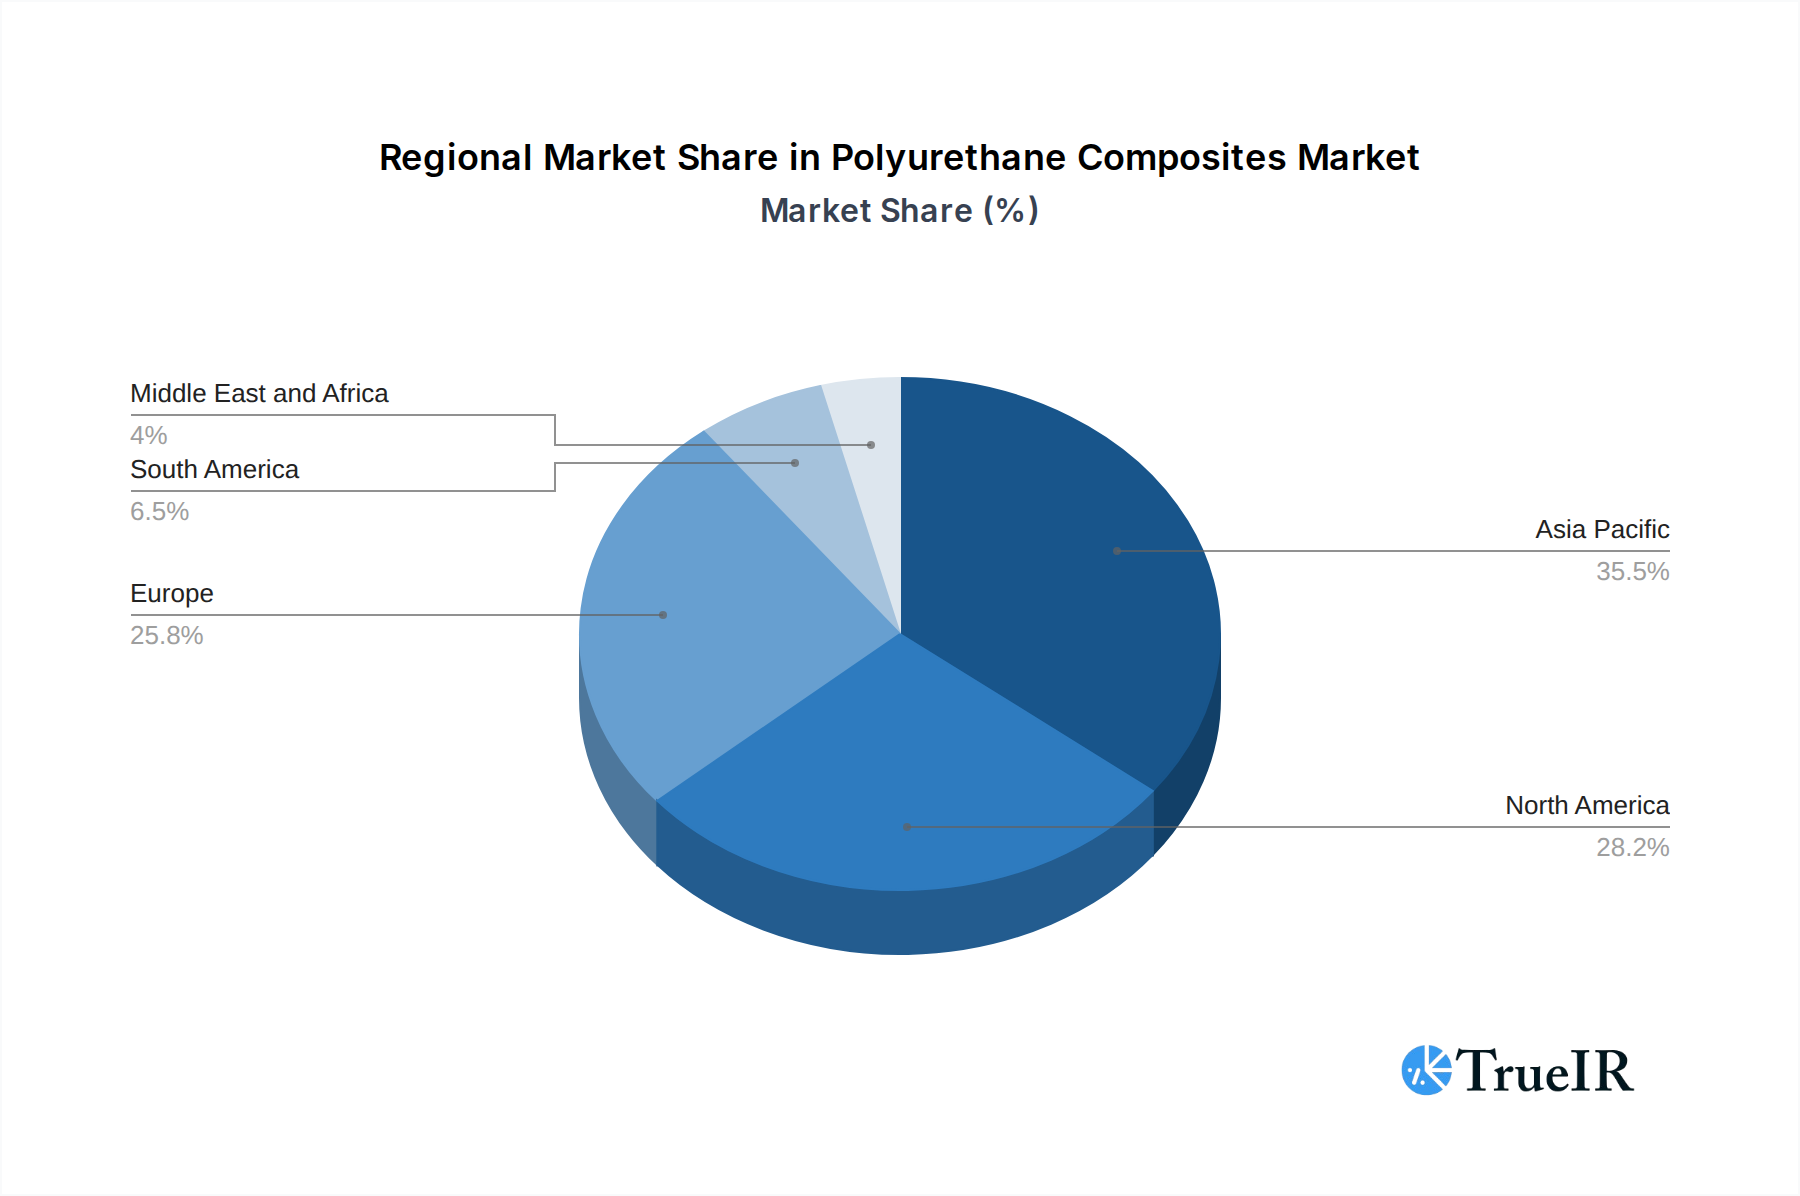
Polyurethane Composites Market Regional Market Share
Geographic Coverage of Polyurethane Composites Market
Polyurethane Composites Market REPORT HIGHLIGHTS
| Aspects | Details |
|---|---|
| Study Period | 2020-2034 |
| Base Year | 2025 |
| Estimated Year | 2026 |
| Forecast Period | 2026-2034 |
| Historical Period | 2020-2025 |
| Growth Rate | CAGR of 5.96% from 2020-2034 |
| Segmentation |
|
Table of Contents
- 1. Introduction
- 1.1. Research Scope
- 1.2. Market Segmentation
- 1.3. Research Objective
- 1.4. Definitions and Assumptions
- 2. Executive Summary
- 2.1. Market Snapshot
- 3. Market Dynamics
- 3.1. Market Drivers
- 3.2. Market Restrains
- 3.3. Market Trends
- 3.4. Market Opportunities
- 4. Market Factor Analysis
- 4.1. Porters Five Forces
- 4.1.1. Bargaining Power of Suppliers
- 4.1.2. Bargaining Power of Buyers
- 4.1.3. Threat of New Entrants
- 4.1.4. Threat of Substitutes
- 4.1.5. Competitive Rivalry
- 4.2. PESTEL analysis
- 4.3. BCG Analysis
- 4.3.1. Stars (High Growth, High Market Share)
- 4.3.2. Cash Cows (Low Growth, High Market Share)
- 4.3.3. Question Mark (High Growth, Low Market Share)
- 4.3.4. Dogs (Low Growth, Low Market Share)
- 4.4. Ansoff Matrix Analysis
- 4.5. Supply Chain Analysis
- 4.6. Regulatory Landscape
- 4.7. Current Market Potential and Opportunity Assessment (TAM–SAM–SOM Framework)
- 4.8. TIR Analyst Note
- 4.1. Porters Five Forces
- 5. Market Analysis, Insights and Forecast 2021-2033
- 5.1. Market Analysis, Insights and Forecast - by Fiber Type
- 5.1.1. Glass
- 5.1.2. Carbon
- 5.1.3. Others
- 5.2. Market Analysis, Insights and Forecast - by End-user Industry
- 5.2.1. Transportation
- 5.2.2. Building & Construction
- 5.2.3. Electrical & Electronics
- 5.2.4. Wind Energy
- 5.2.5. Others
- 5.3. Market Analysis, Insights and Forecast - by Region
- 5.3.1. Asia Pacific
- 5.3.2. North America
- 5.3.3. Europe
- 5.3.4. South America
- 5.3.5. Middle East and Africa
- 5.1. Market Analysis, Insights and Forecast - by Fiber Type
- 6. Global Polyurethane Composites Market Analysis, Insights and Forecast, 2021-2033
- 6.1. Market Analysis, Insights and Forecast - by Fiber Type
- 6.1.1. Glass
- 6.1.2. Carbon
- 6.1.3. Others
- 6.2. Market Analysis, Insights and Forecast - by End-user Industry
- 6.2.1. Transportation
- 6.2.2. Building & Construction
- 6.2.3. Electrical & Electronics
- 6.2.4. Wind Energy
- 6.2.5. Others
- 6.1. Market Analysis, Insights and Forecast - by Fiber Type
- 7. Asia Pacific Polyurethane Composites Market Analysis, Insights and Forecast, 2020-2032
- 7.1. Market Analysis, Insights and Forecast - by Fiber Type
- 7.1.1. Glass
- 7.1.2. Carbon
- 7.1.3. Others
- 7.2. Market Analysis, Insights and Forecast - by End-user Industry
- 7.2.1. Transportation
- 7.2.2. Building & Construction
- 7.2.3. Electrical & Electronics
- 7.2.4. Wind Energy
- 7.2.5. Others
- 7.1. Market Analysis, Insights and Forecast - by Fiber Type
- 8. North America Polyurethane Composites Market Analysis, Insights and Forecast, 2020-2032
- 8.1. Market Analysis, Insights and Forecast - by Fiber Type
- 8.1.1. Glass
- 8.1.2. Carbon
- 8.1.3. Others
- 8.2. Market Analysis, Insights and Forecast - by End-user Industry
- 8.2.1. Transportation
- 8.2.2. Building & Construction
- 8.2.3. Electrical & Electronics
- 8.2.4. Wind Energy
- 8.2.5. Others
- 8.1. Market Analysis, Insights and Forecast - by Fiber Type
- 9. Europe Polyurethane Composites Market Analysis, Insights and Forecast, 2020-2032
- 9.1. Market Analysis, Insights and Forecast - by Fiber Type
- 9.1.1. Glass
- 9.1.2. Carbon
- 9.1.3. Others
- 9.2. Market Analysis, Insights and Forecast - by End-user Industry
- 9.2.1. Transportation
- 9.2.2. Building & Construction
- 9.2.3. Electrical & Electronics
- 9.2.4. Wind Energy
- 9.2.5. Others
- 9.1. Market Analysis, Insights and Forecast - by Fiber Type
- 10. South America Polyurethane Composites Market Analysis, Insights and Forecast, 2020-2032
- 10.1. Market Analysis, Insights and Forecast - by Fiber Type
- 10.1.1. Glass
- 10.1.2. Carbon
- 10.1.3. Others
- 10.2. Market Analysis, Insights and Forecast - by End-user Industry
- 10.2.1. Transportation
- 10.2.2. Building & Construction
- 10.2.3. Electrical & Electronics
- 10.2.4. Wind Energy
- 10.2.5. Others
- 10.1. Market Analysis, Insights and Forecast - by Fiber Type
- 11. Middle East and Africa Polyurethane Composites Market Analysis, Insights and Forecast, 2020-2032
- 11.1. Market Analysis, Insights and Forecast - by Fiber Type
- 11.1.1. Glass
- 11.1.2. Carbon
- 11.1.3. Others
- 11.2. Market Analysis, Insights and Forecast - by End-user Industry
- 11.2.1. Transportation
- 11.2.2. Building & Construction
- 11.2.3. Electrical & Electronics
- 11.2.4. Wind Energy
- 11.2.5. Others
- 11.1. Market Analysis, Insights and Forecast - by Fiber Type
- 12. Competitive Analysis
- 12.1. Company Profiles
- 12.1.1 ELANTAS
- 12.1.1.1. Company Overview
- 12.1.1.2. Products
- 12.1.1.3. Company Financials
- 12.1.1.4. SWOT Analysis
- 12.1.2 BASF SE
- 12.1.2.1. Company Overview
- 12.1.2.2. Products
- 12.1.2.3. Company Financials
- 12.1.2.4. SWOT Analysis
- 12.1.3 Huntsman International LLC
- 12.1.3.1. Company Overview
- 12.1.3.2. Products
- 12.1.3.3. Company Financials
- 12.1.3.4. SWOT Analysis
- 12.1.4 Linecross
- 12.1.4.1. Company Overview
- 12.1.4.2. Products
- 12.1.4.3. Company Financials
- 12.1.4.4. SWOT Analysis
- 12.1.5 Webasto Group
- 12.1.5.1. Company Overview
- 12.1.5.2. Products
- 12.1.5.3. Company Financials
- 12.1.5.4. SWOT Analysis
- 12.1.6 Henkel Corporation
- 12.1.6.1. Company Overview
- 12.1.6.2. Products
- 12.1.6.3. Company Financials
- 12.1.6.4. SWOT Analysis
- 12.1.7 Covestro AG
- 12.1.7.1. Company Overview
- 12.1.7.2. Products
- 12.1.7.3. Company Financials
- 12.1.7.4. SWOT Analysis
- 12.1.1 ELANTAS
- 12.2. Market Entropy
- 12.2.1 Company's Key Areas Served
- 12.2.2 Recent Developments
- 12.3. Company Market Share Analysis 2025
- 12.3.1 Top 5 Companies Market Share Analysis
- 12.3.2 Top 3 Companies Market Share Analysis
- 12.4. List of Potential Customers
- 13. Research Methodology
List of Figures
- Figure 1: Global Polyurethane Composites Market Revenue Breakdown (million, %) by Region 2025 & 2033
- Figure 2: Global Polyurethane Composites Market Volume Breakdown (grams per cubic centimeter , %) by Region 2025 & 2033
- Figure 3: Asia Pacific Polyurethane Composites Market Revenue (million), by Fiber Type 2025 & 2033
- Figure 4: Asia Pacific Polyurethane Composites Market Volume (grams per cubic centimeter ), by Fiber Type 2025 & 2033
- Figure 5: Asia Pacific Polyurethane Composites Market Revenue Share (%), by Fiber Type 2025 & 2033
- Figure 6: Asia Pacific Polyurethane Composites Market Volume Share (%), by Fiber Type 2025 & 2033
- Figure 7: Asia Pacific Polyurethane Composites Market Revenue (million), by End-user Industry 2025 & 2033
- Figure 8: Asia Pacific Polyurethane Composites Market Volume (grams per cubic centimeter ), by End-user Industry 2025 & 2033
- Figure 9: Asia Pacific Polyurethane Composites Market Revenue Share (%), by End-user Industry 2025 & 2033
- Figure 10: Asia Pacific Polyurethane Composites Market Volume Share (%), by End-user Industry 2025 & 2033
- Figure 11: Asia Pacific Polyurethane Composites Market Revenue (million), by Country 2025 & 2033
- Figure 12: Asia Pacific Polyurethane Composites Market Volume (grams per cubic centimeter ), by Country 2025 & 2033
- Figure 13: Asia Pacific Polyurethane Composites Market Revenue Share (%), by Country 2025 & 2033
- Figure 14: Asia Pacific Polyurethane Composites Market Volume Share (%), by Country 2025 & 2033
- Figure 15: North America Polyurethane Composites Market Revenue (million), by Fiber Type 2025 & 2033
- Figure 16: North America Polyurethane Composites Market Volume (grams per cubic centimeter ), by Fiber Type 2025 & 2033
- Figure 17: North America Polyurethane Composites Market Revenue Share (%), by Fiber Type 2025 & 2033
- Figure 18: North America Polyurethane Composites Market Volume Share (%), by Fiber Type 2025 & 2033
- Figure 19: North America Polyurethane Composites Market Revenue (million), by End-user Industry 2025 & 2033
- Figure 20: North America Polyurethane Composites Market Volume (grams per cubic centimeter ), by End-user Industry 2025 & 2033
- Figure 21: North America Polyurethane Composites Market Revenue Share (%), by End-user Industry 2025 & 2033
- Figure 22: North America Polyurethane Composites Market Volume Share (%), by End-user Industry 2025 & 2033
- Figure 23: North America Polyurethane Composites Market Revenue (million), by Country 2025 & 2033
- Figure 24: North America Polyurethane Composites Market Volume (grams per cubic centimeter ), by Country 2025 & 2033
- Figure 25: North America Polyurethane Composites Market Revenue Share (%), by Country 2025 & 2033
- Figure 26: North America Polyurethane Composites Market Volume Share (%), by Country 2025 & 2033
- Figure 27: Europe Polyurethane Composites Market Revenue (million), by Fiber Type 2025 & 2033
- Figure 28: Europe Polyurethane Composites Market Volume (grams per cubic centimeter ), by Fiber Type 2025 & 2033
- Figure 29: Europe Polyurethane Composites Market Revenue Share (%), by Fiber Type 2025 & 2033
- Figure 30: Europe Polyurethane Composites Market Volume Share (%), by Fiber Type 2025 & 2033
- Figure 31: Europe Polyurethane Composites Market Revenue (million), by End-user Industry 2025 & 2033
- Figure 32: Europe Polyurethane Composites Market Volume (grams per cubic centimeter ), by End-user Industry 2025 & 2033
- Figure 33: Europe Polyurethane Composites Market Revenue Share (%), by End-user Industry 2025 & 2033
- Figure 34: Europe Polyurethane Composites Market Volume Share (%), by End-user Industry 2025 & 2033
- Figure 35: Europe Polyurethane Composites Market Revenue (million), by Country 2025 & 2033
- Figure 36: Europe Polyurethane Composites Market Volume (grams per cubic centimeter ), by Country 2025 & 2033
- Figure 37: Europe Polyurethane Composites Market Revenue Share (%), by Country 2025 & 2033
- Figure 38: Europe Polyurethane Composites Market Volume Share (%), by Country 2025 & 2033
- Figure 39: South America Polyurethane Composites Market Revenue (million), by Fiber Type 2025 & 2033
- Figure 40: South America Polyurethane Composites Market Volume (grams per cubic centimeter ), by Fiber Type 2025 & 2033
- Figure 41: South America Polyurethane Composites Market Revenue Share (%), by Fiber Type 2025 & 2033
- Figure 42: South America Polyurethane Composites Market Volume Share (%), by Fiber Type 2025 & 2033
- Figure 43: South America Polyurethane Composites Market Revenue (million), by End-user Industry 2025 & 2033
- Figure 44: South America Polyurethane Composites Market Volume (grams per cubic centimeter ), by End-user Industry 2025 & 2033
- Figure 45: South America Polyurethane Composites Market Revenue Share (%), by End-user Industry 2025 & 2033
- Figure 46: South America Polyurethane Composites Market Volume Share (%), by End-user Industry 2025 & 2033
- Figure 47: South America Polyurethane Composites Market Revenue (million), by Country 2025 & 2033
- Figure 48: South America Polyurethane Composites Market Volume (grams per cubic centimeter ), by Country 2025 & 2033
- Figure 49: South America Polyurethane Composites Market Revenue Share (%), by Country 2025 & 2033
- Figure 50: South America Polyurethane Composites Market Volume Share (%), by Country 2025 & 2033
- Figure 51: Middle East and Africa Polyurethane Composites Market Revenue (million), by Fiber Type 2025 & 2033
- Figure 52: Middle East and Africa Polyurethane Composites Market Volume (grams per cubic centimeter ), by Fiber Type 2025 & 2033
- Figure 53: Middle East and Africa Polyurethane Composites Market Revenue Share (%), by Fiber Type 2025 & 2033
- Figure 54: Middle East and Africa Polyurethane Composites Market Volume Share (%), by Fiber Type 2025 & 2033
- Figure 55: Middle East and Africa Polyurethane Composites Market Revenue (million), by End-user Industry 2025 & 2033
- Figure 56: Middle East and Africa Polyurethane Composites Market Volume (grams per cubic centimeter ), by End-user Industry 2025 & 2033
- Figure 57: Middle East and Africa Polyurethane Composites Market Revenue Share (%), by End-user Industry 2025 & 2033
- Figure 58: Middle East and Africa Polyurethane Composites Market Volume Share (%), by End-user Industry 2025 & 2033
- Figure 59: Middle East and Africa Polyurethane Composites Market Revenue (million), by Country 2025 & 2033
- Figure 60: Middle East and Africa Polyurethane Composites Market Volume (grams per cubic centimeter ), by Country 2025 & 2033
- Figure 61: Middle East and Africa Polyurethane Composites Market Revenue Share (%), by Country 2025 & 2033
- Figure 62: Middle East and Africa Polyurethane Composites Market Volume Share (%), by Country 2025 & 2033
List of Tables
- Table 1: Global Polyurethane Composites Market Revenue million Forecast, by Fiber Type 2020 & 2033
- Table 2: Global Polyurethane Composites Market Volume grams per cubic centimeter Forecast, by Fiber Type 2020 & 2033
- Table 3: Global Polyurethane Composites Market Revenue million Forecast, by End-user Industry 2020 & 2033
- Table 4: Global Polyurethane Composites Market Volume grams per cubic centimeter Forecast, by End-user Industry 2020 & 2033
- Table 5: Global Polyurethane Composites Market Revenue million Forecast, by Region 2020 & 2033
- Table 6: Global Polyurethane Composites Market Volume grams per cubic centimeter Forecast, by Region 2020 & 2033
- Table 7: Global Polyurethane Composites Market Revenue million Forecast, by Fiber Type 2020 & 2033
- Table 8: Global Polyurethane Composites Market Volume grams per cubic centimeter Forecast, by Fiber Type 2020 & 2033
- Table 9: Global Polyurethane Composites Market Revenue million Forecast, by End-user Industry 2020 & 2033
- Table 10: Global Polyurethane Composites Market Volume grams per cubic centimeter Forecast, by End-user Industry 2020 & 2033
- Table 11: Global Polyurethane Composites Market Revenue million Forecast, by Country 2020 & 2033
- Table 12: Global Polyurethane Composites Market Volume grams per cubic centimeter Forecast, by Country 2020 & 2033
- Table 13: China Polyurethane Composites Market Revenue (million) Forecast, by Application 2020 & 2033
- Table 14: China Polyurethane Composites Market Volume (grams per cubic centimeter ) Forecast, by Application 2020 & 2033
- Table 15: India Polyurethane Composites Market Revenue (million) Forecast, by Application 2020 & 2033
- Table 16: India Polyurethane Composites Market Volume (grams per cubic centimeter ) Forecast, by Application 2020 & 2033
- Table 17: Japan Polyurethane Composites Market Revenue (million) Forecast, by Application 2020 & 2033
- Table 18: Japan Polyurethane Composites Market Volume (grams per cubic centimeter ) Forecast, by Application 2020 & 2033
- Table 19: South Korea Polyurethane Composites Market Revenue (million) Forecast, by Application 2020 & 2033
- Table 20: South Korea Polyurethane Composites Market Volume (grams per cubic centimeter ) Forecast, by Application 2020 & 2033
- Table 21: Rest of Asia Pacific Polyurethane Composites Market Revenue (million) Forecast, by Application 2020 & 2033
- Table 22: Rest of Asia Pacific Polyurethane Composites Market Volume (grams per cubic centimeter ) Forecast, by Application 2020 & 2033
- Table 23: Global Polyurethane Composites Market Revenue million Forecast, by Fiber Type 2020 & 2033
- Table 24: Global Polyurethane Composites Market Volume grams per cubic centimeter Forecast, by Fiber Type 2020 & 2033
- Table 25: Global Polyurethane Composites Market Revenue million Forecast, by End-user Industry 2020 & 2033
- Table 26: Global Polyurethane Composites Market Volume grams per cubic centimeter Forecast, by End-user Industry 2020 & 2033
- Table 27: Global Polyurethane Composites Market Revenue million Forecast, by Country 2020 & 2033
- Table 28: Global Polyurethane Composites Market Volume grams per cubic centimeter Forecast, by Country 2020 & 2033
- Table 29: United States Polyurethane Composites Market Revenue (million) Forecast, by Application 2020 & 2033
- Table 30: United States Polyurethane Composites Market Volume (grams per cubic centimeter ) Forecast, by Application 2020 & 2033
- Table 31: Canada Polyurethane Composites Market Revenue (million) Forecast, by Application 2020 & 2033
- Table 32: Canada Polyurethane Composites Market Volume (grams per cubic centimeter ) Forecast, by Application 2020 & 2033
- Table 33: Mexico Polyurethane Composites Market Revenue (million) Forecast, by Application 2020 & 2033
- Table 34: Mexico Polyurethane Composites Market Volume (grams per cubic centimeter ) Forecast, by Application 2020 & 2033
- Table 35: Global Polyurethane Composites Market Revenue million Forecast, by Fiber Type 2020 & 2033
- Table 36: Global Polyurethane Composites Market Volume grams per cubic centimeter Forecast, by Fiber Type 2020 & 2033
- Table 37: Global Polyurethane Composites Market Revenue million Forecast, by End-user Industry 2020 & 2033
- Table 38: Global Polyurethane Composites Market Volume grams per cubic centimeter Forecast, by End-user Industry 2020 & 2033
- Table 39: Global Polyurethane Composites Market Revenue million Forecast, by Country 2020 & 2033
- Table 40: Global Polyurethane Composites Market Volume grams per cubic centimeter Forecast, by Country 2020 & 2033
- Table 41: Germany Polyurethane Composites Market Revenue (million) Forecast, by Application 2020 & 2033
- Table 42: Germany Polyurethane Composites Market Volume (grams per cubic centimeter ) Forecast, by Application 2020 & 2033
- Table 43: United Kingdom Polyurethane Composites Market Revenue (million) Forecast, by Application 2020 & 2033
- Table 44: United Kingdom Polyurethane Composites Market Volume (grams per cubic centimeter ) Forecast, by Application 2020 & 2033
- Table 45: Italy Polyurethane Composites Market Revenue (million) Forecast, by Application 2020 & 2033
- Table 46: Italy Polyurethane Composites Market Volume (grams per cubic centimeter ) Forecast, by Application 2020 & 2033
- Table 47: France Polyurethane Composites Market Revenue (million) Forecast, by Application 2020 & 2033
- Table 48: France Polyurethane Composites Market Volume (grams per cubic centimeter ) Forecast, by Application 2020 & 2033
- Table 49: Rest of Europe Polyurethane Composites Market Revenue (million) Forecast, by Application 2020 & 2033
- Table 50: Rest of Europe Polyurethane Composites Market Volume (grams per cubic centimeter ) Forecast, by Application 2020 & 2033
- Table 51: Global Polyurethane Composites Market Revenue million Forecast, by Fiber Type 2020 & 2033
- Table 52: Global Polyurethane Composites Market Volume grams per cubic centimeter Forecast, by Fiber Type 2020 & 2033
- Table 53: Global Polyurethane Composites Market Revenue million Forecast, by End-user Industry 2020 & 2033
- Table 54: Global Polyurethane Composites Market Volume grams per cubic centimeter Forecast, by End-user Industry 2020 & 2033
- Table 55: Global Polyurethane Composites Market Revenue million Forecast, by Country 2020 & 2033
- Table 56: Global Polyurethane Composites Market Volume grams per cubic centimeter Forecast, by Country 2020 & 2033
- Table 57: Brazil Polyurethane Composites Market Revenue (million) Forecast, by Application 2020 & 2033
- Table 58: Brazil Polyurethane Composites Market Volume (grams per cubic centimeter ) Forecast, by Application 2020 & 2033
- Table 59: Argentina Polyurethane Composites Market Revenue (million) Forecast, by Application 2020 & 2033
- Table 60: Argentina Polyurethane Composites Market Volume (grams per cubic centimeter ) Forecast, by Application 2020 & 2033
- Table 61: Rest of South America Polyurethane Composites Market Revenue (million) Forecast, by Application 2020 & 2033
- Table 62: Rest of South America Polyurethane Composites Market Volume (grams per cubic centimeter ) Forecast, by Application 2020 & 2033
- Table 63: Global Polyurethane Composites Market Revenue million Forecast, by Fiber Type 2020 & 2033
- Table 64: Global Polyurethane Composites Market Volume grams per cubic centimeter Forecast, by Fiber Type 2020 & 2033
- Table 65: Global Polyurethane Composites Market Revenue million Forecast, by End-user Industry 2020 & 2033
- Table 66: Global Polyurethane Composites Market Volume grams per cubic centimeter Forecast, by End-user Industry 2020 & 2033
- Table 67: Global Polyurethane Composites Market Revenue million Forecast, by Country 2020 & 2033
- Table 68: Global Polyurethane Composites Market Volume grams per cubic centimeter Forecast, by Country 2020 & 2033
- Table 69: Saudi Arabia Polyurethane Composites Market Revenue (million) Forecast, by Application 2020 & 2033
- Table 70: Saudi Arabia Polyurethane Composites Market Volume (grams per cubic centimeter ) Forecast, by Application 2020 & 2033
- Table 71: South Africa Polyurethane Composites Market Revenue (million) Forecast, by Application 2020 & 2033
- Table 72: South Africa Polyurethane Composites Market Volume (grams per cubic centimeter ) Forecast, by Application 2020 & 2033
- Table 73: Rest of Middle East and Africa Polyurethane Composites Market Revenue (million) Forecast, by Application 2020 & 2033
- Table 74: Rest of Middle East and Africa Polyurethane Composites Market Volume (grams per cubic centimeter ) Forecast, by Application 2020 & 2033
Frequently Asked Questions
1. What is the projected Compound Annual Growth Rate (CAGR) of the Polyurethane Composites Market?
The projected CAGR is approximately 5.96%.
2. Which companies are prominent players in the Polyurethane Composites Market?
Key companies in the market include ELANTAS, BASF SE, Huntsman International LLC, Linecross, Webasto Group, Henkel Corporation, Covestro AG.
3. What are the main segments of the Polyurethane Composites Market?
The market segments include Fiber Type, End-user Industry.
4. Can you provide details about the market size?
The market size is estimated to be USD 870.93 million as of 2022.
5. What are some drivers contributing to market growth?
; Increasing Demand for the Lightweight Materials From the Transportation Industry; Growing Demand from the Building and Construction Industry.
6. What are the notable trends driving market growth?
Increasing demand from the Transportation Industry.
7. Are there any restraints impacting market growth?
; Slowdown in the Global Automotive Production; High Production Costs.
8. Can you provide examples of recent developments in the market?
N/A
9. What pricing options are available for accessing the report?
Pricing options include single-user, multi-user, and enterprise licenses priced at USD 4750, USD 5250, and USD 8750 respectively.
10. Is the market size provided in terms of value or volume?
The market size is provided in terms of value, measured in million and volume, measured in grams per cubic centimeter .
11. Are there any specific market keywords associated with the report?
Yes, the market keyword associated with the report is "Polyurethane Composites Market," which aids in identifying and referencing the specific market segment covered.
12. How do I determine which pricing option suits my needs best?
The pricing options vary based on user requirements and access needs. Individual users may opt for single-user licenses, while businesses requiring broader access may choose multi-user or enterprise licenses for cost-effective access to the report.
13. Are there any additional resources or data provided in the Polyurethane Composites Market report?
While the report offers comprehensive insights, it's advisable to review the specific contents or supplementary materials provided to ascertain if additional resources or data are available.
14. How can I stay updated on further developments or reports in the Polyurethane Composites Market?
To stay informed about further developments, trends, and reports in the Polyurethane Composites Market, consider subscribing to industry newsletters, following relevant companies and organizations, or regularly checking reputable industry news sources and publications.
Methodology
Step 1 - Identification of Relevant Samples Size from Population Database


Step 2 - Approaches for Defining Global Market Size (Value, Volume* & Price*)

Note*: In applicable scenarios
Step 3 - Data Sources
Primary Research
- Web Analytics
- Survey Reports
- Research Institute
- Latest Research Reports
- Opinion Leaders
Secondary Research
- Annual Reports
- White Paper
- Latest Press Release
- Industry Association
- Paid Database
- Investor Presentations

Step 4 - Data Triangulation
Involves using different sources of information in order to increase the validity of a study
These sources are likely to be stakeholders in a program - participants, other researchers, program staff, other community members, and so on.
Then we put all data in single framework & apply various statistical tools to find out the dynamic on the market.
During the analysis stage, feedback from the stakeholder groups would be compared to determine areas of agreement as well as areas of divergence