

Key Insights
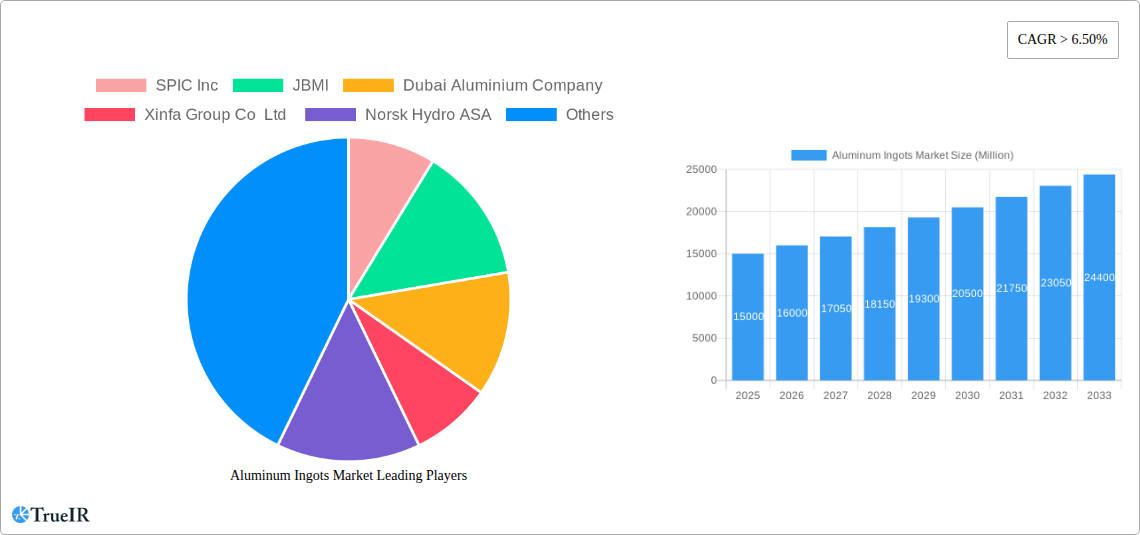
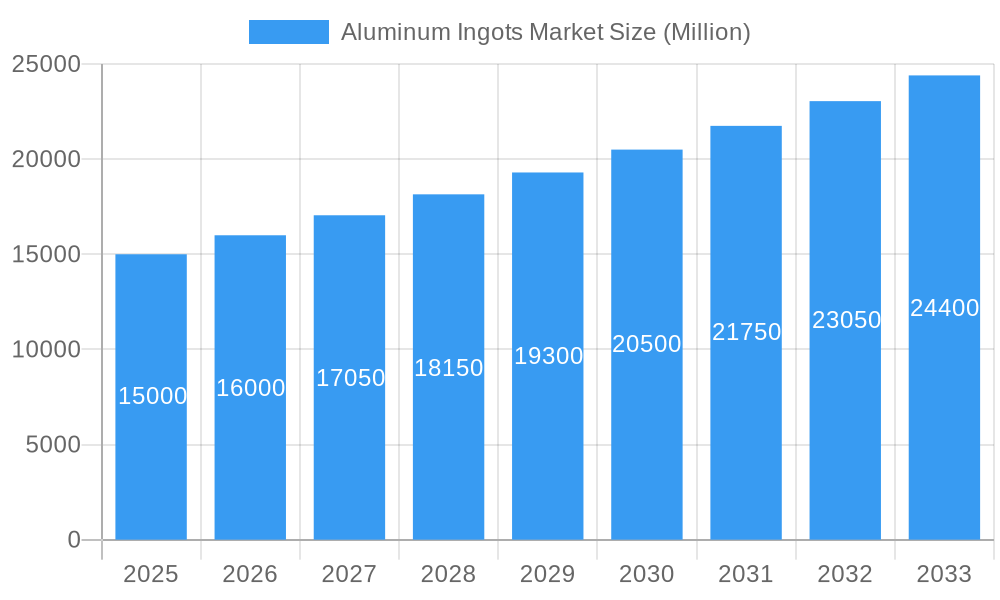
The global aluminum ingots market is experiencing robust growth, projected to maintain a Compound Annual Growth Rate (CAGR) exceeding 6.50% from 2025 to 2033. This expansion is fueled by several key drivers. The burgeoning automotive industry's increasing demand for lightweight materials in vehicle manufacturing significantly contributes to market growth. Similarly, the aerospace sector's reliance on aluminum for aircraft construction and components fuels this demand. The construction industry, a major consumer of aluminum, also contributes to market expansion due to ongoing infrastructure projects globally. Furthermore, the rise of the electrical and electronics industry, with its increasing need for aluminum in power transmission and consumer electronics, further bolsters market growth. Technological advancements in aluminum production, leading to improved efficiency and reduced costs, also support this positive trend. While supply chain disruptions and fluctuations in raw material prices pose potential challenges, the overall market outlook remains positive, driven by consistent demand from diverse end-user industries.
Aluminum Ingots Market Market Size (In Billion)
Geographic distribution reveals a dynamic market landscape. North America and Europe, while mature markets, continue to contribute significantly to the overall demand, driven by strong industrial bases and ongoing infrastructure development. However, the Asia-Pacific region, particularly China and India, are experiencing explosive growth, largely due to rapid industrialization and urbanization. These regions are projected to become major growth drivers in the coming years, fueled by increased automotive production and infrastructure investment. The South American and MEA markets, while currently smaller contributors, show potential for future expansion as their economies develop and industrialization increases. Competition among major players like Alcoa, Rio Tinto, Rusal, and Chinese producers, creates a dynamic market with opportunities for both established and emerging companies. Innovation in aluminum alloys and production techniques will play a crucial role in shaping the competitive landscape and driving future growth.
Aluminum Ingots Market Company Market Share
Aluminum Ingots Market: A Comprehensive Report (2019-2033)
This dynamic report provides a detailed analysis of the global Aluminum Ingots Market, offering invaluable insights for stakeholders across the industry. Leveraging extensive research and data covering the period 2019-2033 (Base Year: 2025, Forecast Period: 2025-2033), this report dissects market trends, competitive dynamics, and future growth potential. With a focus on key players like Alcoa Inc, Rio Tinto Group, and Norsk Hydro ASA, this report is essential for strategic decision-making and competitive advantage. The report covers a market expected to reach xx Million by 2033, exhibiting a significant CAGR of xx%.
Aluminum Ingots Market Structure & Competitive Landscape
The Aluminum Ingots market exhibits a moderately concentrated structure, with a few major players holding significant market share. The Herfindahl-Hirschman Index (HHI) is estimated at xx, indicating a moderately competitive landscape. Innovation in aluminum alloys, particularly those focused on enhanced strength, lightweight properties, and corrosion resistance, drives market growth. Stringent environmental regulations concerning carbon emissions and recycling mandates significantly influence production processes and investment strategies. Aluminum ingots face competition from alternative materials such as steel and plastics in specific applications. However, aluminum's lightweight nature, recyclability, and conductivity maintain its strong position in several sectors.
Market Segmentation:
The market is primarily segmented by end-user industry:
- Automotive
- Aerospace
- Building and Construction
- Semiconductor
- Electrical and Electronics
- Other End-user Industries
M&A Activity: Recent years have witnessed several mergers and acquisitions, primarily focused on consolidating upstream operations (mining and smelting) and expanding downstream processing capabilities. The total value of M&A transactions in the period 2019-2024 is estimated at xx Million. These activities aimed to enhance economies of scale, secure raw material supply chains, and improve technological capabilities.
Aluminum Ingots Market Trends & Opportunities
The global aluminum ingots market is experiencing robust growth, driven by increasing demand across diverse end-use sectors. The market size is projected to reach xx Million by 2033, exhibiting a CAGR of xx% during the forecast period (2025-2033). Technological advancements in aluminum alloy development are enhancing material properties, leading to wider adoption in lightweight automotive components, advanced aerospace structures, and energy-efficient building materials. Consumer preferences towards sustainable and recyclable materials further bolster market demand. However, fluctuating raw material prices and global economic uncertainties remain key challenges. Competitive dynamics are shaped by ongoing innovation, production cost optimization, and the adoption of sustainable manufacturing practices. Market penetration is increasing across emerging economies, particularly in construction and automotive sectors, driven by infrastructure development and rising disposable incomes. Furthermore, the trend towards electric vehicles is significantly boosting the demand for aluminum in automotive applications.
Dominant Markets & Segments in Aluminum Ingots Market
The Asia-Pacific region currently dominates the global aluminum ingots market, driven primarily by robust growth in China and India. China's expanding construction sector and increasing automotive production play a crucial role in this dominance.
Key Growth Drivers:
- Infrastructure Development: Large-scale infrastructure projects in emerging economies are driving significant demand.
- Automotive Industry Growth: The rising production of lightweight vehicles and electric vehicles is fueling the need for aluminum ingots.
- Government Policies: Supportive government policies promoting sustainable materials and energy efficiency are boosting market growth.
- Building & Construction Expansion: The booming construction sector in developing countries significantly contributes to market demand.
Detailed analysis reveals that the Automotive segment holds the largest market share among the end-user industries, followed by the Building and Construction sector. This is driven by the increasing adoption of aluminum alloys in lightweight vehicles and sustainable building materials.
Aluminum Ingots Market Product Analysis
Aluminum ingots are available in various grades and alloys, each tailored to specific applications. Product innovations are centered on enhancing material properties like strength-to-weight ratio, corrosion resistance, and formability. This is achieved through advancements in alloy compositions and processing techniques. The market witnesses ongoing competition based on product quality, price competitiveness, and delivery reliability. The technological advancements significantly improve market fit by addressing specific industry needs and expanding application possibilities.
Key Drivers, Barriers & Challenges in Aluminum Ingots Market
Key Drivers:
Technological advancements driving efficiency in production, stringent environmental regulations encouraging recycling and sustainable practices, and increasing demand from various industries are key growth drivers. The transition to electric vehicles significantly fuels this growth.
Key Challenges:
Fluctuating raw material prices (bauxite and alumina), geopolitical instability impacting supply chains, and intense competition from alternative materials pose significant challenges. Moreover, achieving sustainable and environmentally friendly manufacturing practices adds to operational costs. The potential impact of these factors on market growth is estimated at xx Million annually.
Growth Drivers in the Aluminum Ingots Market Market
The global aluminum ingots market is driven by robust growth across various end-use sectors. The automotive, aerospace, and construction industries are key contributors. Technological advancements are leading to the development of lighter, stronger, and more sustainable aluminum alloys. Supportive government policies are also pushing the market further.
Challenges Impacting Aluminum Ingots Market Growth
Challenges facing the aluminum ingots market include fluctuating raw material prices, geopolitical risks affecting supply chains, and intense competition from substitute materials. These factors can impact production costs and market profitability. Furthermore, the stringent environmental regulations introduce complexities and costs to achieve sustainability targets.
Key Players Shaping the Aluminum Ingots Market Market
- SPIC Inc
- JBMI
- Dubai Aluminium Company
- Xinfa Group Co Ltd
- Norsk Hydro ASA
- Aluminum Corporation of China Limited (Chalco)
- BHP Billiton
- United Company
- Rio Tinto Group
- CHINA ZHONGWANG HOLDINGS LIMITED
- RUSAL Plc
- Alcoa Inc
- Hindalco Industries Ltd
- Aluminium Bahrain
Significant Aluminum Ingots Market Industry Milestones
July 2022: Alcoa Corporation announced plans to expand casting capabilities at its Deschambault smelter in Canada, adding standard ingot production. This expansion enhances the company's production capacity and product offerings.
August 2022: Rio Tinto invested USD 29 Million in a new aluminum recycling facility at its Arvida Plant. This investment supports the company's commitment to sustainable aluminum production and expands its low-carbon aluminum solutions.
Future Outlook for Aluminum Ingots Market Market
The aluminum ingots market is poised for continued growth, driven by increasing demand from key industries and technological advancements. Strategic opportunities exist in developing innovative aluminum alloys, optimizing production processes, and expanding into emerging markets. The market's future success hinges on addressing sustainability concerns and navigating fluctuating raw material prices. The market is expected to witness further consolidation through M&A activities.
Aluminum Ingots Market Segmentation
-
1. End-user Industry
- 1.1. Automotive
- 1.2. Aerospace
- 1.3. Building and Construction
- 1.4. Semiconductor
- 1.5. Electrical and Electronics
- 1.6. Other End-user Industries
Aluminum Ingots Market Segmentation By Geography
-
1. Asia Pacific
- 1.1. China
- 1.2. India
- 1.3. Japan
- 1.4. South Korea
- 1.5. Rest of Asia Pacific
-
2. North America
- 2.1. United States
- 2.2. Canada
- 2.3. Mexico
-
3. Europe
- 3.1. Germany
- 3.2. United Kingdom
- 3.3. Italy
- 3.4. France
- 3.5. Rest of Europe
-
4. South America
- 4.1. Brazil
- 4.2. Argentina
- 4.3. Rest of South America
-
5. Middle East and Africa
- 5.1. Saudi Arabia
- 5.2. South Africa
- 5.3. Rest of Middle East and Africa
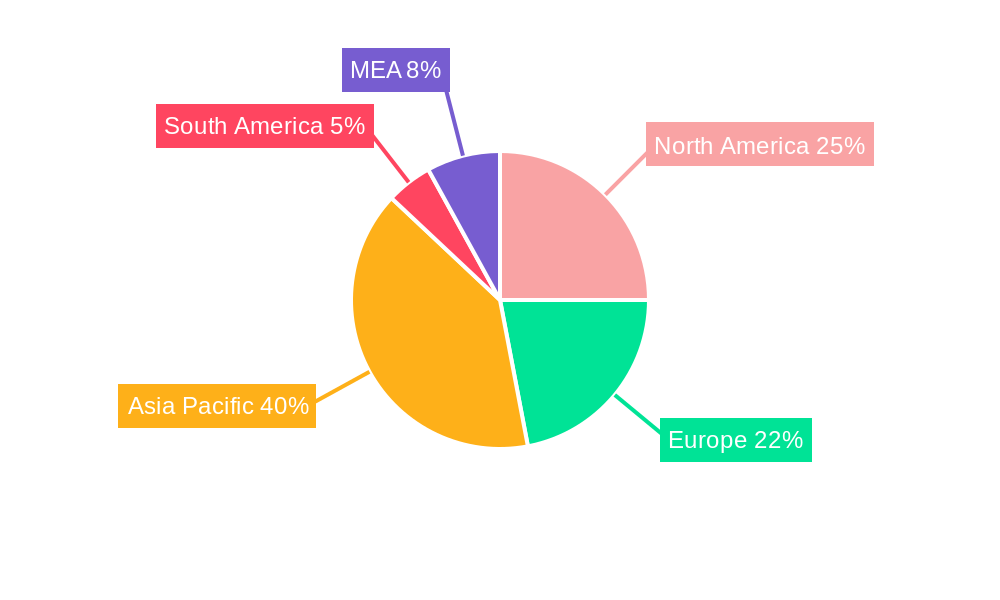
Aluminum Ingots Market Regional Market Share
Geographic Coverage of Aluminum Ingots Market
Aluminum Ingots Market REPORT HIGHLIGHTS
| Aspects | Details |
|---|---|
| Study Period | 2020-2034 |
| Base Year | 2025 |
| Estimated Year | 2026 |
| Forecast Period | 2026-2034 |
| Historical Period | 2020-2025 |
| Growth Rate | CAGR of > 6.50% from 2020-2034 |
| Segmentation |
|
Table of Contents
- 1. Introduction
- 1.1. Research Scope
- 1.2. Market Segmentation
- 1.3. Research Objective
- 1.4. Definitions and Assumptions
- 2. Executive Summary
- 2.1. Market Snapshot
- 3. Market Dynamics
- 3.1. Market Drivers
- 3.2. Market Restrains
- 3.3. Market Trends
- 3.4. Market Opportunities
- 4. Market Factor Analysis
- 4.1. Porters Five Forces
- 4.1.1. Bargaining Power of Suppliers
- 4.1.2. Bargaining Power of Buyers
- 4.1.3. Threat of New Entrants
- 4.1.4. Threat of Substitutes
- 4.1.5. Competitive Rivalry
- 4.2. PESTEL analysis
- 4.3. BCG Analysis
- 4.3.1. Stars (High Growth, High Market Share)
- 4.3.2. Cash Cows (Low Growth, High Market Share)
- 4.3.3. Question Mark (High Growth, Low Market Share)
- 4.3.4. Dogs (Low Growth, Low Market Share)
- 4.4. Ansoff Matrix Analysis
- 4.5. Supply Chain Analysis
- 4.6. Regulatory Landscape
- 4.7. Current Market Potential and Opportunity Assessment (TAM–SAM–SOM Framework)
- 4.8. TIR Analyst Note
- 4.1. Porters Five Forces
- 5. Market Analysis, Insights and Forecast 2021-2033
- 5.1. Market Analysis, Insights and Forecast - by End-user Industry
- 5.1.1. Automotive
- 5.1.2. Aerospace
- 5.1.3. Building and Construction
- 5.1.4. Semiconductor
- 5.1.5. Electrical and Electronics
- 5.1.6. Other End-user Industries
- 5.2. Market Analysis, Insights and Forecast - by Region
- 5.2.1. Asia Pacific
- 5.2.2. North America
- 5.2.3. Europe
- 5.2.4. South America
- 5.2.5. Middle East and Africa
- 5.1. Market Analysis, Insights and Forecast - by End-user Industry
- 6. Global Aluminum Ingots Market Analysis, Insights and Forecast, 2021-2033
- 6.1. Market Analysis, Insights and Forecast - by End-user Industry
- 6.1.1. Automotive
- 6.1.2. Aerospace
- 6.1.3. Building and Construction
- 6.1.4. Semiconductor
- 6.1.5. Electrical and Electronics
- 6.1.6. Other End-user Industries
- 6.1. Market Analysis, Insights and Forecast - by End-user Industry
- 7. Asia Pacific Aluminum Ingots Market Analysis, Insights and Forecast, 2020-2032
- 7.1. Market Analysis, Insights and Forecast - by End-user Industry
- 7.1.1. Automotive
- 7.1.2. Aerospace
- 7.1.3. Building and Construction
- 7.1.4. Semiconductor
- 7.1.5. Electrical and Electronics
- 7.1.6. Other End-user Industries
- 7.1. Market Analysis, Insights and Forecast - by End-user Industry
- 8. North America Aluminum Ingots Market Analysis, Insights and Forecast, 2020-2032
- 8.1. Market Analysis, Insights and Forecast - by End-user Industry
- 8.1.1. Automotive
- 8.1.2. Aerospace
- 8.1.3. Building and Construction
- 8.1.4. Semiconductor
- 8.1.5. Electrical and Electronics
- 8.1.6. Other End-user Industries
- 8.1. Market Analysis, Insights and Forecast - by End-user Industry
- 9. Europe Aluminum Ingots Market Analysis, Insights and Forecast, 2020-2032
- 9.1. Market Analysis, Insights and Forecast - by End-user Industry
- 9.1.1. Automotive
- 9.1.2. Aerospace
- 9.1.3. Building and Construction
- 9.1.4. Semiconductor
- 9.1.5. Electrical and Electronics
- 9.1.6. Other End-user Industries
- 9.1. Market Analysis, Insights and Forecast - by End-user Industry
- 10. South America Aluminum Ingots Market Analysis, Insights and Forecast, 2020-2032
- 10.1. Market Analysis, Insights and Forecast - by End-user Industry
- 10.1.1. Automotive
- 10.1.2. Aerospace
- 10.1.3. Building and Construction
- 10.1.4. Semiconductor
- 10.1.5. Electrical and Electronics
- 10.1.6. Other End-user Industries
- 10.1. Market Analysis, Insights and Forecast - by End-user Industry
- 11. Middle East and Africa Aluminum Ingots Market Analysis, Insights and Forecast, 2020-2032
- 11.1. Market Analysis, Insights and Forecast - by End-user Industry
- 11.1.1. Automotive
- 11.1.2. Aerospace
- 11.1.3. Building and Construction
- 11.1.4. Semiconductor
- 11.1.5. Electrical and Electronics
- 11.1.6. Other End-user Industries
- 11.1. Market Analysis, Insights and Forecast - by End-user Industry
- 12. Competitive Analysis
- 12.1. Company Profiles
- 12.1.1 SPIC Inc
- 12.1.1.1. Company Overview
- 12.1.1.2. Products
- 12.1.1.3. Company Financials
- 12.1.1.4. SWOT Analysis
- 12.1.2 JBMI
- 12.1.2.1. Company Overview
- 12.1.2.2. Products
- 12.1.2.3. Company Financials
- 12.1.2.4. SWOT Analysis
- 12.1.3 Dubai Aluminium Company
- 12.1.3.1. Company Overview
- 12.1.3.2. Products
- 12.1.3.3. Company Financials
- 12.1.3.4. SWOT Analysis
- 12.1.4 Xinfa Group Co Ltd
- 12.1.4.1. Company Overview
- 12.1.4.2. Products
- 12.1.4.3. Company Financials
- 12.1.4.4. SWOT Analysis
- 12.1.5 Norsk Hydro ASA
- 12.1.5.1. Company Overview
- 12.1.5.2. Products
- 12.1.5.3. Company Financials
- 12.1.5.4. SWOT Analysis
- 12.1.6 Aluminum Corporation of China Limited (Chalco)
- 12.1.6.1. Company Overview
- 12.1.6.2. Products
- 12.1.6.3. Company Financials
- 12.1.6.4. SWOT Analysis
- 12.1.7 BHP Billiton
- 12.1.7.1. Company Overview
- 12.1.7.2. Products
- 12.1.7.3. Company Financials
- 12.1.7.4. SWOT Analysis
- 12.1.8 United Company
- 12.1.8.1. Company Overview
- 12.1.8.2. Products
- 12.1.8.3. Company Financials
- 12.1.8.4. SWOT Analysis
- 12.1.9 Rio Tinto Group
- 12.1.9.1. Company Overview
- 12.1.9.2. Products
- 12.1.9.3. Company Financials
- 12.1.9.4. SWOT Analysis
- 12.1.10 CHINA ZHONGWANG HOLDINGS LIMITED
- 12.1.10.1. Company Overview
- 12.1.10.2. Products
- 12.1.10.3. Company Financials
- 12.1.10.4. SWOT Analysis
- 12.1.11 RUSAL Plc
- 12.1.11.1. Company Overview
- 12.1.11.2. Products
- 12.1.11.3. Company Financials
- 12.1.11.4. SWOT Analysis
- 12.1.12 Alcoa Inc
- 12.1.12.1. Company Overview
- 12.1.12.2. Products
- 12.1.12.3. Company Financials
- 12.1.12.4. SWOT Analysis
- 12.1.13 Hindalco Industries Ltd
- 12.1.13.1. Company Overview
- 12.1.13.2. Products
- 12.1.13.3. Company Financials
- 12.1.13.4. SWOT Analysis
- 12.1.14 Aluminium Bahrain
- 12.1.14.1. Company Overview
- 12.1.14.2. Products
- 12.1.14.3. Company Financials
- 12.1.14.4. SWOT Analysis
- 12.1.1 SPIC Inc
- 12.2. Market Entropy
- 12.2.1 Company's Key Areas Served
- 12.2.2 Recent Developments
- 12.3. Company Market Share Analysis 2025
- 12.3.1 Top 5 Companies Market Share Analysis
- 12.3.2 Top 3 Companies Market Share Analysis
- 12.4. List of Potential Customers
- 13. Research Methodology
List of Figures
- Figure 1: Global Aluminum Ingots Market Revenue Breakdown (Million, %) by Region 2025 & 2033
- Figure 2: Global Aluminum Ingots Market Volume Breakdown (K Tons, %) by Region 2025 & 2033
- Figure 3: Asia Pacific Aluminum Ingots Market Revenue (Million), by End-user Industry 2025 & 2033
- Figure 4: Asia Pacific Aluminum Ingots Market Volume (K Tons), by End-user Industry 2025 & 2033
- Figure 5: Asia Pacific Aluminum Ingots Market Revenue Share (%), by End-user Industry 2025 & 2033
- Figure 6: Asia Pacific Aluminum Ingots Market Volume Share (%), by End-user Industry 2025 & 2033
- Figure 7: Asia Pacific Aluminum Ingots Market Revenue (Million), by Country 2025 & 2033
- Figure 8: Asia Pacific Aluminum Ingots Market Volume (K Tons), by Country 2025 & 2033
- Figure 9: Asia Pacific Aluminum Ingots Market Revenue Share (%), by Country 2025 & 2033
- Figure 10: Asia Pacific Aluminum Ingots Market Volume Share (%), by Country 2025 & 2033
- Figure 11: North America Aluminum Ingots Market Revenue (Million), by End-user Industry 2025 & 2033
- Figure 12: North America Aluminum Ingots Market Volume (K Tons), by End-user Industry 2025 & 2033
- Figure 13: North America Aluminum Ingots Market Revenue Share (%), by End-user Industry 2025 & 2033
- Figure 14: North America Aluminum Ingots Market Volume Share (%), by End-user Industry 2025 & 2033
- Figure 15: North America Aluminum Ingots Market Revenue (Million), by Country 2025 & 2033
- Figure 16: North America Aluminum Ingots Market Volume (K Tons), by Country 2025 & 2033
- Figure 17: North America Aluminum Ingots Market Revenue Share (%), by Country 2025 & 2033
- Figure 18: North America Aluminum Ingots Market Volume Share (%), by Country 2025 & 2033
- Figure 19: Europe Aluminum Ingots Market Revenue (Million), by End-user Industry 2025 & 2033
- Figure 20: Europe Aluminum Ingots Market Volume (K Tons), by End-user Industry 2025 & 2033
- Figure 21: Europe Aluminum Ingots Market Revenue Share (%), by End-user Industry 2025 & 2033
- Figure 22: Europe Aluminum Ingots Market Volume Share (%), by End-user Industry 2025 & 2033
- Figure 23: Europe Aluminum Ingots Market Revenue (Million), by Country 2025 & 2033
- Figure 24: Europe Aluminum Ingots Market Volume (K Tons), by Country 2025 & 2033
- Figure 25: Europe Aluminum Ingots Market Revenue Share (%), by Country 2025 & 2033
- Figure 26: Europe Aluminum Ingots Market Volume Share (%), by Country 2025 & 2033
- Figure 27: South America Aluminum Ingots Market Revenue (Million), by End-user Industry 2025 & 2033
- Figure 28: South America Aluminum Ingots Market Volume (K Tons), by End-user Industry 2025 & 2033
- Figure 29: South America Aluminum Ingots Market Revenue Share (%), by End-user Industry 2025 & 2033
- Figure 30: South America Aluminum Ingots Market Volume Share (%), by End-user Industry 2025 & 2033
- Figure 31: South America Aluminum Ingots Market Revenue (Million), by Country 2025 & 2033
- Figure 32: South America Aluminum Ingots Market Volume (K Tons), by Country 2025 & 2033
- Figure 33: South America Aluminum Ingots Market Revenue Share (%), by Country 2025 & 2033
- Figure 34: South America Aluminum Ingots Market Volume Share (%), by Country 2025 & 2033
- Figure 35: Middle East and Africa Aluminum Ingots Market Revenue (Million), by End-user Industry 2025 & 2033
- Figure 36: Middle East and Africa Aluminum Ingots Market Volume (K Tons), by End-user Industry 2025 & 2033
- Figure 37: Middle East and Africa Aluminum Ingots Market Revenue Share (%), by End-user Industry 2025 & 2033
- Figure 38: Middle East and Africa Aluminum Ingots Market Volume Share (%), by End-user Industry 2025 & 2033
- Figure 39: Middle East and Africa Aluminum Ingots Market Revenue (Million), by Country 2025 & 2033
- Figure 40: Middle East and Africa Aluminum Ingots Market Volume (K Tons), by Country 2025 & 2033
- Figure 41: Middle East and Africa Aluminum Ingots Market Revenue Share (%), by Country 2025 & 2033
- Figure 42: Middle East and Africa Aluminum Ingots Market Volume Share (%), by Country 2025 & 2033
List of Tables
- Table 1: Global Aluminum Ingots Market Revenue Million Forecast, by End-user Industry 2020 & 2033
- Table 2: Global Aluminum Ingots Market Volume K Tons Forecast, by End-user Industry 2020 & 2033
- Table 3: Global Aluminum Ingots Market Revenue Million Forecast, by Region 2020 & 2033
- Table 4: Global Aluminum Ingots Market Volume K Tons Forecast, by Region 2020 & 2033
- Table 5: Global Aluminum Ingots Market Revenue Million Forecast, by End-user Industry 2020 & 2033
- Table 6: Global Aluminum Ingots Market Volume K Tons Forecast, by End-user Industry 2020 & 2033
- Table 7: Global Aluminum Ingots Market Revenue Million Forecast, by Country 2020 & 2033
- Table 8: Global Aluminum Ingots Market Volume K Tons Forecast, by Country 2020 & 2033
- Table 9: China Aluminum Ingots Market Revenue (Million) Forecast, by Application 2020 & 2033
- Table 10: China Aluminum Ingots Market Volume (K Tons) Forecast, by Application 2020 & 2033
- Table 11: India Aluminum Ingots Market Revenue (Million) Forecast, by Application 2020 & 2033
- Table 12: India Aluminum Ingots Market Volume (K Tons) Forecast, by Application 2020 & 2033
- Table 13: Japan Aluminum Ingots Market Revenue (Million) Forecast, by Application 2020 & 2033
- Table 14: Japan Aluminum Ingots Market Volume (K Tons) Forecast, by Application 2020 & 2033
- Table 15: South Korea Aluminum Ingots Market Revenue (Million) Forecast, by Application 2020 & 2033
- Table 16: South Korea Aluminum Ingots Market Volume (K Tons) Forecast, by Application 2020 & 2033
- Table 17: Rest of Asia Pacific Aluminum Ingots Market Revenue (Million) Forecast, by Application 2020 & 2033
- Table 18: Rest of Asia Pacific Aluminum Ingots Market Volume (K Tons) Forecast, by Application 2020 & 2033
- Table 19: Global Aluminum Ingots Market Revenue Million Forecast, by End-user Industry 2020 & 2033
- Table 20: Global Aluminum Ingots Market Volume K Tons Forecast, by End-user Industry 2020 & 2033
- Table 21: Global Aluminum Ingots Market Revenue Million Forecast, by Country 2020 & 2033
- Table 22: Global Aluminum Ingots Market Volume K Tons Forecast, by Country 2020 & 2033
- Table 23: United States Aluminum Ingots Market Revenue (Million) Forecast, by Application 2020 & 2033
- Table 24: United States Aluminum Ingots Market Volume (K Tons) Forecast, by Application 2020 & 2033
- Table 25: Canada Aluminum Ingots Market Revenue (Million) Forecast, by Application 2020 & 2033
- Table 26: Canada Aluminum Ingots Market Volume (K Tons) Forecast, by Application 2020 & 2033
- Table 27: Mexico Aluminum Ingots Market Revenue (Million) Forecast, by Application 2020 & 2033
- Table 28: Mexico Aluminum Ingots Market Volume (K Tons) Forecast, by Application 2020 & 2033
- Table 29: Global Aluminum Ingots Market Revenue Million Forecast, by End-user Industry 2020 & 2033
- Table 30: Global Aluminum Ingots Market Volume K Tons Forecast, by End-user Industry 2020 & 2033
- Table 31: Global Aluminum Ingots Market Revenue Million Forecast, by Country 2020 & 2033
- Table 32: Global Aluminum Ingots Market Volume K Tons Forecast, by Country 2020 & 2033
- Table 33: Germany Aluminum Ingots Market Revenue (Million) Forecast, by Application 2020 & 2033
- Table 34: Germany Aluminum Ingots Market Volume (K Tons) Forecast, by Application 2020 & 2033
- Table 35: United Kingdom Aluminum Ingots Market Revenue (Million) Forecast, by Application 2020 & 2033
- Table 36: United Kingdom Aluminum Ingots Market Volume (K Tons) Forecast, by Application 2020 & 2033
- Table 37: Italy Aluminum Ingots Market Revenue (Million) Forecast, by Application 2020 & 2033
- Table 38: Italy Aluminum Ingots Market Volume (K Tons) Forecast, by Application 2020 & 2033
- Table 39: France Aluminum Ingots Market Revenue (Million) Forecast, by Application 2020 & 2033
- Table 40: France Aluminum Ingots Market Volume (K Tons) Forecast, by Application 2020 & 2033
- Table 41: Rest of Europe Aluminum Ingots Market Revenue (Million) Forecast, by Application 2020 & 2033
- Table 42: Rest of Europe Aluminum Ingots Market Volume (K Tons) Forecast, by Application 2020 & 2033
- Table 43: Global Aluminum Ingots Market Revenue Million Forecast, by End-user Industry 2020 & 2033
- Table 44: Global Aluminum Ingots Market Volume K Tons Forecast, by End-user Industry 2020 & 2033
- Table 45: Global Aluminum Ingots Market Revenue Million Forecast, by Country 2020 & 2033
- Table 46: Global Aluminum Ingots Market Volume K Tons Forecast, by Country 2020 & 2033
- Table 47: Brazil Aluminum Ingots Market Revenue (Million) Forecast, by Application 2020 & 2033
- Table 48: Brazil Aluminum Ingots Market Volume (K Tons) Forecast, by Application 2020 & 2033
- Table 49: Argentina Aluminum Ingots Market Revenue (Million) Forecast, by Application 2020 & 2033
- Table 50: Argentina Aluminum Ingots Market Volume (K Tons) Forecast, by Application 2020 & 2033
- Table 51: Rest of South America Aluminum Ingots Market Revenue (Million) Forecast, by Application 2020 & 2033
- Table 52: Rest of South America Aluminum Ingots Market Volume (K Tons) Forecast, by Application 2020 & 2033
- Table 53: Global Aluminum Ingots Market Revenue Million Forecast, by End-user Industry 2020 & 2033
- Table 54: Global Aluminum Ingots Market Volume K Tons Forecast, by End-user Industry 2020 & 2033
- Table 55: Global Aluminum Ingots Market Revenue Million Forecast, by Country 2020 & 2033
- Table 56: Global Aluminum Ingots Market Volume K Tons Forecast, by Country 2020 & 2033
- Table 57: Saudi Arabia Aluminum Ingots Market Revenue (Million) Forecast, by Application 2020 & 2033
- Table 58: Saudi Arabia Aluminum Ingots Market Volume (K Tons) Forecast, by Application 2020 & 2033
- Table 59: South Africa Aluminum Ingots Market Revenue (Million) Forecast, by Application 2020 & 2033
- Table 60: South Africa Aluminum Ingots Market Volume (K Tons) Forecast, by Application 2020 & 2033
- Table 61: Rest of Middle East and Africa Aluminum Ingots Market Revenue (Million) Forecast, by Application 2020 & 2033
- Table 62: Rest of Middle East and Africa Aluminum Ingots Market Volume (K Tons) Forecast, by Application 2020 & 2033
Frequently Asked Questions
1. What is the projected Compound Annual Growth Rate (CAGR) of the Aluminum Ingots Market?
The projected CAGR is approximately > 6.50%.
2. Which companies are prominent players in the Aluminum Ingots Market?
Key companies in the market include SPIC Inc, JBMI, Dubai Aluminium Company, Xinfa Group Co Ltd , Norsk Hydro ASA, Aluminum Corporation of China Limited (Chalco), BHP Billiton, United Company, Rio Tinto Group, CHINA ZHONGWANG HOLDINGS LIMITED, RUSAL Plc, Alcoa Inc, Hindalco Industries Ltd, Aluminium Bahrain.
3. What are the main segments of the Aluminum Ingots Market?
The market segments include End-user Industry.
4. Can you provide details about the market size?
The market size is estimated to be USD XX Million as of 2022.
5. What are some drivers contributing to market growth?
Surging Construction Activities in Developing Countries; Rising Application of Aluminum Ingots in the Automotive Industry.
6. What are the notable trends driving market growth?
Significant Growth in Building and Construction Segment.
7. Are there any restraints impacting market growth?
Fluctuating Prices of Raw Materials; Other Market Restraints.
8. Can you provide examples of recent developments in the market?
July 2022: Alcoa Corporation announced that it would soon start the project construction to increase the casting capabilities at its Deschambault smelter in Canada to include standard ingots. The new casting equipment will be constructed in an existing building, with the project fully completed in the first quarter of 2023.
9. What pricing options are available for accessing the report?
Pricing options include single-user, multi-user, and enterprise licenses priced at USD 4750, USD 5250, and USD 8750 respectively.
10. Is the market size provided in terms of value or volume?
The market size is provided in terms of value, measured in Million and volume, measured in K Tons.
11. Are there any specific market keywords associated with the report?
Yes, the market keyword associated with the report is "Aluminum Ingots Market," which aids in identifying and referencing the specific market segment covered.
12. How do I determine which pricing option suits my needs best?
The pricing options vary based on user requirements and access needs. Individual users may opt for single-user licenses, while businesses requiring broader access may choose multi-user or enterprise licenses for cost-effective access to the report.
13. Are there any additional resources or data provided in the Aluminum Ingots Market report?
While the report offers comprehensive insights, it's advisable to review the specific contents or supplementary materials provided to ascertain if additional resources or data are available.
14. How can I stay updated on further developments or reports in the Aluminum Ingots Market?
To stay informed about further developments, trends, and reports in the Aluminum Ingots Market, consider subscribing to industry newsletters, following relevant companies and organizations, or regularly checking reputable industry news sources and publications.
Methodology
Step 1 - Identification of Relevant Samples Size from Population Database


Step 2 - Approaches for Defining Global Market Size (Value, Volume* & Price*)

Note*: In applicable scenarios
Step 3 - Data Sources
Primary Research
- Web Analytics
- Survey Reports
- Research Institute
- Latest Research Reports
- Opinion Leaders
Secondary Research
- Annual Reports
- White Paper
- Latest Press Release
- Industry Association
- Paid Database
- Investor Presentations

Step 4 - Data Triangulation
Involves using different sources of information in order to increase the validity of a study
These sources are likely to be stakeholders in a program - participants, other researchers, program staff, other community members, and so on.
Then we put all data in single framework & apply various statistical tools to find out the dynamic on the market.
During the analysis stage, feedback from the stakeholder groups would be compared to determine areas of agreement as well as areas of divergence