

Key Insights
The Ammonium Phosphate market is projected to reach 528.26 million by 2025, exhibiting a Compound Annual Growth Rate (CAGR) of 5.4%. This growth is primarily driven by increasing agricultural demand to support global food security and expanding industrial applications including water treatment and flame retardants. Technological advancements in fertilizer production, leading to improved efficiency and reduced environmental impact, further bolster market expansion. Key restraints include volatile raw material prices, stringent environmental regulations, and potential supply chain disruptions. The market is segmented by ammonium phosphate grades such as Monoammonium Phosphate (MAP) and Diammonium Phosphate (DAP). Leading market participants include China BlueChemical Ltd, GNFC Limited, J R Simplot Company, PhosAgro Group of Companies, SABIC, Shifang Chuanxi Xingda Chemical Co Ltd, The Mosaic Company, and Yara, who are actively engaged in strategic expansions, acquisitions, and innovation. Market penetration varies across regions, influenced by agricultural intensity and industrial activity.
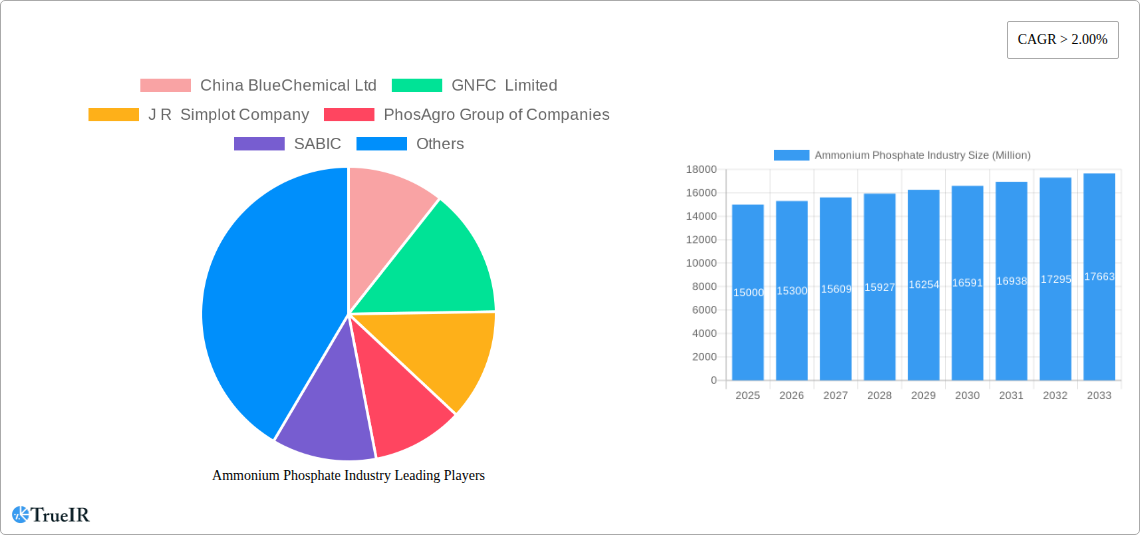
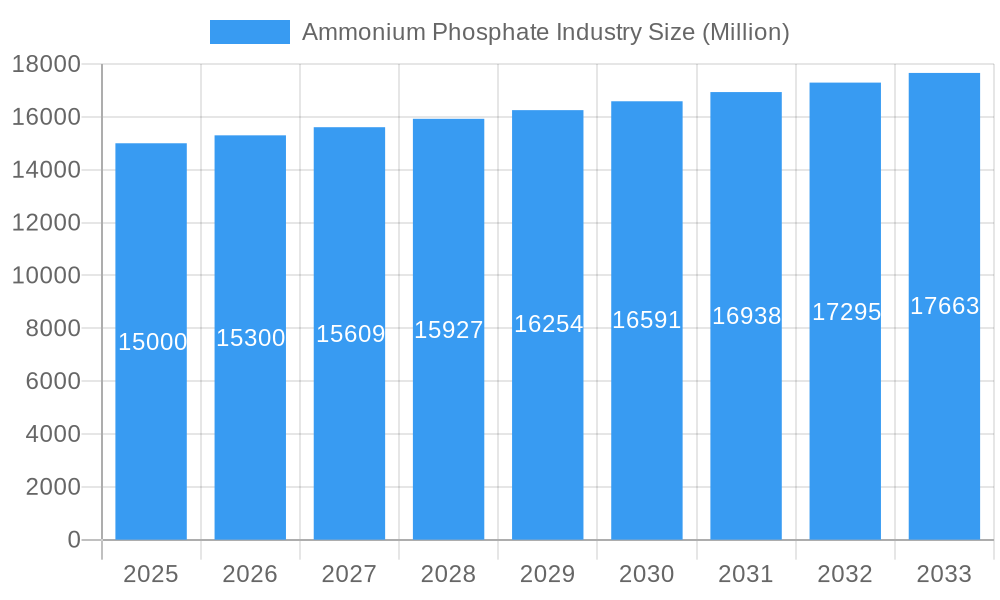
Ammonium Phosphate Industry Market Size (In Million)
The forecast period from 2025 to 2033 anticipates continued market expansion. The growth trajectory will be shaped by global economic conditions, agricultural policies, raw material price volatility, and advancements in production and utilization efficiency. Analysis of historical data from 2019-2024 and future projections indicate a sustained, though potentially fluctuating, growth trend. The competitive environment is expected to remain dynamic, with established players focusing on efficiency and diversification, while new entrants may target niche segments. Increased investments in research and development will address sustainability and environmental concerns. The market will likely see a greater adoption of sustainable and precision farming techniques, driving demand for high-quality ammonium phosphate fertilizers.
Ammonium Phosphate Industry Company Market Share
Ammonium Phosphate Industry Market Report: 2019-2033
This comprehensive report provides an in-depth analysis of the global Ammonium Phosphate industry, offering invaluable insights for stakeholders seeking to navigate this dynamic market. Covering the period from 2019 to 2033, with a base year of 2025 and a forecast period of 2025-2033, this report leverages extensive data analysis and expert insights to deliver a clear and actionable understanding of market trends, opportunities, and challenges. The study incorporates detailed profiles of key players such as China BlueChemical Ltd, GNFC Limited, J R Simplot Company, PhosAgro Group of Companies, SABIC, Shifang Chuanxi Xingda Chemical Co Ltd, The Mosaic Company, and Yara, among others.
Ammonium Phosphate Industry Market Structure & Competitive Landscape
The global ammonium phosphate market exhibits a moderately concentrated structure, with a few major players holding significant market share. The Herfindahl-Hirschman Index (HHI) for 2025 is estimated at xx, indicating a moderately concentrated market. Innovation in production technologies, such as the development of more energy-efficient processes and the use of recycled materials, is a key driver of competition. Stringent environmental regulations concerning phosphate production and its impact on water resources significantly influence the market landscape, driving investment in cleaner technologies. Product substitutes, primarily other nitrogen and phosphorus fertilizers, pose a competitive threat, particularly in price-sensitive markets. The market comprises various end-user segments, including agriculture (dominating the market share), industrial applications, and water treatment. M&A activity in the ammonium phosphate sector has been relatively moderate in recent years, with a total transaction value of approximately xx Million in 2024. Several key factors are driving the market dynamics.
- Market Concentration: Moderate, with a HHI of xx in 2025.
- Innovation Drivers: Energy efficiency improvements, recycled material utilization, and cleaner production technologies.
- Regulatory Impacts: Stringent environmental regulations regarding water pollution and emissions.
- Product Substitutes: Other nitrogen and phosphorus fertilizers.
- End-User Segmentation: Agriculture (largest segment), industrial applications, and water treatment.
- M&A Trends: Moderate activity, with a total transaction value of approximately xx Million in 2024.
Ammonium Phosphate Industry Market Trends & Opportunities
The global ammonium phosphate market is projected to experience robust growth, with a Compound Annual Growth Rate (CAGR) of xx% during the forecast period (2025-2033). This growth is fueled by several factors, including rising global food demand, intensifying agricultural practices, and increasing fertilizer consumption in developing economies. Technological advancements, such as precision farming techniques and improved fertilizer formulations, are enhancing the efficiency and effectiveness of ammonium phosphate. Consumer preferences are shifting towards high-quality, sustainable fertilizers, driving innovation in production processes and product offerings. Competitive dynamics are shaped by price competition, product differentiation, and strategic partnerships. Market penetration rates are expected to increase significantly in emerging markets, driven by rising disposable incomes and government initiatives promoting agricultural productivity. The market size is predicted to reach xx Million by 2033.
Dominant Markets & Segments in Ammonium Phosphate Industry
The Asia-Pacific region is the dominant market for ammonium phosphate, driven by its vast agricultural sector and rapid economic growth. China, India, and other Southeast Asian countries represent key growth markets.
- Key Growth Drivers in Asia-Pacific:
- Rapidly expanding agricultural sector.
- Increasing disposable incomes leading to higher food consumption.
- Government initiatives supporting agricultural development.
- Favorable climatic conditions.
- Growing demand for food crops.
The agricultural segment dominates the end-user market, consuming the majority of ammonium phosphate production. This high demand is driven primarily by food production and the global population surge.
Ammonium Phosphate Industry Product Analysis
Technological advancements in ammonium phosphate production have led to the development of more efficient and environmentally friendly formulations. These innovations include slow-release fertilizers that minimize nutrient runoff and reduce the environmental impact, and customized blends tailored to specific crop needs. These advancements enhance the competitive advantage of producers by offering superior product performance and sustainability. Applications range from intensive crop farming to specialized horticultural uses.
Key Drivers, Barriers & Challenges in Ammonium Phosphate Industry
Key Drivers:
Rising global food demand, intensive farming practices, increased fertilizer consumption in developing economies, and technological advancements in fertilizer production contribute to market growth. Government support for agricultural modernization and favorable climatic conditions in some regions also contribute to market expansion.
Challenges:
Fluctuations in raw material prices, stringent environmental regulations, and intense competition among producers represent key challenges. Supply chain disruptions, geopolitical instability, and trade restrictions can further impact market growth. Quantifiable impacts include price volatility resulting in profit margin reductions and increased production costs.
Growth Drivers in the Ammonium Phosphate Industry Market
The key drivers include growing global food demand, adoption of improved farming techniques, rising disposable incomes in developing countries increasing fertilizer consumption and technological advancements leading to superior product performance. Government incentives promoting agricultural modernization provide an additional positive impetus.
Challenges Impacting Ammonium Phosphate Industry Growth
Supply chain vulnerabilities, raw material price volatility, and stringent environmental regulations pose significant challenges. Geopolitical uncertainty impacting trade and transport create significant constraints. These factors impact profitability and limit market expansion potential.
Key Players Shaping the Ammonium Phosphate Industry Market
- China BlueChemical Ltd
- GNFC Limited
- J R Simplot Company
- PhosAgro Group of Companies
- SABIC
- Shifang Chuanxi Xingda Chemical Co Ltd
- The Mosaic Company
- Yara *List Not Exhaustive
Significant Ammonium Phosphate Industry Industry Milestones
- 2021, Q3: The Mosaic Company launched a new line of enhanced-efficiency ammonium phosphate fertilizers.
- 2022, Q1: PhosAgro completed a significant expansion of its production facility in Russia.
- 2023, Q2: A merger between two smaller ammonium phosphate producers created a new major player in the market. (Further details unavailable – xx)
Future Outlook for Ammonium Phosphate Industry Market
The ammonium phosphate market is poised for continued growth, driven by the long-term trends of rising global population, intensifying agricultural practices, and increasing demand for food. Strategic opportunities exist in developing sustainable production methods, expanding into high-growth markets, and developing innovative fertilizer formulations. The market's potential is vast, with significant room for growth in both developed and developing economies.
Ammonium Phosphate Industry Segmentation
-
1. Application
- 1.1. Fertilizer
- 1.2. Food & Beverages
- 1.3. Fire Retardant
- 1.4. Metals
Ammonium Phosphate Industry Segmentation By Geography
-
1. Asia Pacific
- 1.1. China
- 1.2. India
- 1.3. Japan
- 1.4. South Korea
- 1.5. Rest of Asia Pacific
-
2. North America
- 2.1. United States
- 2.2. Canada
- 2.3. Mexico
-
3. Europe
- 3.1. Germany
- 3.2. United Kingdom
- 3.3. Italy
- 3.4. France
- 3.5. Rest of Europe
-
4. South America
- 4.1. Brazil
- 4.2. Argentina
- 4.3. Rest of South America
-
5. Middle East and Africa
- 5.1. Saudi Arabia
- 5.2. South Africa
- 5.3. Rest of Middle East and Africa
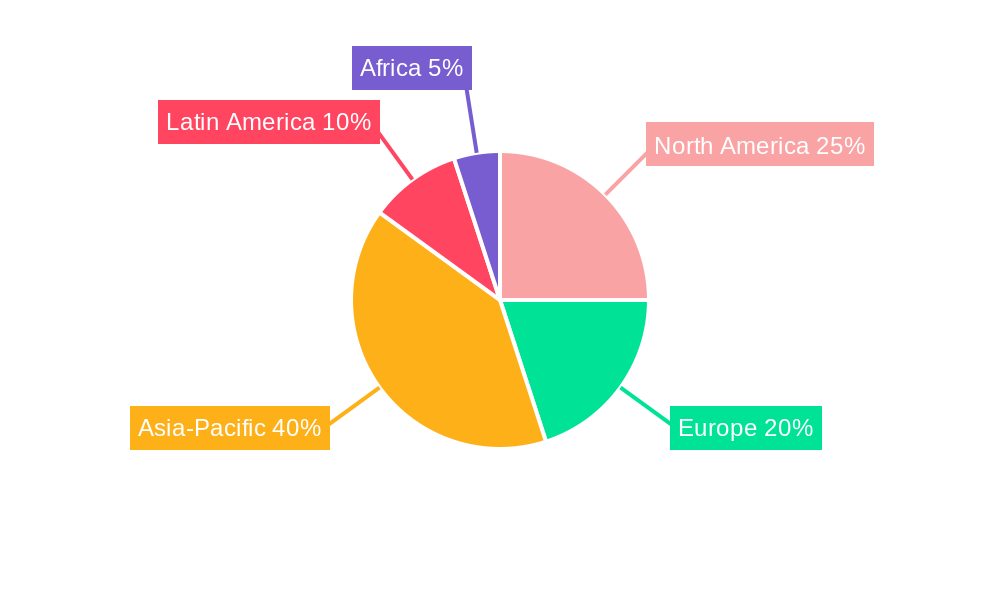
Ammonium Phosphate Industry Regional Market Share
Geographic Coverage of Ammonium Phosphate Industry
Ammonium Phosphate Industry REPORT HIGHLIGHTS
| Aspects | Details |
|---|---|
| Study Period | 2020-2034 |
| Base Year | 2025 |
| Estimated Year | 2026 |
| Forecast Period | 2026-2034 |
| Historical Period | 2020-2025 |
| Growth Rate | CAGR of 5.4% from 2020-2034 |
| Segmentation |
|
Table of Contents
- 1. Introduction
- 1.1. Research Scope
- 1.2. Market Segmentation
- 1.3. Research Objective
- 1.4. Definitions and Assumptions
- 2. Executive Summary
- 2.1. Market Snapshot
- 3. Market Dynamics
- 3.1. Market Drivers
- 3.2. Market Restrains
- 3.3. Market Trends
- 3.4. Market Opportunities
- 4. Market Factor Analysis
- 4.1. Porters Five Forces
- 4.1.1. Bargaining Power of Suppliers
- 4.1.2. Bargaining Power of Buyers
- 4.1.3. Threat of New Entrants
- 4.1.4. Threat of Substitutes
- 4.1.5. Competitive Rivalry
- 4.2. PESTEL analysis
- 4.3. BCG Analysis
- 4.3.1. Stars (High Growth, High Market Share)
- 4.3.2. Cash Cows (Low Growth, High Market Share)
- 4.3.3. Question Mark (High Growth, Low Market Share)
- 4.3.4. Dogs (Low Growth, Low Market Share)
- 4.4. Ansoff Matrix Analysis
- 4.5. Supply Chain Analysis
- 4.6. Regulatory Landscape
- 4.7. Current Market Potential and Opportunity Assessment (TAM–SAM–SOM Framework)
- 4.8. TIR Analyst Note
- 4.1. Porters Five Forces
- 5. Market Analysis, Insights and Forecast 2021-2033
- 5.1. Market Analysis, Insights and Forecast - by Application
- 5.1.1. Fertilizer
- 5.1.2. Food & Beverages
- 5.1.3. Fire Retardant
- 5.1.4. Metals
- 5.2. Market Analysis, Insights and Forecast - by Region
- 5.2.1. Asia Pacific
- 5.2.2. North America
- 5.2.3. Europe
- 5.2.4. South America
- 5.2.5. Middle East and Africa
- 5.1. Market Analysis, Insights and Forecast - by Application
- 6. Global Ammonium Phosphate Industry Analysis, Insights and Forecast, 2021-2033
- 6.1. Market Analysis, Insights and Forecast - by Application
- 6.1.1. Fertilizer
- 6.1.2. Food & Beverages
- 6.1.3. Fire Retardant
- 6.1.4. Metals
- 6.1. Market Analysis, Insights and Forecast - by Application
- 7. Asia Pacific Ammonium Phosphate Industry Analysis, Insights and Forecast, 2020-2032
- 7.1. Market Analysis, Insights and Forecast - by Application
- 7.1.1. Fertilizer
- 7.1.2. Food & Beverages
- 7.1.3. Fire Retardant
- 7.1.4. Metals
- 7.1. Market Analysis, Insights and Forecast - by Application
- 8. North America Ammonium Phosphate Industry Analysis, Insights and Forecast, 2020-2032
- 8.1. Market Analysis, Insights and Forecast - by Application
- 8.1.1. Fertilizer
- 8.1.2. Food & Beverages
- 8.1.3. Fire Retardant
- 8.1.4. Metals
- 8.1. Market Analysis, Insights and Forecast - by Application
- 9. Europe Ammonium Phosphate Industry Analysis, Insights and Forecast, 2020-2032
- 9.1. Market Analysis, Insights and Forecast - by Application
- 9.1.1. Fertilizer
- 9.1.2. Food & Beverages
- 9.1.3. Fire Retardant
- 9.1.4. Metals
- 9.1. Market Analysis, Insights and Forecast - by Application
- 10. South America Ammonium Phosphate Industry Analysis, Insights and Forecast, 2020-2032
- 10.1. Market Analysis, Insights and Forecast - by Application
- 10.1.1. Fertilizer
- 10.1.2. Food & Beverages
- 10.1.3. Fire Retardant
- 10.1.4. Metals
- 10.1. Market Analysis, Insights and Forecast - by Application
- 11. Middle East and Africa Ammonium Phosphate Industry Analysis, Insights and Forecast, 2020-2032
- 11.1. Market Analysis, Insights and Forecast - by Application
- 11.1.1. Fertilizer
- 11.1.2. Food & Beverages
- 11.1.3. Fire Retardant
- 11.1.4. Metals
- 11.1. Market Analysis, Insights and Forecast - by Application
- 12. Competitive Analysis
- 12.1. Company Profiles
- 12.1.1 China BlueChemical Ltd
- 12.1.1.1. Company Overview
- 12.1.1.2. Products
- 12.1.1.3. Company Financials
- 12.1.1.4. SWOT Analysis
- 12.1.2 GNFC Limited
- 12.1.2.1. Company Overview
- 12.1.2.2. Products
- 12.1.2.3. Company Financials
- 12.1.2.4. SWOT Analysis
- 12.1.3 J R Simplot Company
- 12.1.3.1. Company Overview
- 12.1.3.2. Products
- 12.1.3.3. Company Financials
- 12.1.3.4. SWOT Analysis
- 12.1.4 PhosAgro Group of Companies
- 12.1.4.1. Company Overview
- 12.1.4.2. Products
- 12.1.4.3. Company Financials
- 12.1.4.4. SWOT Analysis
- 12.1.5 SABIC
- 12.1.5.1. Company Overview
- 12.1.5.2. Products
- 12.1.5.3. Company Financials
- 12.1.5.4. SWOT Analysis
- 12.1.6 Shifang Chuanxi Xingda Chemical Co Ltd
- 12.1.6.1. Company Overview
- 12.1.6.2. Products
- 12.1.6.3. Company Financials
- 12.1.6.4. SWOT Analysis
- 12.1.7 The Mosaic Company
- 12.1.7.1. Company Overview
- 12.1.7.2. Products
- 12.1.7.3. Company Financials
- 12.1.7.4. SWOT Analysis
- 12.1.8 Yara*List Not Exhaustive
- 12.1.8.1. Company Overview
- 12.1.8.2. Products
- 12.1.8.3. Company Financials
- 12.1.8.4. SWOT Analysis
- 12.1.1 China BlueChemical Ltd
- 12.2. Market Entropy
- 12.2.1 Company's Key Areas Served
- 12.2.2 Recent Developments
- 12.3. Company Market Share Analysis 2025
- 12.3.1 Top 5 Companies Market Share Analysis
- 12.3.2 Top 3 Companies Market Share Analysis
- 12.4. List of Potential Customers
- 13. Research Methodology
List of Figures
- Figure 1: Global Ammonium Phosphate Industry Revenue Breakdown (million, %) by Region 2025 & 2033
- Figure 2: Asia Pacific Ammonium Phosphate Industry Revenue (million), by Application 2025 & 2033
- Figure 3: Asia Pacific Ammonium Phosphate Industry Revenue Share (%), by Application 2025 & 2033
- Figure 4: Asia Pacific Ammonium Phosphate Industry Revenue (million), by Country 2025 & 2033
- Figure 5: Asia Pacific Ammonium Phosphate Industry Revenue Share (%), by Country 2025 & 2033
- Figure 6: North America Ammonium Phosphate Industry Revenue (million), by Application 2025 & 2033
- Figure 7: North America Ammonium Phosphate Industry Revenue Share (%), by Application 2025 & 2033
- Figure 8: North America Ammonium Phosphate Industry Revenue (million), by Country 2025 & 2033
- Figure 9: North America Ammonium Phosphate Industry Revenue Share (%), by Country 2025 & 2033
- Figure 10: Europe Ammonium Phosphate Industry Revenue (million), by Application 2025 & 2033
- Figure 11: Europe Ammonium Phosphate Industry Revenue Share (%), by Application 2025 & 2033
- Figure 12: Europe Ammonium Phosphate Industry Revenue (million), by Country 2025 & 2033
- Figure 13: Europe Ammonium Phosphate Industry Revenue Share (%), by Country 2025 & 2033
- Figure 14: South America Ammonium Phosphate Industry Revenue (million), by Application 2025 & 2033
- Figure 15: South America Ammonium Phosphate Industry Revenue Share (%), by Application 2025 & 2033
- Figure 16: South America Ammonium Phosphate Industry Revenue (million), by Country 2025 & 2033
- Figure 17: South America Ammonium Phosphate Industry Revenue Share (%), by Country 2025 & 2033
- Figure 18: Middle East and Africa Ammonium Phosphate Industry Revenue (million), by Application 2025 & 2033
- Figure 19: Middle East and Africa Ammonium Phosphate Industry Revenue Share (%), by Application 2025 & 2033
- Figure 20: Middle East and Africa Ammonium Phosphate Industry Revenue (million), by Country 2025 & 2033
- Figure 21: Middle East and Africa Ammonium Phosphate Industry Revenue Share (%), by Country 2025 & 2033
List of Tables
- Table 1: Global Ammonium Phosphate Industry Revenue million Forecast, by Application 2020 & 2033
- Table 2: Global Ammonium Phosphate Industry Revenue million Forecast, by Region 2020 & 2033
- Table 3: Global Ammonium Phosphate Industry Revenue million Forecast, by Application 2020 & 2033
- Table 4: Global Ammonium Phosphate Industry Revenue million Forecast, by Country 2020 & 2033
- Table 5: China Ammonium Phosphate Industry Revenue (million) Forecast, by Application 2020 & 2033
- Table 6: India Ammonium Phosphate Industry Revenue (million) Forecast, by Application 2020 & 2033
- Table 7: Japan Ammonium Phosphate Industry Revenue (million) Forecast, by Application 2020 & 2033
- Table 8: South Korea Ammonium Phosphate Industry Revenue (million) Forecast, by Application 2020 & 2033
- Table 9: Rest of Asia Pacific Ammonium Phosphate Industry Revenue (million) Forecast, by Application 2020 & 2033
- Table 10: Global Ammonium Phosphate Industry Revenue million Forecast, by Application 2020 & 2033
- Table 11: Global Ammonium Phosphate Industry Revenue million Forecast, by Country 2020 & 2033
- Table 12: United States Ammonium Phosphate Industry Revenue (million) Forecast, by Application 2020 & 2033
- Table 13: Canada Ammonium Phosphate Industry Revenue (million) Forecast, by Application 2020 & 2033
- Table 14: Mexico Ammonium Phosphate Industry Revenue (million) Forecast, by Application 2020 & 2033
- Table 15: Global Ammonium Phosphate Industry Revenue million Forecast, by Application 2020 & 2033
- Table 16: Global Ammonium Phosphate Industry Revenue million Forecast, by Country 2020 & 2033
- Table 17: Germany Ammonium Phosphate Industry Revenue (million) Forecast, by Application 2020 & 2033
- Table 18: United Kingdom Ammonium Phosphate Industry Revenue (million) Forecast, by Application 2020 & 2033
- Table 19: Italy Ammonium Phosphate Industry Revenue (million) Forecast, by Application 2020 & 2033
- Table 20: France Ammonium Phosphate Industry Revenue (million) Forecast, by Application 2020 & 2033
- Table 21: Rest of Europe Ammonium Phosphate Industry Revenue (million) Forecast, by Application 2020 & 2033
- Table 22: Global Ammonium Phosphate Industry Revenue million Forecast, by Application 2020 & 2033
- Table 23: Global Ammonium Phosphate Industry Revenue million Forecast, by Country 2020 & 2033
- Table 24: Brazil Ammonium Phosphate Industry Revenue (million) Forecast, by Application 2020 & 2033
- Table 25: Argentina Ammonium Phosphate Industry Revenue (million) Forecast, by Application 2020 & 2033
- Table 26: Rest of South America Ammonium Phosphate Industry Revenue (million) Forecast, by Application 2020 & 2033
- Table 27: Global Ammonium Phosphate Industry Revenue million Forecast, by Application 2020 & 2033
- Table 28: Global Ammonium Phosphate Industry Revenue million Forecast, by Country 2020 & 2033
- Table 29: Saudi Arabia Ammonium Phosphate Industry Revenue (million) Forecast, by Application 2020 & 2033
- Table 30: South Africa Ammonium Phosphate Industry Revenue (million) Forecast, by Application 2020 & 2033
- Table 31: Rest of Middle East and Africa Ammonium Phosphate Industry Revenue (million) Forecast, by Application 2020 & 2033
Frequently Asked Questions
1. What is the projected Compound Annual Growth Rate (CAGR) of the Ammonium Phosphate Industry?
The projected CAGR is approximately 5.4%.
2. Which companies are prominent players in the Ammonium Phosphate Industry?
Key companies in the market include China BlueChemical Ltd, GNFC Limited, J R Simplot Company, PhosAgro Group of Companies, SABIC, Shifang Chuanxi Xingda Chemical Co Ltd, The Mosaic Company, Yara*List Not Exhaustive.
3. What are the main segments of the Ammonium Phosphate Industry?
The market segments include Application.
4. Can you provide details about the market size?
The market size is estimated to be USD 528.26 million as of 2022.
5. What are some drivers contributing to market growth?
; Increasing Demand of Diammonium Hydrogen Phosphate in Fertilizers; Rising Demand from Brewing.
6. What are the notable trends driving market growth?
Increasing Demand from Fertilizers Segment.
7. Are there any restraints impacting market growth?
; Increasing Demand of Diammonium Hydrogen Phosphate in Fertilizers; Rising Demand from Brewing.
8. Can you provide examples of recent developments in the market?
N/A
9. What pricing options are available for accessing the report?
Pricing options include single-user, multi-user, and enterprise licenses priced at USD 4750, USD 5250, and USD 8750 respectively.
10. Is the market size provided in terms of value or volume?
The market size is provided in terms of value, measured in million.
11. Are there any specific market keywords associated with the report?
Yes, the market keyword associated with the report is "Ammonium Phosphate Industry," which aids in identifying and referencing the specific market segment covered.
12. How do I determine which pricing option suits my needs best?
The pricing options vary based on user requirements and access needs. Individual users may opt for single-user licenses, while businesses requiring broader access may choose multi-user or enterprise licenses for cost-effective access to the report.
13. Are there any additional resources or data provided in the Ammonium Phosphate Industry report?
While the report offers comprehensive insights, it's advisable to review the specific contents or supplementary materials provided to ascertain if additional resources or data are available.
14. How can I stay updated on further developments or reports in the Ammonium Phosphate Industry?
To stay informed about further developments, trends, and reports in the Ammonium Phosphate Industry, consider subscribing to industry newsletters, following relevant companies and organizations, or regularly checking reputable industry news sources and publications.
Methodology
Step 1 - Identification of Relevant Samples Size from Population Database


Step 2 - Approaches for Defining Global Market Size (Value, Volume* & Price*)

Note*: In applicable scenarios
Step 3 - Data Sources
Primary Research
- Web Analytics
- Survey Reports
- Research Institute
- Latest Research Reports
- Opinion Leaders
Secondary Research
- Annual Reports
- White Paper
- Latest Press Release
- Industry Association
- Paid Database
- Investor Presentations

Step 4 - Data Triangulation
Involves using different sources of information in order to increase the validity of a study
These sources are likely to be stakeholders in a program - participants, other researchers, program staff, other community members, and so on.
Then we put all data in single framework & apply various statistical tools to find out the dynamic on the market.
During the analysis stage, feedback from the stakeholder groups would be compared to determine areas of agreement as well as areas of divergence