

Key Insights
The Asia-Pacific (APAC) carbon fiber building materials market is experiencing robust growth, fueled by increasing infrastructure development, a burgeoning construction sector, and rising demand for lightweight, high-strength materials in buildings. This market segment is projected to witness significant expansion over the forecast period (2025-2033), driven primarily by China, Japan, India, and South Korea. These nations are investing heavily in infrastructure projects, including high-speed rail, skyscrapers, and bridges, all of which require advanced materials like carbon fiber for enhanced durability and reduced weight. Furthermore, the growing adoption of sustainable building practices and the need for energy-efficient structures are bolstering the demand for carbon fiber composites, which offer superior thermal insulation properties compared to traditional materials. The increasing focus on improving building resilience against natural disasters, such as earthquakes and typhoons, further contributes to the market's expansion. However, the high cost of carbon fiber compared to conventional materials and concerns regarding its manufacturing processes remain significant restraints. Nevertheless, ongoing technological advancements leading to cost reductions and improved production efficiency are expected to mitigate these challenges.
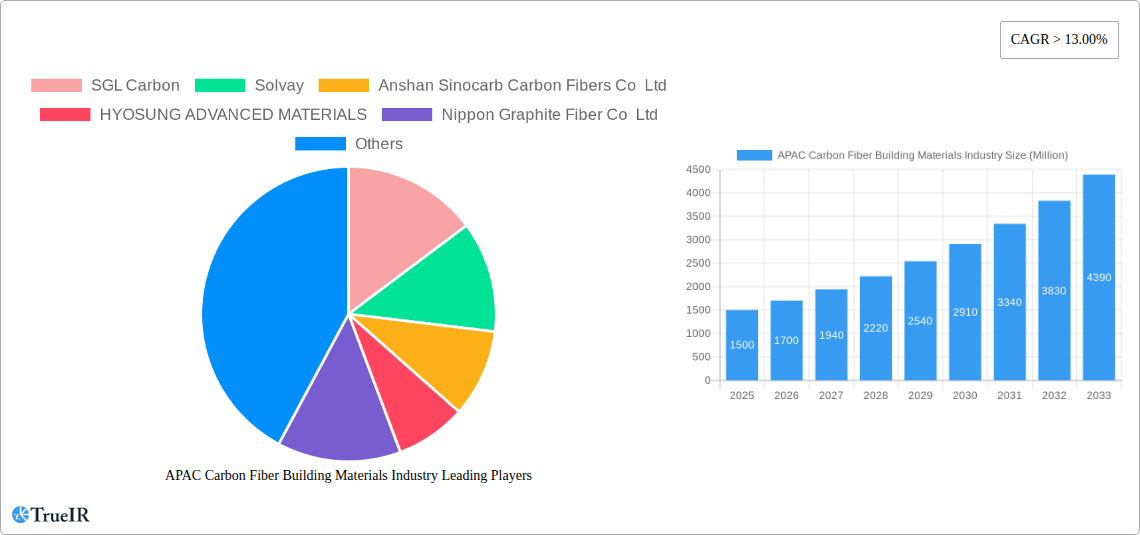
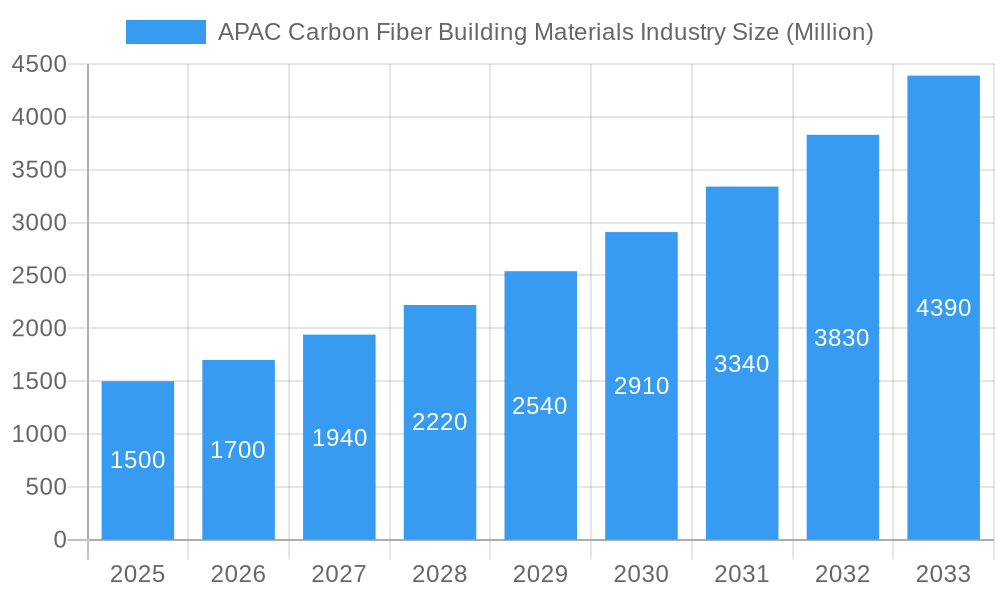
APAC Carbon Fiber Building Materials Industry Market Size (In Billion)
The segmentation within the APAC market reveals a strong preference for virgin carbon fiber (VCF) due to its superior mechanical properties. However, the recycled carbon fiber (RCF) segment is anticipated to witness considerable growth, driven by rising environmental consciousness and the increasing focus on sustainable construction practices. Among applications, composite materials dominate, reflecting the widespread use of carbon fiber reinforced polymers (CFRP) in structural components. The aerospace and defense industries, along with the burgeoning alternative energy sector (wind turbines, solar panel supports), are major end-users of carbon fiber building materials in the region. The competitive landscape is characterized by a mix of multinational corporations and domestic players, with key companies investing in research and development to improve product quality and expand their market presence. While precise market figures for the APAC region are unavailable, a logical estimation based on the global CAGR of >13% and the region's significant contribution to global construction activity suggests a substantial and rapidly growing market opportunity for carbon fiber building materials within APAC.
APAC Carbon Fiber Building Materials Industry Company Market Share
APAC Carbon Fiber Building Materials Industry Market Report: 2019-2033
This comprehensive report provides a detailed analysis of the Asia-Pacific (APAC) carbon fiber building materials industry, encompassing market size, growth drivers, challenges, competitive landscape, and future outlook. The study period covers 2019-2033, with a base year of 2025 and a forecast period of 2025-2033. The report is crucial for businesses, investors, and policymakers seeking to understand this dynamic and rapidly expanding market. With a projected market value exceeding xx Million by 2033, the APAC carbon fiber building materials industry presents significant opportunities and challenges.
APAC Carbon Fiber Building Materials Industry Market Structure & Competitive Landscape
The APAC carbon fiber building materials market is characterized by a moderately concentrated structure, with key players like SGL Carbon, Solvay, Anshan Sinocarb Carbon Fibers Co Ltd, HYOSUNG ADVANCED MATERIALS, Nippon Graphite Fiber Co Ltd, TORAY INDUSTRIES INC, Mitsubishi Chemical Carbon Fiber and Composites Inc, Hexcel Corporation, Formosa Plastics Corporation, TEIJIN LIMITED, and Zhongfu Shenying Carbon Fiber Co Ltd holding significant market share. However, the presence of numerous smaller players indicates a competitive landscape.
- Market Concentration: The four-firm concentration ratio is estimated at xx%, suggesting a moderately concentrated market. This concentration is likely to increase slightly in the forecast period as larger companies invest in capacity expansion.
- Innovation Drivers: Ongoing R&D efforts focused on enhancing fiber strength, durability, and cost-effectiveness are driving innovation. The development of sustainable and recycled carbon fiber materials is also gaining traction.
- Regulatory Impacts: Government policies promoting sustainable construction and infrastructure development in several APAC nations are positively influencing market growth. However, varying environmental regulations across different countries present challenges.
- Product Substitutes: Steel, concrete, and other composite materials pose competition, although carbon fiber's superior strength-to-weight ratio offers a key advantage in specific applications.
- End-User Segmentation: The construction and infrastructure sector is a major driver, followed by the aerospace and defense, and automotive industries. The growing alternative energy sector also presents a significant opportunity.
- M&A Trends: Consolidation is likely to increase, with larger players acquiring smaller companies to expand their product portfolio and market reach. The total M&A value in the sector during the historical period was approximately xx Million.
APAC Carbon Fiber Building Materials Industry Market Trends & Opportunities
The APAC carbon fiber building materials market exhibits robust growth, driven by increasing demand from various end-user industries. The market size reached xx Million in 2024 and is projected to reach xx Million by 2033, exhibiting a Compound Annual Growth Rate (CAGR) of xx% during the forecast period. This growth is fueled by several key trends:
- Technological advancements: Innovations in fiber production techniques, resulting in higher strength, lighter weight, and cost-effective materials, are key growth drivers.
- Rising infrastructure development: The massive infrastructure projects underway across APAC countries are a significant catalyst for market expansion.
- Growing adoption in the automotive industry: The increasing demand for lighter and fuel-efficient vehicles is driving the adoption of carbon fiber in automotive components.
- Expansion of the alternative energy sector: Carbon fiber is extensively used in wind turbine blades and other renewable energy infrastructure, contributing to market growth.
- Favorable government policies: Several APAC governments are promoting the use of advanced materials in construction and infrastructure, further boosting market demand.
- Market penetration rate: The penetration rate of carbon fiber in building materials is still relatively low, leaving significant room for future growth.
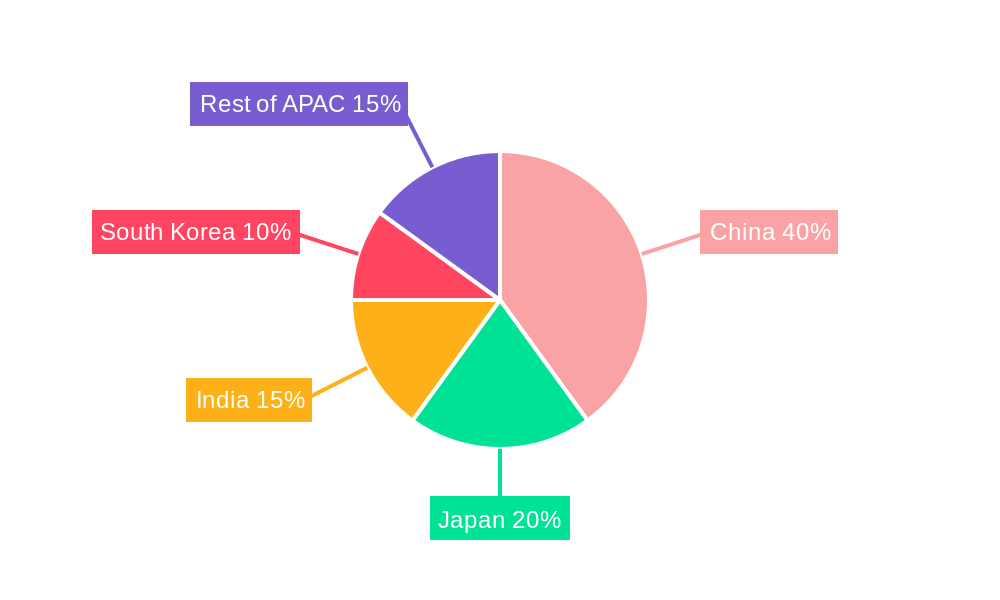
Dominant Markets & Segments in APAC Carbon Fiber Building Materials Industry
China holds the largest market share in the APAC region, driven by its massive infrastructure projects and growing automotive industry. Other significant markets include Japan, South Korea, and India.
Key Growth Drivers:
- Infrastructure Development: Rapid urbanization and industrialization are driving massive infrastructure projects across the APAC region, significantly increasing demand for carbon fiber building materials.
- Government Policies: Supportive government policies promoting sustainable construction practices and advanced materials adoption are stimulating market growth.
- Technological Advancements: Continuous improvements in carbon fiber manufacturing processes lead to cost reductions and performance enhancements, further driving demand.
Dominant Segments:
- Raw Material: Polyacrylonitrile (PAN) holds the largest market share due to its superior properties and cost-effectiveness.
- Type: Virgin carbon fiber (VCF) currently dominates the market; however, the adoption of recycled carbon fiber (RCF) is expected to increase due to sustainability concerns.
- Application: Composite materials constitute the largest application segment, followed by the textiles and other niche applications.
- End-user Industry: The construction and infrastructure sector is the leading end-user, closely followed by the aerospace and defense, and automotive industries.
APAC Carbon Fiber Building Materials Industry Product Analysis
Technological advancements are continuously enhancing the properties of carbon fiber, making it lighter, stronger, and more cost-effective. This includes the development of new fiber architectures, surface treatments, and manufacturing processes. These improvements are improving the market fit of carbon fiber in various applications, especially in the construction sector where lightweight, high-strength materials are increasingly sought after for sustainable building designs.
Key Drivers, Barriers & Challenges in APAC Carbon Fiber Building Materials Industry
Key Drivers:
Technological advancements, increasing infrastructure spending, rising adoption in automotive and renewable energy sectors, and supportive government policies are propelling market growth. For example, the massive investments in high-speed rail projects across China and India directly increase demand.
Key Challenges:
High production costs, supply chain disruptions, intense competition from established materials like steel and concrete, and complex regulatory landscapes in some APAC countries pose significant challenges. For example, fluctuations in raw material prices can impact profitability, while inconsistent regulatory frameworks hinder market expansion in certain regions. These challenges, if not addressed effectively, could slow down the growth of the APAC carbon fiber building materials industry in the long term.
Growth Drivers in the APAC Carbon Fiber Building Materials Industry Market
The growth of the APAC carbon fiber building materials market is predominantly driven by rapid urbanization and industrialization across the region. This necessitates substantial infrastructure development, creating a massive demand for high-performance, lightweight building materials. Technological advancements, particularly in improving production efficiency and lowering costs, also significantly contribute to the market's expansion. Furthermore, supportive government policies promoting sustainable construction and the adoption of advanced materials provide a conducive environment for market growth.
Challenges Impacting APAC Carbon Fiber Building Materials Industry Growth
Several challenges hamper the growth of the APAC carbon fiber building materials market. High manufacturing costs compared to traditional materials, such as steel and concrete, remain a major hurdle. The volatile nature of raw material prices adds to the economic uncertainty. Furthermore, supply chain disruptions, complex regulatory requirements, and intense competition from established players restrain market expansion. These challenges need to be addressed to ensure sustainable and consistent market growth.
Key Players Shaping the APAC Carbon Fiber Building Materials Industry Market
- SGL Carbon
- Solvay
- Anshan Sinocarb Carbon Fibers Co Ltd
- HYOSUNG ADVANCED MATERIALS
- Nippon Graphite Fiber Co Ltd
- TORAY INDUSTRIES INC
- Mitsubishi Chemical Carbon Fiber and Composites Inc
- Hexcel Corporation
- Formosa Plastics Corporation
- TEIJIN LIMITED
- Zhongfu Shenying Carbon Fiber Co Ltd
Significant APAC Carbon Fiber Building Materials Industry Industry Milestones
- April 2021: Hyosung Advanced Materials secured a USD 144 Million contract with Hanwha Solutions to supply high-strength carbon fiber for hydrogen vehicle fuel tanks, showcasing the growing importance of carbon fiber in the alternative energy sector.
Future Outlook for APAC Carbon Fiber Building Materials Industry Market
The APAC carbon fiber building materials market is poised for substantial growth, driven by ongoing infrastructure development, increasing adoption in various end-user industries, and continuous technological advancements. Strategic investments in R&D, focusing on cost reduction and performance enhancement, will further accelerate market expansion. The increasing focus on sustainability and the development of recycled carbon fiber materials will also contribute to the market's future potential. The market's growth trajectory appears promising, with significant opportunities for both established players and new entrants.
APAC Carbon Fiber Building Materials Industry Segmentation
-
1. Raw Material
- 1.1. Polyacrtlonitrile (PAN)
- 1.2. Petroleum Pitch and Rayon
-
2. Type
- 2.1. Virgin Fiber (VCF)
- 2.2. Recycled Fiber (RCF)
-
3. Application
- 3.1. Composite Materials
- 3.2. Textiles
- 3.3. Microelectrodes
- 3.4. Catalysis
-
4. End-user Industry
- 4.1. Aerospace and Defense
- 4.2. Alternative Energy
- 4.3. Automotive
- 4.4. Construction and Infrastructure
- 4.5. Sporting Goods
- 4.6. Other En
-
5. Geography
- 5.1. China
- 5.2. India
- 5.3. Japan
- 5.4. South Korea
- 5.5. ASEAN Countries
- 5.6. Rest of Asia-Pacific
APAC Carbon Fiber Building Materials Industry Segmentation By Geography
- 1. China
- 2. India
- 3. Japan
- 4. South Korea
- 5. ASEAN Countries
- 6. Rest of Asia Pacific
APAC Carbon Fiber Building Materials Industry Regional Market Share
Geographic Coverage of APAC Carbon Fiber Building Materials Industry
APAC Carbon Fiber Building Materials Industry REPORT HIGHLIGHTS
| Aspects | Details |
|---|---|
| Study Period | 2020-2034 |
| Base Year | 2025 |
| Estimated Year | 2026 |
| Forecast Period | 2026-2034 |
| Historical Period | 2020-2025 |
| Growth Rate | CAGR of 10.9% from 2020-2034 |
| Segmentation |
|
Table of Contents
- 1. Introduction
- 1.1. Research Scope
- 1.2. Market Segmentation
- 1.3. Research Objective
- 1.4. Definitions and Assumptions
- 2. Executive Summary
- 2.1. Market Snapshot
- 3. Market Dynamics
- 3.1. Market Drivers
- 3.2. Market Restrains
- 3.3. Market Trends
- 3.4. Market Opportunities
- 4. Market Factor Analysis
- 4.1. Porters Five Forces
- 4.1.1. Bargaining Power of Suppliers
- 4.1.2. Bargaining Power of Buyers
- 4.1.3. Threat of New Entrants
- 4.1.4. Threat of Substitutes
- 4.1.5. Competitive Rivalry
- 4.2. PESTEL analysis
- 4.3. BCG Analysis
- 4.3.1. Stars (High Growth, High Market Share)
- 4.3.2. Cash Cows (Low Growth, High Market Share)
- 4.3.3. Question Mark (High Growth, Low Market Share)
- 4.3.4. Dogs (Low Growth, Low Market Share)
- 4.4. Ansoff Matrix Analysis
- 4.5. Supply Chain Analysis
- 4.6. Regulatory Landscape
- 4.7. Current Market Potential and Opportunity Assessment (TAM–SAM–SOM Framework)
- 4.8. TIR Analyst Note
- 4.1. Porters Five Forces
- 5. Market Analysis, Insights and Forecast 2021-2033
- 5.1. Market Analysis, Insights and Forecast - by Raw Material
- 5.1.1. Polyacrtlonitrile (PAN)
- 5.1.2. Petroleum Pitch and Rayon
- 5.2. Market Analysis, Insights and Forecast - by Type
- 5.2.1. Virgin Fiber (VCF)
- 5.2.2. Recycled Fiber (RCF)
- 5.3. Market Analysis, Insights and Forecast - by Application
- 5.3.1. Composite Materials
- 5.3.2. Textiles
- 5.3.3. Microelectrodes
- 5.3.4. Catalysis
- 5.4. Market Analysis, Insights and Forecast - by End-user Industry
- 5.4.1. Aerospace and Defense
- 5.4.2. Alternative Energy
- 5.4.3. Automotive
- 5.4.4. Construction and Infrastructure
- 5.4.5. Sporting Goods
- 5.4.6. Other En
- 5.5. Market Analysis, Insights and Forecast - by Geography
- 5.5.1. China
- 5.5.2. India
- 5.5.3. Japan
- 5.5.4. South Korea
- 5.5.5. ASEAN Countries
- 5.5.6. Rest of Asia-Pacific
- 5.6. Market Analysis, Insights and Forecast - by Region
- 5.6.1. China
- 5.6.2. India
- 5.6.3. Japan
- 5.6.4. South Korea
- 5.6.5. ASEAN Countries
- 5.6.6. Rest of Asia Pacific
- 5.1. Market Analysis, Insights and Forecast - by Raw Material
- 6. Global APAC Carbon Fiber Building Materials Industry Analysis, Insights and Forecast, 2021-2033
- 6.1. Market Analysis, Insights and Forecast - by Raw Material
- 6.1.1. Polyacrtlonitrile (PAN)
- 6.1.2. Petroleum Pitch and Rayon
- 6.2. Market Analysis, Insights and Forecast - by Type
- 6.2.1. Virgin Fiber (VCF)
- 6.2.2. Recycled Fiber (RCF)
- 6.3. Market Analysis, Insights and Forecast - by Application
- 6.3.1. Composite Materials
- 6.3.2. Textiles
- 6.3.3. Microelectrodes
- 6.3.4. Catalysis
- 6.4. Market Analysis, Insights and Forecast - by End-user Industry
- 6.4.1. Aerospace and Defense
- 6.4.2. Alternative Energy
- 6.4.3. Automotive
- 6.4.4. Construction and Infrastructure
- 6.4.5. Sporting Goods
- 6.4.6. Other En
- 6.5. Market Analysis, Insights and Forecast - by Geography
- 6.5.1. China
- 6.5.2. India
- 6.5.3. Japan
- 6.5.4. South Korea
- 6.5.5. ASEAN Countries
- 6.5.6. Rest of Asia-Pacific
- 6.1. Market Analysis, Insights and Forecast - by Raw Material
- 7. China APAC Carbon Fiber Building Materials Industry Analysis, Insights and Forecast, 2020-2032
- 7.1. Market Analysis, Insights and Forecast - by Raw Material
- 7.1.1. Polyacrtlonitrile (PAN)
- 7.1.2. Petroleum Pitch and Rayon
- 7.2. Market Analysis, Insights and Forecast - by Type
- 7.2.1. Virgin Fiber (VCF)
- 7.2.2. Recycled Fiber (RCF)
- 7.3. Market Analysis, Insights and Forecast - by Application
- 7.3.1. Composite Materials
- 7.3.2. Textiles
- 7.3.3. Microelectrodes
- 7.3.4. Catalysis
- 7.4. Market Analysis, Insights and Forecast - by End-user Industry
- 7.4.1. Aerospace and Defense
- 7.4.2. Alternative Energy
- 7.4.3. Automotive
- 7.4.4. Construction and Infrastructure
- 7.4.5. Sporting Goods
- 7.4.6. Other En
- 7.5. Market Analysis, Insights and Forecast - by Geography
- 7.5.1. China
- 7.5.2. India
- 7.5.3. Japan
- 7.5.4. South Korea
- 7.5.5. ASEAN Countries
- 7.5.6. Rest of Asia-Pacific
- 7.1. Market Analysis, Insights and Forecast - by Raw Material
- 8. India APAC Carbon Fiber Building Materials Industry Analysis, Insights and Forecast, 2020-2032
- 8.1. Market Analysis, Insights and Forecast - by Raw Material
- 8.1.1. Polyacrtlonitrile (PAN)
- 8.1.2. Petroleum Pitch and Rayon
- 8.2. Market Analysis, Insights and Forecast - by Type
- 8.2.1. Virgin Fiber (VCF)
- 8.2.2. Recycled Fiber (RCF)
- 8.3. Market Analysis, Insights and Forecast - by Application
- 8.3.1. Composite Materials
- 8.3.2. Textiles
- 8.3.3. Microelectrodes
- 8.3.4. Catalysis
- 8.4. Market Analysis, Insights and Forecast - by End-user Industry
- 8.4.1. Aerospace and Defense
- 8.4.2. Alternative Energy
- 8.4.3. Automotive
- 8.4.4. Construction and Infrastructure
- 8.4.5. Sporting Goods
- 8.4.6. Other En
- 8.5. Market Analysis, Insights and Forecast - by Geography
- 8.5.1. China
- 8.5.2. India
- 8.5.3. Japan
- 8.5.4. South Korea
- 8.5.5. ASEAN Countries
- 8.5.6. Rest of Asia-Pacific
- 8.1. Market Analysis, Insights and Forecast - by Raw Material
- 9. Japan APAC Carbon Fiber Building Materials Industry Analysis, Insights and Forecast, 2020-2032
- 9.1. Market Analysis, Insights and Forecast - by Raw Material
- 9.1.1. Polyacrtlonitrile (PAN)
- 9.1.2. Petroleum Pitch and Rayon
- 9.2. Market Analysis, Insights and Forecast - by Type
- 9.2.1. Virgin Fiber (VCF)
- 9.2.2. Recycled Fiber (RCF)
- 9.3. Market Analysis, Insights and Forecast - by Application
- 9.3.1. Composite Materials
- 9.3.2. Textiles
- 9.3.3. Microelectrodes
- 9.3.4. Catalysis
- 9.4. Market Analysis, Insights and Forecast - by End-user Industry
- 9.4.1. Aerospace and Defense
- 9.4.2. Alternative Energy
- 9.4.3. Automotive
- 9.4.4. Construction and Infrastructure
- 9.4.5. Sporting Goods
- 9.4.6. Other En
- 9.5. Market Analysis, Insights and Forecast - by Geography
- 9.5.1. China
- 9.5.2. India
- 9.5.3. Japan
- 9.5.4. South Korea
- 9.5.5. ASEAN Countries
- 9.5.6. Rest of Asia-Pacific
- 9.1. Market Analysis, Insights and Forecast - by Raw Material
- 10. South Korea APAC Carbon Fiber Building Materials Industry Analysis, Insights and Forecast, 2020-2032
- 10.1. Market Analysis, Insights and Forecast - by Raw Material
- 10.1.1. Polyacrtlonitrile (PAN)
- 10.1.2. Petroleum Pitch and Rayon
- 10.2. Market Analysis, Insights and Forecast - by Type
- 10.2.1. Virgin Fiber (VCF)
- 10.2.2. Recycled Fiber (RCF)
- 10.3. Market Analysis, Insights and Forecast - by Application
- 10.3.1. Composite Materials
- 10.3.2. Textiles
- 10.3.3. Microelectrodes
- 10.3.4. Catalysis
- 10.4. Market Analysis, Insights and Forecast - by End-user Industry
- 10.4.1. Aerospace and Defense
- 10.4.2. Alternative Energy
- 10.4.3. Automotive
- 10.4.4. Construction and Infrastructure
- 10.4.5. Sporting Goods
- 10.4.6. Other En
- 10.5. Market Analysis, Insights and Forecast - by Geography
- 10.5.1. China
- 10.5.2. India
- 10.5.3. Japan
- 10.5.4. South Korea
- 10.5.5. ASEAN Countries
- 10.5.6. Rest of Asia-Pacific
- 10.1. Market Analysis, Insights and Forecast - by Raw Material
- 11. ASEAN Countries APAC Carbon Fiber Building Materials Industry Analysis, Insights and Forecast, 2020-2032
- 11.1. Market Analysis, Insights and Forecast - by Raw Material
- 11.1.1. Polyacrtlonitrile (PAN)
- 11.1.2. Petroleum Pitch and Rayon
- 11.2. Market Analysis, Insights and Forecast - by Type
- 11.2.1. Virgin Fiber (VCF)
- 11.2.2. Recycled Fiber (RCF)
- 11.3. Market Analysis, Insights and Forecast - by Application
- 11.3.1. Composite Materials
- 11.3.2. Textiles
- 11.3.3. Microelectrodes
- 11.3.4. Catalysis
- 11.4. Market Analysis, Insights and Forecast - by End-user Industry
- 11.4.1. Aerospace and Defense
- 11.4.2. Alternative Energy
- 11.4.3. Automotive
- 11.4.4. Construction and Infrastructure
- 11.4.5. Sporting Goods
- 11.4.6. Other En
- 11.5. Market Analysis, Insights and Forecast - by Geography
- 11.5.1. China
- 11.5.2. India
- 11.5.3. Japan
- 11.5.4. South Korea
- 11.5.5. ASEAN Countries
- 11.5.6. Rest of Asia-Pacific
- 11.1. Market Analysis, Insights and Forecast - by Raw Material
- 12. Rest of Asia Pacific APAC Carbon Fiber Building Materials Industry Analysis, Insights and Forecast, 2020-2032
- 12.1. Market Analysis, Insights and Forecast - by Raw Material
- 12.1.1. Polyacrtlonitrile (PAN)
- 12.1.2. Petroleum Pitch and Rayon
- 12.2. Market Analysis, Insights and Forecast - by Type
- 12.2.1. Virgin Fiber (VCF)
- 12.2.2. Recycled Fiber (RCF)
- 12.3. Market Analysis, Insights and Forecast - by Application
- 12.3.1. Composite Materials
- 12.3.2. Textiles
- 12.3.3. Microelectrodes
- 12.3.4. Catalysis
- 12.4. Market Analysis, Insights and Forecast - by End-user Industry
- 12.4.1. Aerospace and Defense
- 12.4.2. Alternative Energy
- 12.4.3. Automotive
- 12.4.4. Construction and Infrastructure
- 12.4.5. Sporting Goods
- 12.4.6. Other En
- 12.5. Market Analysis, Insights and Forecast - by Geography
- 12.5.1. China
- 12.5.2. India
- 12.5.3. Japan
- 12.5.4. South Korea
- 12.5.5. ASEAN Countries
- 12.5.6. Rest of Asia-Pacific
- 12.1. Market Analysis, Insights and Forecast - by Raw Material
- 13. Competitive Analysis
- 13.1. Company Profiles
- 13.1.1 SGL Carbon
- 13.1.1.1. Company Overview
- 13.1.1.2. Products
- 13.1.1.3. Company Financials
- 13.1.1.4. SWOT Analysis
- 13.1.2 Solvay
- 13.1.2.1. Company Overview
- 13.1.2.2. Products
- 13.1.2.3. Company Financials
- 13.1.2.4. SWOT Analysis
- 13.1.3 Anshan Sinocarb Carbon Fibers Co Ltd
- 13.1.3.1. Company Overview
- 13.1.3.2. Products
- 13.1.3.3. Company Financials
- 13.1.3.4. SWOT Analysis
- 13.1.4 HYOSUNG ADVANCED MATERIALS
- 13.1.4.1. Company Overview
- 13.1.4.2. Products
- 13.1.4.3. Company Financials
- 13.1.4.4. SWOT Analysis
- 13.1.5 Nippon Graphite Fiber Co Ltd
- 13.1.5.1. Company Overview
- 13.1.5.2. Products
- 13.1.5.3. Company Financials
- 13.1.5.4. SWOT Analysis
- 13.1.6 TORAY INDUSTRIES INC
- 13.1.6.1. Company Overview
- 13.1.6.2. Products
- 13.1.6.3. Company Financials
- 13.1.6.4. SWOT Analysis
- 13.1.7 Mitsubishi Chemical Carbon Fiber and Composites Inc
- 13.1.7.1. Company Overview
- 13.1.7.2. Products
- 13.1.7.3. Company Financials
- 13.1.7.4. SWOT Analysis
- 13.1.8 Hexcel Corporation
- 13.1.8.1. Company Overview
- 13.1.8.2. Products
- 13.1.8.3. Company Financials
- 13.1.8.4. SWOT Analysis
- 13.1.9 Formosa Plastics Corporation
- 13.1.9.1. Company Overview
- 13.1.9.2. Products
- 13.1.9.3. Company Financials
- 13.1.9.4. SWOT Analysis
- 13.1.10 TEIJIN LIMITED
- 13.1.10.1. Company Overview
- 13.1.10.2. Products
- 13.1.10.3. Company Financials
- 13.1.10.4. SWOT Analysis
- 13.1.11 Zhongfu Shenying Carbon Fiber Co Ltd*List Not Exhaustive
- 13.1.11.1. Company Overview
- 13.1.11.2. Products
- 13.1.11.3. Company Financials
- 13.1.11.4. SWOT Analysis
- 13.1.1 SGL Carbon
- 13.2. Market Entropy
- 13.2.1 Company's Key Areas Served
- 13.2.2 Recent Developments
- 13.3. Company Market Share Analysis 2025
- 13.3.1 Top 5 Companies Market Share Analysis
- 13.3.2 Top 3 Companies Market Share Analysis
- 13.4. List of Potential Customers
- 14. Research Methodology
List of Figures
- Figure 1: Global APAC Carbon Fiber Building Materials Industry Revenue Breakdown (billion, %) by Region 2025 & 2033
- Figure 2: China APAC Carbon Fiber Building Materials Industry Revenue (billion), by Raw Material 2025 & 2033
- Figure 3: China APAC Carbon Fiber Building Materials Industry Revenue Share (%), by Raw Material 2025 & 2033
- Figure 4: China APAC Carbon Fiber Building Materials Industry Revenue (billion), by Type 2025 & 2033
- Figure 5: China APAC Carbon Fiber Building Materials Industry Revenue Share (%), by Type 2025 & 2033
- Figure 6: China APAC Carbon Fiber Building Materials Industry Revenue (billion), by Application 2025 & 2033
- Figure 7: China APAC Carbon Fiber Building Materials Industry Revenue Share (%), by Application 2025 & 2033
- Figure 8: China APAC Carbon Fiber Building Materials Industry Revenue (billion), by End-user Industry 2025 & 2033
- Figure 9: China APAC Carbon Fiber Building Materials Industry Revenue Share (%), by End-user Industry 2025 & 2033
- Figure 10: China APAC Carbon Fiber Building Materials Industry Revenue (billion), by Geography 2025 & 2033
- Figure 11: China APAC Carbon Fiber Building Materials Industry Revenue Share (%), by Geography 2025 & 2033
- Figure 12: China APAC Carbon Fiber Building Materials Industry Revenue (billion), by Country 2025 & 2033
- Figure 13: China APAC Carbon Fiber Building Materials Industry Revenue Share (%), by Country 2025 & 2033
- Figure 14: India APAC Carbon Fiber Building Materials Industry Revenue (billion), by Raw Material 2025 & 2033
- Figure 15: India APAC Carbon Fiber Building Materials Industry Revenue Share (%), by Raw Material 2025 & 2033
- Figure 16: India APAC Carbon Fiber Building Materials Industry Revenue (billion), by Type 2025 & 2033
- Figure 17: India APAC Carbon Fiber Building Materials Industry Revenue Share (%), by Type 2025 & 2033
- Figure 18: India APAC Carbon Fiber Building Materials Industry Revenue (billion), by Application 2025 & 2033
- Figure 19: India APAC Carbon Fiber Building Materials Industry Revenue Share (%), by Application 2025 & 2033
- Figure 20: India APAC Carbon Fiber Building Materials Industry Revenue (billion), by End-user Industry 2025 & 2033
- Figure 21: India APAC Carbon Fiber Building Materials Industry Revenue Share (%), by End-user Industry 2025 & 2033
- Figure 22: India APAC Carbon Fiber Building Materials Industry Revenue (billion), by Geography 2025 & 2033
- Figure 23: India APAC Carbon Fiber Building Materials Industry Revenue Share (%), by Geography 2025 & 2033
- Figure 24: India APAC Carbon Fiber Building Materials Industry Revenue (billion), by Country 2025 & 2033
- Figure 25: India APAC Carbon Fiber Building Materials Industry Revenue Share (%), by Country 2025 & 2033
- Figure 26: Japan APAC Carbon Fiber Building Materials Industry Revenue (billion), by Raw Material 2025 & 2033
- Figure 27: Japan APAC Carbon Fiber Building Materials Industry Revenue Share (%), by Raw Material 2025 & 2033
- Figure 28: Japan APAC Carbon Fiber Building Materials Industry Revenue (billion), by Type 2025 & 2033
- Figure 29: Japan APAC Carbon Fiber Building Materials Industry Revenue Share (%), by Type 2025 & 2033
- Figure 30: Japan APAC Carbon Fiber Building Materials Industry Revenue (billion), by Application 2025 & 2033
- Figure 31: Japan APAC Carbon Fiber Building Materials Industry Revenue Share (%), by Application 2025 & 2033
- Figure 32: Japan APAC Carbon Fiber Building Materials Industry Revenue (billion), by End-user Industry 2025 & 2033
- Figure 33: Japan APAC Carbon Fiber Building Materials Industry Revenue Share (%), by End-user Industry 2025 & 2033
- Figure 34: Japan APAC Carbon Fiber Building Materials Industry Revenue (billion), by Geography 2025 & 2033
- Figure 35: Japan APAC Carbon Fiber Building Materials Industry Revenue Share (%), by Geography 2025 & 2033
- Figure 36: Japan APAC Carbon Fiber Building Materials Industry Revenue (billion), by Country 2025 & 2033
- Figure 37: Japan APAC Carbon Fiber Building Materials Industry Revenue Share (%), by Country 2025 & 2033
- Figure 38: South Korea APAC Carbon Fiber Building Materials Industry Revenue (billion), by Raw Material 2025 & 2033
- Figure 39: South Korea APAC Carbon Fiber Building Materials Industry Revenue Share (%), by Raw Material 2025 & 2033
- Figure 40: South Korea APAC Carbon Fiber Building Materials Industry Revenue (billion), by Type 2025 & 2033
- Figure 41: South Korea APAC Carbon Fiber Building Materials Industry Revenue Share (%), by Type 2025 & 2033
- Figure 42: South Korea APAC Carbon Fiber Building Materials Industry Revenue (billion), by Application 2025 & 2033
- Figure 43: South Korea APAC Carbon Fiber Building Materials Industry Revenue Share (%), by Application 2025 & 2033
- Figure 44: South Korea APAC Carbon Fiber Building Materials Industry Revenue (billion), by End-user Industry 2025 & 2033
- Figure 45: South Korea APAC Carbon Fiber Building Materials Industry Revenue Share (%), by End-user Industry 2025 & 2033
- Figure 46: South Korea APAC Carbon Fiber Building Materials Industry Revenue (billion), by Geography 2025 & 2033
- Figure 47: South Korea APAC Carbon Fiber Building Materials Industry Revenue Share (%), by Geography 2025 & 2033
- Figure 48: South Korea APAC Carbon Fiber Building Materials Industry Revenue (billion), by Country 2025 & 2033
- Figure 49: South Korea APAC Carbon Fiber Building Materials Industry Revenue Share (%), by Country 2025 & 2033
- Figure 50: ASEAN Countries APAC Carbon Fiber Building Materials Industry Revenue (billion), by Raw Material 2025 & 2033
- Figure 51: ASEAN Countries APAC Carbon Fiber Building Materials Industry Revenue Share (%), by Raw Material 2025 & 2033
- Figure 52: ASEAN Countries APAC Carbon Fiber Building Materials Industry Revenue (billion), by Type 2025 & 2033
- Figure 53: ASEAN Countries APAC Carbon Fiber Building Materials Industry Revenue Share (%), by Type 2025 & 2033
- Figure 54: ASEAN Countries APAC Carbon Fiber Building Materials Industry Revenue (billion), by Application 2025 & 2033
- Figure 55: ASEAN Countries APAC Carbon Fiber Building Materials Industry Revenue Share (%), by Application 2025 & 2033
- Figure 56: ASEAN Countries APAC Carbon Fiber Building Materials Industry Revenue (billion), by End-user Industry 2025 & 2033
- Figure 57: ASEAN Countries APAC Carbon Fiber Building Materials Industry Revenue Share (%), by End-user Industry 2025 & 2033
- Figure 58: ASEAN Countries APAC Carbon Fiber Building Materials Industry Revenue (billion), by Geography 2025 & 2033
- Figure 59: ASEAN Countries APAC Carbon Fiber Building Materials Industry Revenue Share (%), by Geography 2025 & 2033
- Figure 60: ASEAN Countries APAC Carbon Fiber Building Materials Industry Revenue (billion), by Country 2025 & 2033
- Figure 61: ASEAN Countries APAC Carbon Fiber Building Materials Industry Revenue Share (%), by Country 2025 & 2033
- Figure 62: Rest of Asia Pacific APAC Carbon Fiber Building Materials Industry Revenue (billion), by Raw Material 2025 & 2033
- Figure 63: Rest of Asia Pacific APAC Carbon Fiber Building Materials Industry Revenue Share (%), by Raw Material 2025 & 2033
- Figure 64: Rest of Asia Pacific APAC Carbon Fiber Building Materials Industry Revenue (billion), by Type 2025 & 2033
- Figure 65: Rest of Asia Pacific APAC Carbon Fiber Building Materials Industry Revenue Share (%), by Type 2025 & 2033
- Figure 66: Rest of Asia Pacific APAC Carbon Fiber Building Materials Industry Revenue (billion), by Application 2025 & 2033
- Figure 67: Rest of Asia Pacific APAC Carbon Fiber Building Materials Industry Revenue Share (%), by Application 2025 & 2033
- Figure 68: Rest of Asia Pacific APAC Carbon Fiber Building Materials Industry Revenue (billion), by End-user Industry 2025 & 2033
- Figure 69: Rest of Asia Pacific APAC Carbon Fiber Building Materials Industry Revenue Share (%), by End-user Industry 2025 & 2033
- Figure 70: Rest of Asia Pacific APAC Carbon Fiber Building Materials Industry Revenue (billion), by Geography 2025 & 2033
- Figure 71: Rest of Asia Pacific APAC Carbon Fiber Building Materials Industry Revenue Share (%), by Geography 2025 & 2033
- Figure 72: Rest of Asia Pacific APAC Carbon Fiber Building Materials Industry Revenue (billion), by Country 2025 & 2033
- Figure 73: Rest of Asia Pacific APAC Carbon Fiber Building Materials Industry Revenue Share (%), by Country 2025 & 2033
List of Tables
- Table 1: Global APAC Carbon Fiber Building Materials Industry Revenue billion Forecast, by Raw Material 2020 & 2033
- Table 2: Global APAC Carbon Fiber Building Materials Industry Revenue billion Forecast, by Type 2020 & 2033
- Table 3: Global APAC Carbon Fiber Building Materials Industry Revenue billion Forecast, by Application 2020 & 2033
- Table 4: Global APAC Carbon Fiber Building Materials Industry Revenue billion Forecast, by End-user Industry 2020 & 2033
- Table 5: Global APAC Carbon Fiber Building Materials Industry Revenue billion Forecast, by Geography 2020 & 2033
- Table 6: Global APAC Carbon Fiber Building Materials Industry Revenue billion Forecast, by Region 2020 & 2033
- Table 7: Global APAC Carbon Fiber Building Materials Industry Revenue billion Forecast, by Raw Material 2020 & 2033
- Table 8: Global APAC Carbon Fiber Building Materials Industry Revenue billion Forecast, by Type 2020 & 2033
- Table 9: Global APAC Carbon Fiber Building Materials Industry Revenue billion Forecast, by Application 2020 & 2033
- Table 10: Global APAC Carbon Fiber Building Materials Industry Revenue billion Forecast, by End-user Industry 2020 & 2033
- Table 11: Global APAC Carbon Fiber Building Materials Industry Revenue billion Forecast, by Geography 2020 & 2033
- Table 12: Global APAC Carbon Fiber Building Materials Industry Revenue billion Forecast, by Country 2020 & 2033
- Table 13: Global APAC Carbon Fiber Building Materials Industry Revenue billion Forecast, by Raw Material 2020 & 2033
- Table 14: Global APAC Carbon Fiber Building Materials Industry Revenue billion Forecast, by Type 2020 & 2033
- Table 15: Global APAC Carbon Fiber Building Materials Industry Revenue billion Forecast, by Application 2020 & 2033
- Table 16: Global APAC Carbon Fiber Building Materials Industry Revenue billion Forecast, by End-user Industry 2020 & 2033
- Table 17: Global APAC Carbon Fiber Building Materials Industry Revenue billion Forecast, by Geography 2020 & 2033
- Table 18: Global APAC Carbon Fiber Building Materials Industry Revenue billion Forecast, by Country 2020 & 2033
- Table 19: Global APAC Carbon Fiber Building Materials Industry Revenue billion Forecast, by Raw Material 2020 & 2033
- Table 20: Global APAC Carbon Fiber Building Materials Industry Revenue billion Forecast, by Type 2020 & 2033
- Table 21: Global APAC Carbon Fiber Building Materials Industry Revenue billion Forecast, by Application 2020 & 2033
- Table 22: Global APAC Carbon Fiber Building Materials Industry Revenue billion Forecast, by End-user Industry 2020 & 2033
- Table 23: Global APAC Carbon Fiber Building Materials Industry Revenue billion Forecast, by Geography 2020 & 2033
- Table 24: Global APAC Carbon Fiber Building Materials Industry Revenue billion Forecast, by Country 2020 & 2033
- Table 25: Global APAC Carbon Fiber Building Materials Industry Revenue billion Forecast, by Raw Material 2020 & 2033
- Table 26: Global APAC Carbon Fiber Building Materials Industry Revenue billion Forecast, by Type 2020 & 2033
- Table 27: Global APAC Carbon Fiber Building Materials Industry Revenue billion Forecast, by Application 2020 & 2033
- Table 28: Global APAC Carbon Fiber Building Materials Industry Revenue billion Forecast, by End-user Industry 2020 & 2033
- Table 29: Global APAC Carbon Fiber Building Materials Industry Revenue billion Forecast, by Geography 2020 & 2033
- Table 30: Global APAC Carbon Fiber Building Materials Industry Revenue billion Forecast, by Country 2020 & 2033
- Table 31: Global APAC Carbon Fiber Building Materials Industry Revenue billion Forecast, by Raw Material 2020 & 2033
- Table 32: Global APAC Carbon Fiber Building Materials Industry Revenue billion Forecast, by Type 2020 & 2033
- Table 33: Global APAC Carbon Fiber Building Materials Industry Revenue billion Forecast, by Application 2020 & 2033
- Table 34: Global APAC Carbon Fiber Building Materials Industry Revenue billion Forecast, by End-user Industry 2020 & 2033
- Table 35: Global APAC Carbon Fiber Building Materials Industry Revenue billion Forecast, by Geography 2020 & 2033
- Table 36: Global APAC Carbon Fiber Building Materials Industry Revenue billion Forecast, by Country 2020 & 2033
- Table 37: Global APAC Carbon Fiber Building Materials Industry Revenue billion Forecast, by Raw Material 2020 & 2033
- Table 38: Global APAC Carbon Fiber Building Materials Industry Revenue billion Forecast, by Type 2020 & 2033
- Table 39: Global APAC Carbon Fiber Building Materials Industry Revenue billion Forecast, by Application 2020 & 2033
- Table 40: Global APAC Carbon Fiber Building Materials Industry Revenue billion Forecast, by End-user Industry 2020 & 2033
- Table 41: Global APAC Carbon Fiber Building Materials Industry Revenue billion Forecast, by Geography 2020 & 2033
- Table 42: Global APAC Carbon Fiber Building Materials Industry Revenue billion Forecast, by Country 2020 & 2033
Frequently Asked Questions
1. What is the projected Compound Annual Growth Rate (CAGR) of the APAC Carbon Fiber Building Materials Industry?
The projected CAGR is approximately 10.9%.
2. Which companies are prominent players in the APAC Carbon Fiber Building Materials Industry?
Key companies in the market include SGL Carbon, Solvay, Anshan Sinocarb Carbon Fibers Co Ltd, HYOSUNG ADVANCED MATERIALS, Nippon Graphite Fiber Co Ltd, TORAY INDUSTRIES INC, Mitsubishi Chemical Carbon Fiber and Composites Inc, Hexcel Corporation, Formosa Plastics Corporation, TEIJIN LIMITED, Zhongfu Shenying Carbon Fiber Co Ltd*List Not Exhaustive.
3. What are the main segments of the APAC Carbon Fiber Building Materials Industry?
The market segments include Raw Material, Type, Application, End-user Industry, Geography.
4. Can you provide details about the market size?
The market size is estimated to be USD 6.4 billion as of 2022.
5. What are some drivers contributing to market growth?
Increasing Demand for Fuel-efficient and Lightweight Vehicles.
6. What are the notable trends driving market growth?
Aerospace and Defense Segment to Dominate the Market.
7. Are there any restraints impacting market growth?
Concerns Related to Raw Materials.
8. Can you provide examples of recent developments in the market?
In April 2021, Hyosung Advanced Materials announced that it had signed a long-term contract to supply Hanwha Solutions with high-strength carbon fiber to be used to reinforce fuel tanks for hydrogen vehicles for six years from 2021. The supply is worth about 160 billion won (USD 144 million).
9. What pricing options are available for accessing the report?
Pricing options include single-user, multi-user, and enterprise licenses priced at USD 4750, USD 5250, and USD 8750 respectively.
10. Is the market size provided in terms of value or volume?
The market size is provided in terms of value, measured in billion.
11. Are there any specific market keywords associated with the report?
Yes, the market keyword associated with the report is "APAC Carbon Fiber Building Materials Industry," which aids in identifying and referencing the specific market segment covered.
12. How do I determine which pricing option suits my needs best?
The pricing options vary based on user requirements and access needs. Individual users may opt for single-user licenses, while businesses requiring broader access may choose multi-user or enterprise licenses for cost-effective access to the report.
13. Are there any additional resources or data provided in the APAC Carbon Fiber Building Materials Industry report?
While the report offers comprehensive insights, it's advisable to review the specific contents or supplementary materials provided to ascertain if additional resources or data are available.
14. How can I stay updated on further developments or reports in the APAC Carbon Fiber Building Materials Industry?
To stay informed about further developments, trends, and reports in the APAC Carbon Fiber Building Materials Industry, consider subscribing to industry newsletters, following relevant companies and organizations, or regularly checking reputable industry news sources and publications.
Methodology
Step 1 - Identification of Relevant Samples Size from Population Database


Step 2 - Approaches for Defining Global Market Size (Value, Volume* & Price*)

Note*: In applicable scenarios
Step 3 - Data Sources
Primary Research
- Web Analytics
- Survey Reports
- Research Institute
- Latest Research Reports
- Opinion Leaders
Secondary Research
- Annual Reports
- White Paper
- Latest Press Release
- Industry Association
- Paid Database
- Investor Presentations

Step 4 - Data Triangulation
Involves using different sources of information in order to increase the validity of a study
These sources are likely to be stakeholders in a program - participants, other researchers, program staff, other community members, and so on.
Then we put all data in single framework & apply various statistical tools to find out the dynamic on the market.
During the analysis stage, feedback from the stakeholder groups would be compared to determine areas of agreement as well as areas of divergence