

Key Insights
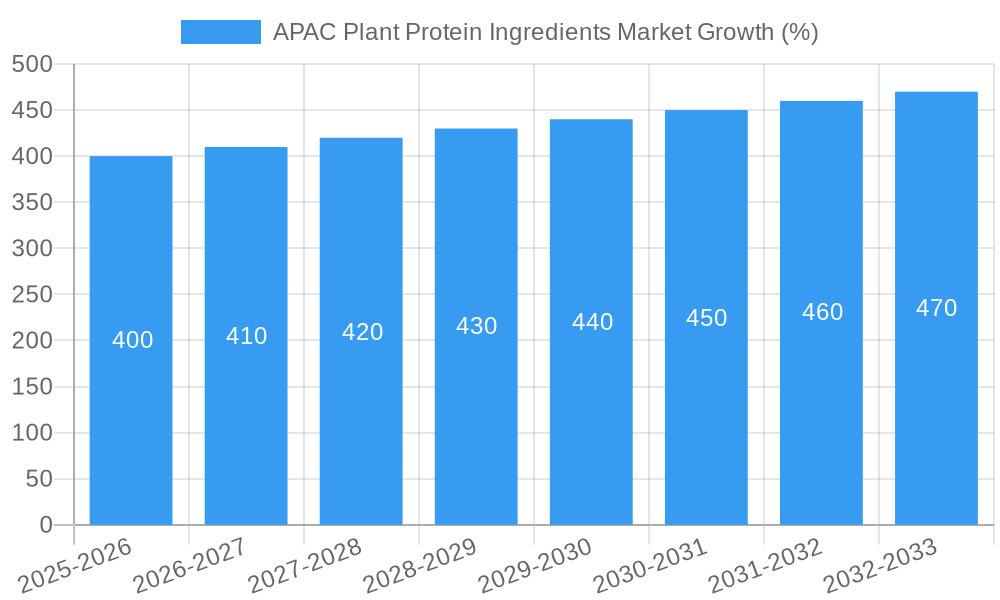
The Asia-Pacific (APAC) plant protein ingredients market is experiencing robust growth, driven by increasing consumer demand for plant-based foods and beverages, coupled with rising health consciousness and the adoption of vegetarian and vegan lifestyles. The market's expansion is fueled by several key factors. Firstly, the region boasts a large and burgeoning population, with a significant portion embracing alternative protein sources. Secondly, government initiatives promoting sustainable food systems and reduced reliance on animal agriculture are further boosting market acceptance. Thirdly, the food and beverage industry's innovation in incorporating plant-based proteins into various products – from meat alternatives to dairy-free options – is significantly contributing to market growth. While soy protein currently dominates the market, other plant protein sources like pea, hemp, and rice are gaining traction due to their unique nutritional profiles and functional properties. Specific countries like India, China, and Indonesia are exhibiting particularly strong growth due to their large populations and evolving dietary preferences. However, challenges such as price volatility of raw materials, technological limitations in processing certain plant proteins, and inconsistent product quality remain hurdles for sustained market expansion. Nevertheless, the overall growth trajectory remains positive, with the market expected to witness a significant increase in value over the next decade.
The competitive landscape is marked by both established global players and smaller regional companies. Large multinational companies like Archer Daniels Midland and Bunge Limited are leveraging their established supply chains and processing capabilities to cater to the growing demand. Meanwhile, local businesses are capitalizing on regional expertise and consumer preferences. Future growth will likely be influenced by advancements in protein extraction and processing technologies, leading to improved product quality and cost efficiency. Increased focus on sustainable sourcing and production practices will also be crucial for long-term market success. Furthermore, continued innovation in product formulation and diversification across various applications (animal feed, sports nutrition, etc.) will be paramount in driving sustained market expansion within the APAC region. The market segmentation shows significant potential for growth in both the food and beverage sector and the sports/performance nutrition segments. The continued growth of the food and beverage sector is expected to propel the market further.
APAC Plant Protein Ingredients Market Report: 2019-2033
This comprehensive report provides an in-depth analysis of the Asia-Pacific (APAC) plant protein ingredients market, covering the period from 2019 to 2033. With a focus on key market trends, competitive dynamics, and growth opportunities, this report is an essential resource for businesses operating in or planning to enter this dynamic sector. The market is projected to reach xx Million by 2033, exhibiting a robust CAGR. This report offers invaluable insights into market segmentation, key players, and future growth potential, empowering informed strategic decision-making.
APAC Plant Protein Ingredients Market Structure & Competitive Landscape
The APAC plant protein ingredients market exhibits a moderately concentrated structure, with several large multinational corporations and regional players dominating the landscape. The Herfindahl-Hirschman Index (HHI) for 2024 is estimated at xx, indicating a moderately consolidated market. Innovation plays a crucial role, with companies investing heavily in R&D to develop novel plant-based proteins and improve existing products. Regulatory frameworks vary across countries within the APAC region, influencing market dynamics and ingredient approvals. The market faces competition from traditional protein sources, but increasing consumer demand for plant-based alternatives is driving growth. Mergers and acquisitions (M&A) activity has been significant in recent years, with xx M&A deals recorded between 2019 and 2024. This activity reflects the strategic importance of this sector and the drive for market consolidation.
- Market Concentration: Moderately concentrated, HHI (2024) estimated at xx.
- Innovation Drivers: R&D investments in novel protein sources and improved processing technologies.
- Regulatory Impacts: Varying regulations across APAC nations influence market access and product approvals.
- Product Substitutes: Traditional animal-based proteins remain a key competitor.
- End-User Segmentation: Significant demand across food and beverages, animal feed, and sports nutrition.
- M&A Trends: High M&A activity, with xx deals from 2019-2024 indicating market consolidation.
APAC Plant Protein Ingredients Market Trends & Opportunities
The APAC plant protein ingredients market is experiencing significant growth, driven by several key factors. The market size is projected to expand from xx Million in 2024 to xx Million by 2033, exhibiting a CAGR of xx%. This growth is fueled by rising consumer awareness of health benefits linked to plant-based diets, coupled with the increasing adoption of vegan and vegetarian lifestyles across the region. Technological advancements in protein extraction and processing are leading to the development of improved products with enhanced functional properties. Consumer preferences are shifting towards healthier, more sustainable food choices, creating a strong market pull for plant-based ingredients. The market displays a highly competitive landscape, with major players constantly innovating to meet evolving consumer demands and gain market share. Market penetration of plant-based protein ingredients is steadily increasing, projected to reach xx% by 2033. The emergence of new protein sources and tailored ingredient solutions creates further significant growth opportunities.
Dominant Markets & Segments in APAC Plant Protein Ingredients Market
China remains the dominant market in the APAC region, accounting for approximately xx% of the total market value in 2024. India and other Southeast Asian countries are also showing rapid growth potential. In terms of protein types, soy protein maintains the largest market share, followed by pea protein, which is gaining significant traction due to its functional properties and sustainability. The food and beverages segment constitutes the largest end-user category, driven by the increasing demand for plant-based meat alternatives, dairy substitutes, and protein-enriched food products.
- Leading Region: China (xx% market share in 2024).
- High-Growth Countries: India, Indonesia, Vietnam.
- Dominant Protein Type: Soy Protein, followed by Pea Protein.
- Largest End-User Segment: Food and Beverages.
Growth Drivers:
- China: Rising disposable incomes, increasing health consciousness, and government support for the plant-based food industry.
- India: Expanding middle class, growing awareness of health benefits, and increasing vegetarian population.
- Southeast Asia: Rapid economic growth, adoption of Western dietary trends, and a young, health-conscious population.
APAC Plant Protein Ingredients Market Product Analysis
The market showcases continuous innovation in plant protein ingredient technology. Advancements in extraction methods lead to higher protein yields and improved functionality. Products are tailored to various applications, offering diverse functionalities such as texture enhancement, emulsification, and water binding. This targeted approach increases the market fit of plant protein ingredients in various applications, boosting their competitiveness against traditional protein sources.
Key Drivers, Barriers & Challenges in APAC Plant Protein Ingredients Market
Key Drivers:
The APAC plant protein ingredients market is primarily driven by the rising demand for vegetarian and vegan products, growing health consciousness, and increasing awareness of sustainability concerns. The supportive regulatory environment in some countries further fuels market expansion. Technological improvements in extraction and processing technologies result in improved product quality and efficiency.
Challenges:
The major challenges impacting growth include fluctuating raw material prices, stringent regulatory requirements, and strong competition from established players. Supply chain complexities and the need for further technological advancements to optimize cost and efficiency pose additional hurdles to market growth. Variations in consumer preferences across different APAC countries also pose a challenge.
Growth Drivers in the APAC Plant Protein Ingredients Market Market
The market is propelled by increasing health awareness and the growing popularity of plant-based diets. Government support for sustainable agriculture and the food processing industry also plays a significant role. Technological advancements enhancing protein extraction and improving product functionality are key growth drivers.
Challenges Impacting APAC Plant Protein Ingredients Market Growth
Supply chain disruptions, volatile raw material prices, and the stringent regulatory landscape in certain countries present significant barriers to market growth. Competition from established food companies and the need for continuous product innovation to satisfy evolving consumer preferences are also critical challenges.
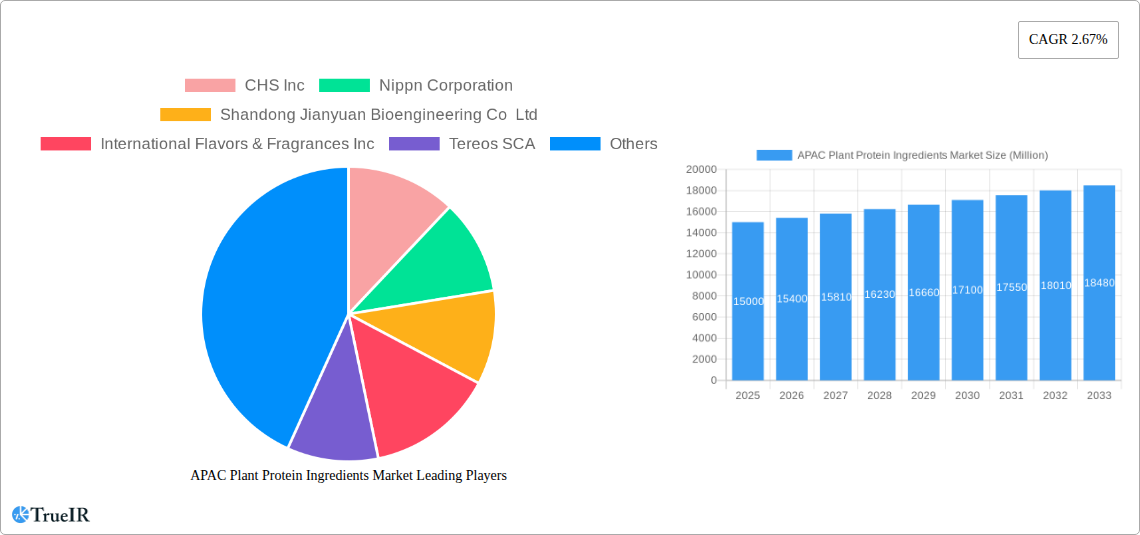
Key Players Shaping the APAC Plant Protein Ingredients Market Market
- CHS Inc
- Nippn Corporation
- Shandong Jianyuan Bioengineering Co Ltd
- International Flavors & Fragrances Inc
- Tereos SCA
- Wilmar International Lt
- Archer Daniels Midland Company
- Bunge Limited
- Fuji Oil Group
- Nagata Group
- Kerry Group PLC
- Südzucker AG
Significant APAC Plant Protein Ingredients Market Industry Milestones
- April 2021: ADM opened a new plant-based innovation lab in Singapore, boosting R&D capabilities in the APAC region.
- April 2021: Bunge Limited invested USD 45.7 Million in Australian Plant Proteins (APP), significantly increasing plant protein isolate production in Australia.
- May 2022: BENEO (a Südzucker subsidiary) acquired Meatless BV, expanding its range of texturizing solutions for meat alternatives.
Future Outlook for APAC Plant Protein Ingredients Market Market
The APAC plant protein ingredients market is poised for sustained growth, driven by increasing consumer demand for plant-based foods, technological innovations in processing techniques, and favorable government policies promoting sustainable agriculture. The market's expansion will create substantial opportunities for existing players and new entrants to capitalize on this dynamic market. Further growth is anticipated across diverse product applications, notably within the food and beverage industry, animal feed, and the expanding sports and performance nutrition sectors.
APAC Plant Protein Ingredients Market Segmentation
-
1. Protein Type
- 1.1. Hemp Protein
- 1.2. Pea Protein
- 1.3. Potato Protein
- 1.4. Rice Protein
- 1.5. Soy Protein
- 1.6. Wheat Protein
- 1.7. Other Plant Protein
-
2. End User
- 2.1. Animal Feed
-
2.2. Food and Beverages
-
2.2.1. By Sub End User
- 2.2.1.1. Bakery
- 2.2.1.2. Breakfast Cereals
- 2.2.1.3. Condiments/Sauces
- 2.2.1.4. Confectionery
- 2.2.1.5. Dairy and Dairy Alternative Products
- 2.2.1.6. Meat/Poultry/Seafood and Meat Alternative Products
- 2.2.1.7. RTE/RTC Food Products
- 2.2.1.8. Snacks
-
2.2.1. By Sub End User
- 2.3. Personal Care and Cosmetics
-
2.4. Supplements
- 2.4.1. Baby Food and Infant Formula
- 2.4.2. Elderly Nutrition and Medical Nutrition
- 2.4.3. Sport/Performance Nutrition
APAC Plant Protein Ingredients Market Segmentation By Geography
-
1. North America
- 1.1. United States
- 1.2. Canada
- 1.3. Mexico
-
2. South America
- 2.1. Brazil
- 2.2. Argentina
- 2.3. Rest of South America
-
3. Europe
- 3.1. United Kingdom
- 3.2. Germany
- 3.3. France
- 3.4. Italy
- 3.5. Spain
- 3.6. Russia
- 3.7. Benelux
- 3.8. Nordics
- 3.9. Rest of Europe
-
4. Middle East & Africa
- 4.1. Turkey
- 4.2. Israel
- 4.3. GCC
- 4.4. North Africa
- 4.5. South Africa
- 4.6. Rest of Middle East & Africa
-
5. Asia Pacific
- 5.1. China
- 5.2. India
- 5.3. Japan
- 5.4. South Korea
- 5.5. ASEAN
- 5.6. Oceania
- 5.7. Rest of Asia Pacific
APAC Plant Protein Ingredients Market REPORT HIGHLIGHTS
| Aspects | Details |
|---|---|
| Study Period | 2019-2033 |
| Base Year | 2024 |
| Estimated Year | 2025 |
| Forecast Period | 2025-2033 |
| Historical Period | 2019-2024 |
| Growth Rate | CAGR of 2.67% from 2019-2033 |
| Segmentation |
|
Table of Contents
- 1. Introduction
- 1.1. Research Scope
- 1.2. Market Segmentation
- 1.3. Research Methodology
- 1.4. Definitions and Assumptions
- 2. Executive Summary
- 2.1. Introduction
- 3. Market Dynamics
- 3.1. Introduction
- 3.2. Market Drivers
- 3.2.1. Increasing Demand for Organic Plant Proteins; Increasing Application of Pea Protein in Food and Beverages
- 3.3. Market Restrains
- 3.3.1. Presence of Alternative protein sources
- 3.4. Market Trends
- 3.4.1. OTHER KEY INDUSTRY TRENDS COVERED IN THE REPORT
- 4. Market Factor Analysis
- 4.1. Porters Five Forces
- 4.2. Supply/Value Chain
- 4.3. PESTEL analysis
- 4.4. Market Entropy
- 4.5. Patent/Trademark Analysis
- 5. Global APAC Plant Protein Ingredients Market Analysis, Insights and Forecast, 2019-2031
- 5.1. Market Analysis, Insights and Forecast - by Protein Type
- 5.1.1. Hemp Protein
- 5.1.2. Pea Protein
- 5.1.3. Potato Protein
- 5.1.4. Rice Protein
- 5.1.5. Soy Protein
- 5.1.6. Wheat Protein
- 5.1.7. Other Plant Protein
- 5.2. Market Analysis, Insights and Forecast - by End User
- 5.2.1. Animal Feed
- 5.2.2. Food and Beverages
- 5.2.2.1. By Sub End User
- 5.2.2.1.1. Bakery
- 5.2.2.1.2. Breakfast Cereals
- 5.2.2.1.3. Condiments/Sauces
- 5.2.2.1.4. Confectionery
- 5.2.2.1.5. Dairy and Dairy Alternative Products
- 5.2.2.1.6. Meat/Poultry/Seafood and Meat Alternative Products
- 5.2.2.1.7. RTE/RTC Food Products
- 5.2.2.1.8. Snacks
- 5.2.2.1. By Sub End User
- 5.2.3. Personal Care and Cosmetics
- 5.2.4. Supplements
- 5.2.4.1. Baby Food and Infant Formula
- 5.2.4.2. Elderly Nutrition and Medical Nutrition
- 5.2.4.3. Sport/Performance Nutrition
- 5.3. Market Analysis, Insights and Forecast - by Region
- 5.3.1. North America
- 5.3.2. South America
- 5.3.3. Europe
- 5.3.4. Middle East & Africa
- 5.3.5. Asia Pacific
- 5.1. Market Analysis, Insights and Forecast - by Protein Type
- 6. North America APAC Plant Protein Ingredients Market Analysis, Insights and Forecast, 2019-2031
- 6.1. Market Analysis, Insights and Forecast - by Protein Type
- 6.1.1. Hemp Protein
- 6.1.2. Pea Protein
- 6.1.3. Potato Protein
- 6.1.4. Rice Protein
- 6.1.5. Soy Protein
- 6.1.6. Wheat Protein
- 6.1.7. Other Plant Protein
- 6.2. Market Analysis, Insights and Forecast - by End User
- 6.2.1. Animal Feed
- 6.2.2. Food and Beverages
- 6.2.2.1. By Sub End User
- 6.2.2.1.1. Bakery
- 6.2.2.1.2. Breakfast Cereals
- 6.2.2.1.3. Condiments/Sauces
- 6.2.2.1.4. Confectionery
- 6.2.2.1.5. Dairy and Dairy Alternative Products
- 6.2.2.1.6. Meat/Poultry/Seafood and Meat Alternative Products
- 6.2.2.1.7. RTE/RTC Food Products
- 6.2.2.1.8. Snacks
- 6.2.2.1. By Sub End User
- 6.2.3. Personal Care and Cosmetics
- 6.2.4. Supplements
- 6.2.4.1. Baby Food and Infant Formula
- 6.2.4.2. Elderly Nutrition and Medical Nutrition
- 6.2.4.3. Sport/Performance Nutrition
- 6.1. Market Analysis, Insights and Forecast - by Protein Type
- 7. South America APAC Plant Protein Ingredients Market Analysis, Insights and Forecast, 2019-2031
- 7.1. Market Analysis, Insights and Forecast - by Protein Type
- 7.1.1. Hemp Protein
- 7.1.2. Pea Protein
- 7.1.3. Potato Protein
- 7.1.4. Rice Protein
- 7.1.5. Soy Protein
- 7.1.6. Wheat Protein
- 7.1.7. Other Plant Protein
- 7.2. Market Analysis, Insights and Forecast - by End User
- 7.2.1. Animal Feed
- 7.2.2. Food and Beverages
- 7.2.2.1. By Sub End User
- 7.2.2.1.1. Bakery
- 7.2.2.1.2. Breakfast Cereals
- 7.2.2.1.3. Condiments/Sauces
- 7.2.2.1.4. Confectionery
- 7.2.2.1.5. Dairy and Dairy Alternative Products
- 7.2.2.1.6. Meat/Poultry/Seafood and Meat Alternative Products
- 7.2.2.1.7. RTE/RTC Food Products
- 7.2.2.1.8. Snacks
- 7.2.2.1. By Sub End User
- 7.2.3. Personal Care and Cosmetics
- 7.2.4. Supplements
- 7.2.4.1. Baby Food and Infant Formula
- 7.2.4.2. Elderly Nutrition and Medical Nutrition
- 7.2.4.3. Sport/Performance Nutrition
- 7.1. Market Analysis, Insights and Forecast - by Protein Type
- 8. Europe APAC Plant Protein Ingredients Market Analysis, Insights and Forecast, 2019-2031
- 8.1. Market Analysis, Insights and Forecast - by Protein Type
- 8.1.1. Hemp Protein
- 8.1.2. Pea Protein
- 8.1.3. Potato Protein
- 8.1.4. Rice Protein
- 8.1.5. Soy Protein
- 8.1.6. Wheat Protein
- 8.1.7. Other Plant Protein
- 8.2. Market Analysis, Insights and Forecast - by End User
- 8.2.1. Animal Feed
- 8.2.2. Food and Beverages
- 8.2.2.1. By Sub End User
- 8.2.2.1.1. Bakery
- 8.2.2.1.2. Breakfast Cereals
- 8.2.2.1.3. Condiments/Sauces
- 8.2.2.1.4. Confectionery
- 8.2.2.1.5. Dairy and Dairy Alternative Products
- 8.2.2.1.6. Meat/Poultry/Seafood and Meat Alternative Products
- 8.2.2.1.7. RTE/RTC Food Products
- 8.2.2.1.8. Snacks
- 8.2.2.1. By Sub End User
- 8.2.3. Personal Care and Cosmetics
- 8.2.4. Supplements
- 8.2.4.1. Baby Food and Infant Formula
- 8.2.4.2. Elderly Nutrition and Medical Nutrition
- 8.2.4.3. Sport/Performance Nutrition
- 8.1. Market Analysis, Insights and Forecast - by Protein Type
- 9. Middle East & Africa APAC Plant Protein Ingredients Market Analysis, Insights and Forecast, 2019-2031
- 9.1. Market Analysis, Insights and Forecast - by Protein Type
- 9.1.1. Hemp Protein
- 9.1.2. Pea Protein
- 9.1.3. Potato Protein
- 9.1.4. Rice Protein
- 9.1.5. Soy Protein
- 9.1.6. Wheat Protein
- 9.1.7. Other Plant Protein
- 9.2. Market Analysis, Insights and Forecast - by End User
- 9.2.1. Animal Feed
- 9.2.2. Food and Beverages
- 9.2.2.1. By Sub End User
- 9.2.2.1.1. Bakery
- 9.2.2.1.2. Breakfast Cereals
- 9.2.2.1.3. Condiments/Sauces
- 9.2.2.1.4. Confectionery
- 9.2.2.1.5. Dairy and Dairy Alternative Products
- 9.2.2.1.6. Meat/Poultry/Seafood and Meat Alternative Products
- 9.2.2.1.7. RTE/RTC Food Products
- 9.2.2.1.8. Snacks
- 9.2.2.1. By Sub End User
- 9.2.3. Personal Care and Cosmetics
- 9.2.4. Supplements
- 9.2.4.1. Baby Food and Infant Formula
- 9.2.4.2. Elderly Nutrition and Medical Nutrition
- 9.2.4.3. Sport/Performance Nutrition
- 9.1. Market Analysis, Insights and Forecast - by Protein Type
- 10. Asia Pacific APAC Plant Protein Ingredients Market Analysis, Insights and Forecast, 2019-2031
- 10.1. Market Analysis, Insights and Forecast - by Protein Type
- 10.1.1. Hemp Protein
- 10.1.2. Pea Protein
- 10.1.3. Potato Protein
- 10.1.4. Rice Protein
- 10.1.5. Soy Protein
- 10.1.6. Wheat Protein
- 10.1.7. Other Plant Protein
- 10.2. Market Analysis, Insights and Forecast - by End User
- 10.2.1. Animal Feed
- 10.2.2. Food and Beverages
- 10.2.2.1. By Sub End User
- 10.2.2.1.1. Bakery
- 10.2.2.1.2. Breakfast Cereals
- 10.2.2.1.3. Condiments/Sauces
- 10.2.2.1.4. Confectionery
- 10.2.2.1.5. Dairy and Dairy Alternative Products
- 10.2.2.1.6. Meat/Poultry/Seafood and Meat Alternative Products
- 10.2.2.1.7. RTE/RTC Food Products
- 10.2.2.1.8. Snacks
- 10.2.2.1. By Sub End User
- 10.2.3. Personal Care and Cosmetics
- 10.2.4. Supplements
- 10.2.4.1. Baby Food and Infant Formula
- 10.2.4.2. Elderly Nutrition and Medical Nutrition
- 10.2.4.3. Sport/Performance Nutrition
- 10.1. Market Analysis, Insights and Forecast - by Protein Type
- 11. North America APAC Plant Protein Ingredients Market Analysis, Insights and Forecast, 2019-2031
- 11.1. Market Analysis, Insights and Forecast - By Country/Sub-region
- 11.1.1 United States
- 11.1.2 Canada
- 11.1.3 Mexico
- 11.1.4 Rest of North America
- 12. Europe APAC Plant Protein Ingredients Market Analysis, Insights and Forecast, 2019-2031
- 12.1. Market Analysis, Insights and Forecast - By Country/Sub-region
- 12.1.1 Germany
- 12.1.2 United Kingdom
- 12.1.3 France
- 12.1.4 Russia
- 12.1.5 Spain
- 12.1.6 Rest of Europe
- 13. Asia Pacific APAC Plant Protein Ingredients Market Analysis, Insights and Forecast, 2019-2031
- 13.1. Market Analysis, Insights and Forecast - By Country/Sub-region
- 13.1.1 India
- 13.1.2 China
- 13.1.3 Japan
- 13.1.4 Rest of Asia Pacific
- 14. South America APAC Plant Protein Ingredients Market Analysis, Insights and Forecast, 2019-2031
- 14.1. Market Analysis, Insights and Forecast - By Country/Sub-region
- 14.1.1 Brazil
- 14.1.2 Argentina
- 14.1.3 Rest of South America
- 15. Middle East APAC Plant Protein Ingredients Market Analysis, Insights and Forecast, 2019-2031
- 15.1. Market Analysis, Insights and Forecast - By Country/Sub-region
- 15.1.1 Middle East
- 15.1.2 Africa
- 16. United Arab Emirates APAC Plant Protein Ingredients Market Analysis, Insights and Forecast, 2019-2031
- 16.1. Market Analysis, Insights and Forecast - By Country/Sub-region
- 16.1.1 South Africa
- 16.1.2 Rest of Middle East
- 17. Competitive Analysis
- 17.1. Global Market Share Analysis 2024
- 17.2. Company Profiles
- 17.2.1 CHS Inc
- 17.2.1.1. Overview
- 17.2.1.2. Products
- 17.2.1.3. SWOT Analysis
- 17.2.1.4. Recent Developments
- 17.2.1.5. Financials (Based on Availability)
- 17.2.2 Nippn Corporation
- 17.2.2.1. Overview
- 17.2.2.2. Products
- 17.2.2.3. SWOT Analysis
- 17.2.2.4. Recent Developments
- 17.2.2.5. Financials (Based on Availability)
- 17.2.3 Shandong Jianyuan Bioengineering Co Ltd
- 17.2.3.1. Overview
- 17.2.3.2. Products
- 17.2.3.3. SWOT Analysis
- 17.2.3.4. Recent Developments
- 17.2.3.5. Financials (Based on Availability)
- 17.2.4 International Flavors & Fragrances Inc
- 17.2.4.1. Overview
- 17.2.4.2. Products
- 17.2.4.3. SWOT Analysis
- 17.2.4.4. Recent Developments
- 17.2.4.5. Financials (Based on Availability)
- 17.2.5 Tereos SCA
- 17.2.5.1. Overview
- 17.2.5.2. Products
- 17.2.5.3. SWOT Analysis
- 17.2.5.4. Recent Developments
- 17.2.5.5. Financials (Based on Availability)
- 17.2.6 Wilmar International Lt
- 17.2.6.1. Overview
- 17.2.6.2. Products
- 17.2.6.3. SWOT Analysis
- 17.2.6.4. Recent Developments
- 17.2.6.5. Financials (Based on Availability)
- 17.2.7 Archer Daniels Midland Company
- 17.2.7.1. Overview
- 17.2.7.2. Products
- 17.2.7.3. SWOT Analysis
- 17.2.7.4. Recent Developments
- 17.2.7.5. Financials (Based on Availability)
- 17.2.8 Bunge Limited
- 17.2.8.1. Overview
- 17.2.8.2. Products
- 17.2.8.3. SWOT Analysis
- 17.2.8.4. Recent Developments
- 17.2.8.5. Financials (Based on Availability)
- 17.2.9 Fuji Oil Group
- 17.2.9.1. Overview
- 17.2.9.2. Products
- 17.2.9.3. SWOT Analysis
- 17.2.9.4. Recent Developments
- 17.2.9.5. Financials (Based on Availability)
- 17.2.10 Nagata Group
- 17.2.10.1. Overview
- 17.2.10.2. Products
- 17.2.10.3. SWOT Analysis
- 17.2.10.4. Recent Developments
- 17.2.10.5. Financials (Based on Availability)
- 17.2.11 Kerry Group PLC
- 17.2.11.1. Overview
- 17.2.11.2. Products
- 17.2.11.3. SWOT Analysis
- 17.2.11.4. Recent Developments
- 17.2.11.5. Financials (Based on Availability)
- 17.2.12 Südzucker AG
- 17.2.12.1. Overview
- 17.2.12.2. Products
- 17.2.12.3. SWOT Analysis
- 17.2.12.4. Recent Developments
- 17.2.12.5. Financials (Based on Availability)
- 17.2.1 CHS Inc
List of Figures
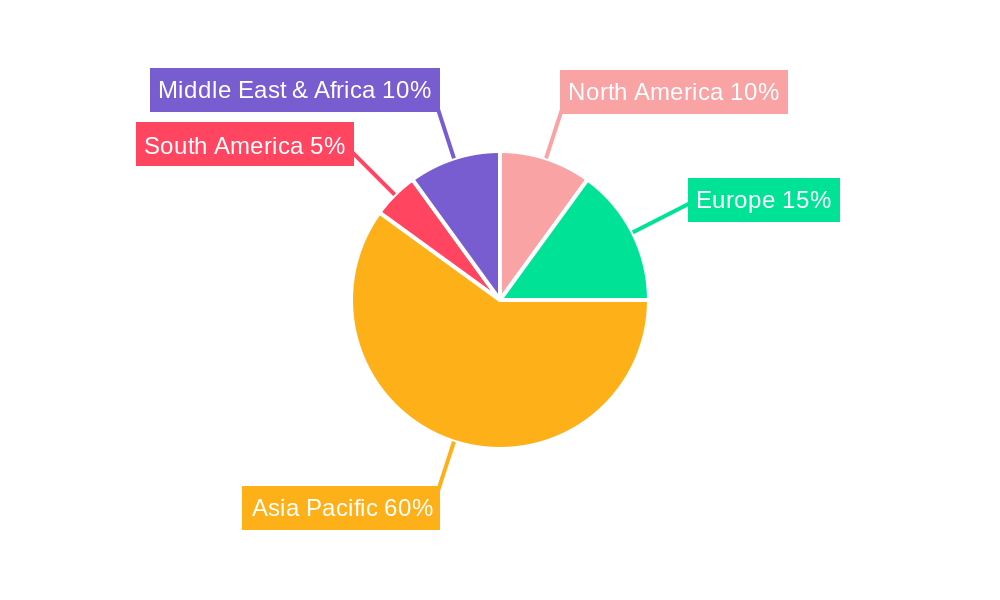
- Figure 1: Global APAC Plant Protein Ingredients Market Revenue Breakdown (Million, %) by Region 2024 & 2032
- Figure 2: Global APAC Plant Protein Ingredients Market Volume Breakdown (K Tons, %) by Region 2024 & 2032
- Figure 3: North America APAC Plant Protein Ingredients Market Revenue (Million), by Country 2024 & 2032
- Figure 4: North America APAC Plant Protein Ingredients Market Volume (K Tons), by Country 2024 & 2032
- Figure 5: North America APAC Plant Protein Ingredients Market Revenue Share (%), by Country 2024 & 2032
- Figure 6: North America APAC Plant Protein Ingredients Market Volume Share (%), by Country 2024 & 2032
- Figure 7: Europe APAC Plant Protein Ingredients Market Revenue (Million), by Country 2024 & 2032
- Figure 8: Europe APAC Plant Protein Ingredients Market Volume (K Tons), by Country 2024 & 2032
- Figure 9: Europe APAC Plant Protein Ingredients Market Revenue Share (%), by Country 2024 & 2032
- Figure 10: Europe APAC Plant Protein Ingredients Market Volume Share (%), by Country 2024 & 2032
- Figure 11: Asia Pacific APAC Plant Protein Ingredients Market Revenue (Million), by Country 2024 & 2032
- Figure 12: Asia Pacific APAC Plant Protein Ingredients Market Volume (K Tons), by Country 2024 & 2032
- Figure 13: Asia Pacific APAC Plant Protein Ingredients Market Revenue Share (%), by Country 2024 & 2032
- Figure 14: Asia Pacific APAC Plant Protein Ingredients Market Volume Share (%), by Country 2024 & 2032
- Figure 15: South America APAC Plant Protein Ingredients Market Revenue (Million), by Country 2024 & 2032
- Figure 16: South America APAC Plant Protein Ingredients Market Volume (K Tons), by Country 2024 & 2032
- Figure 17: South America APAC Plant Protein Ingredients Market Revenue Share (%), by Country 2024 & 2032
- Figure 18: South America APAC Plant Protein Ingredients Market Volume Share (%), by Country 2024 & 2032
- Figure 19: Middle East APAC Plant Protein Ingredients Market Revenue (Million), by Country 2024 & 2032
- Figure 20: Middle East APAC Plant Protein Ingredients Market Volume (K Tons), by Country 2024 & 2032
- Figure 21: Middle East APAC Plant Protein Ingredients Market Revenue Share (%), by Country 2024 & 2032
- Figure 22: Middle East APAC Plant Protein Ingredients Market Volume Share (%), by Country 2024 & 2032
- Figure 23: United Arab Emirates APAC Plant Protein Ingredients Market Revenue (Million), by Country 2024 & 2032
- Figure 24: United Arab Emirates APAC Plant Protein Ingredients Market Volume (K Tons), by Country 2024 & 2032
- Figure 25: United Arab Emirates APAC Plant Protein Ingredients Market Revenue Share (%), by Country 2024 & 2032
- Figure 26: United Arab Emirates APAC Plant Protein Ingredients Market Volume Share (%), by Country 2024 & 2032
- Figure 27: North America APAC Plant Protein Ingredients Market Revenue (Million), by Protein Type 2024 & 2032
- Figure 28: North America APAC Plant Protein Ingredients Market Volume (K Tons), by Protein Type 2024 & 2032
- Figure 29: North America APAC Plant Protein Ingredients Market Revenue Share (%), by Protein Type 2024 & 2032
- Figure 30: North America APAC Plant Protein Ingredients Market Volume Share (%), by Protein Type 2024 & 2032
- Figure 31: North America APAC Plant Protein Ingredients Market Revenue (Million), by End User 2024 & 2032
- Figure 32: North America APAC Plant Protein Ingredients Market Volume (K Tons), by End User 2024 & 2032
- Figure 33: North America APAC Plant Protein Ingredients Market Revenue Share (%), by End User 2024 & 2032
- Figure 34: North America APAC Plant Protein Ingredients Market Volume Share (%), by End User 2024 & 2032
- Figure 35: North America APAC Plant Protein Ingredients Market Revenue (Million), by Country 2024 & 2032
- Figure 36: North America APAC Plant Protein Ingredients Market Volume (K Tons), by Country 2024 & 2032
- Figure 37: North America APAC Plant Protein Ingredients Market Revenue Share (%), by Country 2024 & 2032
- Figure 38: North America APAC Plant Protein Ingredients Market Volume Share (%), by Country 2024 & 2032
- Figure 39: South America APAC Plant Protein Ingredients Market Revenue (Million), by Protein Type 2024 & 2032
- Figure 40: South America APAC Plant Protein Ingredients Market Volume (K Tons), by Protein Type 2024 & 2032
- Figure 41: South America APAC Plant Protein Ingredients Market Revenue Share (%), by Protein Type 2024 & 2032
- Figure 42: South America APAC Plant Protein Ingredients Market Volume Share (%), by Protein Type 2024 & 2032
- Figure 43: South America APAC Plant Protein Ingredients Market Revenue (Million), by End User 2024 & 2032
- Figure 44: South America APAC Plant Protein Ingredients Market Volume (K Tons), by End User 2024 & 2032
- Figure 45: South America APAC Plant Protein Ingredients Market Revenue Share (%), by End User 2024 & 2032
- Figure 46: South America APAC Plant Protein Ingredients Market Volume Share (%), by End User 2024 & 2032
- Figure 47: South America APAC Plant Protein Ingredients Market Revenue (Million), by Country 2024 & 2032
- Figure 48: South America APAC Plant Protein Ingredients Market Volume (K Tons), by Country 2024 & 2032
- Figure 49: South America APAC Plant Protein Ingredients Market Revenue Share (%), by Country 2024 & 2032
- Figure 50: South America APAC Plant Protein Ingredients Market Volume Share (%), by Country 2024 & 2032
- Figure 51: Europe APAC Plant Protein Ingredients Market Revenue (Million), by Protein Type 2024 & 2032
- Figure 52: Europe APAC Plant Protein Ingredients Market Volume (K Tons), by Protein Type 2024 & 2032
- Figure 53: Europe APAC Plant Protein Ingredients Market Revenue Share (%), by Protein Type 2024 & 2032
- Figure 54: Europe APAC Plant Protein Ingredients Market Volume Share (%), by Protein Type 2024 & 2032
- Figure 55: Europe APAC Plant Protein Ingredients Market Revenue (Million), by End User 2024 & 2032
- Figure 56: Europe APAC Plant Protein Ingredients Market Volume (K Tons), by End User 2024 & 2032
- Figure 57: Europe APAC Plant Protein Ingredients Market Revenue Share (%), by End User 2024 & 2032
- Figure 58: Europe APAC Plant Protein Ingredients Market Volume Share (%), by End User 2024 & 2032
- Figure 59: Europe APAC Plant Protein Ingredients Market Revenue (Million), by Country 2024 & 2032
- Figure 60: Europe APAC Plant Protein Ingredients Market Volume (K Tons), by Country 2024 & 2032
- Figure 61: Europe APAC Plant Protein Ingredients Market Revenue Share (%), by Country 2024 & 2032
- Figure 62: Europe APAC Plant Protein Ingredients Market Volume Share (%), by Country 2024 & 2032
- Figure 63: Middle East & Africa APAC Plant Protein Ingredients Market Revenue (Million), by Protein Type 2024 & 2032
- Figure 64: Middle East & Africa APAC Plant Protein Ingredients Market Volume (K Tons), by Protein Type 2024 & 2032
- Figure 65: Middle East & Africa APAC Plant Protein Ingredients Market Revenue Share (%), by Protein Type 2024 & 2032
- Figure 66: Middle East & Africa APAC Plant Protein Ingredients Market Volume Share (%), by Protein Type 2024 & 2032
- Figure 67: Middle East & Africa APAC Plant Protein Ingredients Market Revenue (Million), by End User 2024 & 2032
- Figure 68: Middle East & Africa APAC Plant Protein Ingredients Market Volume (K Tons), by End User 2024 & 2032
- Figure 69: Middle East & Africa APAC Plant Protein Ingredients Market Revenue Share (%), by End User 2024 & 2032
- Figure 70: Middle East & Africa APAC Plant Protein Ingredients Market Volume Share (%), by End User 2024 & 2032
- Figure 71: Middle East & Africa APAC Plant Protein Ingredients Market Revenue (Million), by Country 2024 & 2032
- Figure 72: Middle East & Africa APAC Plant Protein Ingredients Market Volume (K Tons), by Country 2024 & 2032
- Figure 73: Middle East & Africa APAC Plant Protein Ingredients Market Revenue Share (%), by Country 2024 & 2032
- Figure 74: Middle East & Africa APAC Plant Protein Ingredients Market Volume Share (%), by Country 2024 & 2032
- Figure 75: Asia Pacific APAC Plant Protein Ingredients Market Revenue (Million), by Protein Type 2024 & 2032
- Figure 76: Asia Pacific APAC Plant Protein Ingredients Market Volume (K Tons), by Protein Type 2024 & 2032
- Figure 77: Asia Pacific APAC Plant Protein Ingredients Market Revenue Share (%), by Protein Type 2024 & 2032
- Figure 78: Asia Pacific APAC Plant Protein Ingredients Market Volume Share (%), by Protein Type 2024 & 2032
- Figure 79: Asia Pacific APAC Plant Protein Ingredients Market Revenue (Million), by End User 2024 & 2032
- Figure 80: Asia Pacific APAC Plant Protein Ingredients Market Volume (K Tons), by End User 2024 & 2032
- Figure 81: Asia Pacific APAC Plant Protein Ingredients Market Revenue Share (%), by End User 2024 & 2032
- Figure 82: Asia Pacific APAC Plant Protein Ingredients Market Volume Share (%), by End User 2024 & 2032
- Figure 83: Asia Pacific APAC Plant Protein Ingredients Market Revenue (Million), by Country 2024 & 2032
- Figure 84: Asia Pacific APAC Plant Protein Ingredients Market Volume (K Tons), by Country 2024 & 2032
- Figure 85: Asia Pacific APAC Plant Protein Ingredients Market Revenue Share (%), by Country 2024 & 2032
- Figure 86: Asia Pacific APAC Plant Protein Ingredients Market Volume Share (%), by Country 2024 & 2032
List of Tables
- Table 1: Global APAC Plant Protein Ingredients Market Revenue Million Forecast, by Region 2019 & 2032
- Table 2: Global APAC Plant Protein Ingredients Market Volume K Tons Forecast, by Region 2019 & 2032
- Table 3: Global APAC Plant Protein Ingredients Market Revenue Million Forecast, by Protein Type 2019 & 2032
- Table 4: Global APAC Plant Protein Ingredients Market Volume K Tons Forecast, by Protein Type 2019 & 2032
- Table 5: Global APAC Plant Protein Ingredients Market Revenue Million Forecast, by End User 2019 & 2032
- Table 6: Global APAC Plant Protein Ingredients Market Volume K Tons Forecast, by End User 2019 & 2032
- Table 7: Global APAC Plant Protein Ingredients Market Revenue Million Forecast, by Region 2019 & 2032
- Table 8: Global APAC Plant Protein Ingredients Market Volume K Tons Forecast, by Region 2019 & 2032
- Table 9: Global APAC Plant Protein Ingredients Market Revenue Million Forecast, by Country 2019 & 2032
- Table 10: Global APAC Plant Protein Ingredients Market Volume K Tons Forecast, by Country 2019 & 2032
- Table 11: United States APAC Plant Protein Ingredients Market Revenue (Million) Forecast, by Application 2019 & 2032
- Table 12: United States APAC Plant Protein Ingredients Market Volume (K Tons) Forecast, by Application 2019 & 2032
- Table 13: Canada APAC Plant Protein Ingredients Market Revenue (Million) Forecast, by Application 2019 & 2032
- Table 14: Canada APAC Plant Protein Ingredients Market Volume (K Tons) Forecast, by Application 2019 & 2032
- Table 15: Mexico APAC Plant Protein Ingredients Market Revenue (Million) Forecast, by Application 2019 & 2032
- Table 16: Mexico APAC Plant Protein Ingredients Market Volume (K Tons) Forecast, by Application 2019 & 2032
- Table 17: Rest of North America APAC Plant Protein Ingredients Market Revenue (Million) Forecast, by Application 2019 & 2032
- Table 18: Rest of North America APAC Plant Protein Ingredients Market Volume (K Tons) Forecast, by Application 2019 & 2032
- Table 19: Global APAC Plant Protein Ingredients Market Revenue Million Forecast, by Country 2019 & 2032
- Table 20: Global APAC Plant Protein Ingredients Market Volume K Tons Forecast, by Country 2019 & 2032
- Table 21: Germany APAC Plant Protein Ingredients Market Revenue (Million) Forecast, by Application 2019 & 2032
- Table 22: Germany APAC Plant Protein Ingredients Market Volume (K Tons) Forecast, by Application 2019 & 2032
- Table 23: United Kingdom APAC Plant Protein Ingredients Market Revenue (Million) Forecast, by Application 2019 & 2032
- Table 24: United Kingdom APAC Plant Protein Ingredients Market Volume (K Tons) Forecast, by Application 2019 & 2032
- Table 25: France APAC Plant Protein Ingredients Market Revenue (Million) Forecast, by Application 2019 & 2032
- Table 26: France APAC Plant Protein Ingredients Market Volume (K Tons) Forecast, by Application 2019 & 2032
- Table 27: Russia APAC Plant Protein Ingredients Market Revenue (Million) Forecast, by Application 2019 & 2032
- Table 28: Russia APAC Plant Protein Ingredients Market Volume (K Tons) Forecast, by Application 2019 & 2032
- Table 29: Spain APAC Plant Protein Ingredients Market Revenue (Million) Forecast, by Application 2019 & 2032
- Table 30: Spain APAC Plant Protein Ingredients Market Volume (K Tons) Forecast, by Application 2019 & 2032
- Table 31: Rest of Europe APAC Plant Protein Ingredients Market Revenue (Million) Forecast, by Application 2019 & 2032
- Table 32: Rest of Europe APAC Plant Protein Ingredients Market Volume (K Tons) Forecast, by Application 2019 & 2032
- Table 33: Global APAC Plant Protein Ingredients Market Revenue Million Forecast, by Country 2019 & 2032
- Table 34: Global APAC Plant Protein Ingredients Market Volume K Tons Forecast, by Country 2019 & 2032
- Table 35: India APAC Plant Protein Ingredients Market Revenue (Million) Forecast, by Application 2019 & 2032
- Table 36: India APAC Plant Protein Ingredients Market Volume (K Tons) Forecast, by Application 2019 & 2032
- Table 37: China APAC Plant Protein Ingredients Market Revenue (Million) Forecast, by Application 2019 & 2032
- Table 38: China APAC Plant Protein Ingredients Market Volume (K Tons) Forecast, by Application 2019 & 2032
- Table 39: Japan APAC Plant Protein Ingredients Market Revenue (Million) Forecast, by Application 2019 & 2032
- Table 40: Japan APAC Plant Protein Ingredients Market Volume (K Tons) Forecast, by Application 2019 & 2032
- Table 41: Rest of Asia Pacific APAC Plant Protein Ingredients Market Revenue (Million) Forecast, by Application 2019 & 2032
- Table 42: Rest of Asia Pacific APAC Plant Protein Ingredients Market Volume (K Tons) Forecast, by Application 2019 & 2032
- Table 43: Global APAC Plant Protein Ingredients Market Revenue Million Forecast, by Country 2019 & 2032
- Table 44: Global APAC Plant Protein Ingredients Market Volume K Tons Forecast, by Country 2019 & 2032
- Table 45: Brazil APAC Plant Protein Ingredients Market Revenue (Million) Forecast, by Application 2019 & 2032
- Table 46: Brazil APAC Plant Protein Ingredients Market Volume (K Tons) Forecast, by Application 2019 & 2032
- Table 47: Argentina APAC Plant Protein Ingredients Market Revenue (Million) Forecast, by Application 2019 & 2032
- Table 48: Argentina APAC Plant Protein Ingredients Market Volume (K Tons) Forecast, by Application 2019 & 2032
- Table 49: Rest of South America APAC Plant Protein Ingredients Market Revenue (Million) Forecast, by Application 2019 & 2032
- Table 50: Rest of South America APAC Plant Protein Ingredients Market Volume (K Tons) Forecast, by Application 2019 & 2032
- Table 51: Global APAC Plant Protein Ingredients Market Revenue Million Forecast, by Country 2019 & 2032
- Table 52: Global APAC Plant Protein Ingredients Market Volume K Tons Forecast, by Country 2019 & 2032
- Table 53: Middle East APAC Plant Protein Ingredients Market Revenue (Million) Forecast, by Application 2019 & 2032
- Table 54: Middle East APAC Plant Protein Ingredients Market Volume (K Tons) Forecast, by Application 2019 & 2032
- Table 55: Africa APAC Plant Protein Ingredients Market Revenue (Million) Forecast, by Application 2019 & 2032
- Table 56: Africa APAC Plant Protein Ingredients Market Volume (K Tons) Forecast, by Application 2019 & 2032
- Table 57: Global APAC Plant Protein Ingredients Market Revenue Million Forecast, by Country 2019 & 2032
- Table 58: Global APAC Plant Protein Ingredients Market Volume K Tons Forecast, by Country 2019 & 2032
- Table 59: South Africa APAC Plant Protein Ingredients Market Revenue (Million) Forecast, by Application 2019 & 2032
- Table 60: South Africa APAC Plant Protein Ingredients Market Volume (K Tons) Forecast, by Application 2019 & 2032
- Table 61: Rest of Middle East APAC Plant Protein Ingredients Market Revenue (Million) Forecast, by Application 2019 & 2032
- Table 62: Rest of Middle East APAC Plant Protein Ingredients Market Volume (K Tons) Forecast, by Application 2019 & 2032
- Table 63: Global APAC Plant Protein Ingredients Market Revenue Million Forecast, by Protein Type 2019 & 2032
- Table 64: Global APAC Plant Protein Ingredients Market Volume K Tons Forecast, by Protein Type 2019 & 2032
- Table 65: Global APAC Plant Protein Ingredients Market Revenue Million Forecast, by End User 2019 & 2032
- Table 66: Global APAC Plant Protein Ingredients Market Volume K Tons Forecast, by End User 2019 & 2032
- Table 67: Global APAC Plant Protein Ingredients Market Revenue Million Forecast, by Country 2019 & 2032
- Table 68: Global APAC Plant Protein Ingredients Market Volume K Tons Forecast, by Country 2019 & 2032
- Table 69: United States APAC Plant Protein Ingredients Market Revenue (Million) Forecast, by Application 2019 & 2032
- Table 70: United States APAC Plant Protein Ingredients Market Volume (K Tons) Forecast, by Application 2019 & 2032
- Table 71: Canada APAC Plant Protein Ingredients Market Revenue (Million) Forecast, by Application 2019 & 2032
- Table 72: Canada APAC Plant Protein Ingredients Market Volume (K Tons) Forecast, by Application 2019 & 2032
- Table 73: Mexico APAC Plant Protein Ingredients Market Revenue (Million) Forecast, by Application 2019 & 2032
- Table 74: Mexico APAC Plant Protein Ingredients Market Volume (K Tons) Forecast, by Application 2019 & 2032
- Table 75: Global APAC Plant Protein Ingredients Market Revenue Million Forecast, by Protein Type 2019 & 2032
- Table 76: Global APAC Plant Protein Ingredients Market Volume K Tons Forecast, by Protein Type 2019 & 2032
- Table 77: Global APAC Plant Protein Ingredients Market Revenue Million Forecast, by End User 2019 & 2032
- Table 78: Global APAC Plant Protein Ingredients Market Volume K Tons Forecast, by End User 2019 & 2032
- Table 79: Global APAC Plant Protein Ingredients Market Revenue Million Forecast, by Country 2019 & 2032
- Table 80: Global APAC Plant Protein Ingredients Market Volume K Tons Forecast, by Country 2019 & 2032
- Table 81: Brazil APAC Plant Protein Ingredients Market Revenue (Million) Forecast, by Application 2019 & 2032
- Table 82: Brazil APAC Plant Protein Ingredients Market Volume (K Tons) Forecast, by Application 2019 & 2032
- Table 83: Argentina APAC Plant Protein Ingredients Market Revenue (Million) Forecast, by Application 2019 & 2032
- Table 84: Argentina APAC Plant Protein Ingredients Market Volume (K Tons) Forecast, by Application 2019 & 2032
- Table 85: Rest of South America APAC Plant Protein Ingredients Market Revenue (Million) Forecast, by Application 2019 & 2032
- Table 86: Rest of South America APAC Plant Protein Ingredients Market Volume (K Tons) Forecast, by Application 2019 & 2032
- Table 87: Global APAC Plant Protein Ingredients Market Revenue Million Forecast, by Protein Type 2019 & 2032
- Table 88: Global APAC Plant Protein Ingredients Market Volume K Tons Forecast, by Protein Type 2019 & 2032
- Table 89: Global APAC Plant Protein Ingredients Market Revenue Million Forecast, by End User 2019 & 2032
- Table 90: Global APAC Plant Protein Ingredients Market Volume K Tons Forecast, by End User 2019 & 2032
- Table 91: Global APAC Plant Protein Ingredients Market Revenue Million Forecast, by Country 2019 & 2032
- Table 92: Global APAC Plant Protein Ingredients Market Volume K Tons Forecast, by Country 2019 & 2032
- Table 93: United Kingdom APAC Plant Protein Ingredients Market Revenue (Million) Forecast, by Application 2019 & 2032
- Table 94: United Kingdom APAC Plant Protein Ingredients Market Volume (K Tons) Forecast, by Application 2019 & 2032
- Table 95: Germany APAC Plant Protein Ingredients Market Revenue (Million) Forecast, by Application 2019 & 2032
- Table 96: Germany APAC Plant Protein Ingredients Market Volume (K Tons) Forecast, by Application 2019 & 2032
- Table 97: France APAC Plant Protein Ingredients Market Revenue (Million) Forecast, by Application 2019 & 2032
- Table 98: France APAC Plant Protein Ingredients Market Volume (K Tons) Forecast, by Application 2019 & 2032
- Table 99: Italy APAC Plant Protein Ingredients Market Revenue (Million) Forecast, by Application 2019 & 2032
- Table 100: Italy APAC Plant Protein Ingredients Market Volume (K Tons) Forecast, by Application 2019 & 2032
- Table 101: Spain APAC Plant Protein Ingredients Market Revenue (Million) Forecast, by Application 2019 & 2032
- Table 102: Spain APAC Plant Protein Ingredients Market Volume (K Tons) Forecast, by Application 2019 & 2032
- Table 103: Russia APAC Plant Protein Ingredients Market Revenue (Million) Forecast, by Application 2019 & 2032
- Table 104: Russia APAC Plant Protein Ingredients Market Volume (K Tons) Forecast, by Application 2019 & 2032
- Table 105: Benelux APAC Plant Protein Ingredients Market Revenue (Million) Forecast, by Application 2019 & 2032
- Table 106: Benelux APAC Plant Protein Ingredients Market Volume (K Tons) Forecast, by Application 2019 & 2032
- Table 107: Nordics APAC Plant Protein Ingredients Market Revenue (Million) Forecast, by Application 2019 & 2032
- Table 108: Nordics APAC Plant Protein Ingredients Market Volume (K Tons) Forecast, by Application 2019 & 2032
- Table 109: Rest of Europe APAC Plant Protein Ingredients Market Revenue (Million) Forecast, by Application 2019 & 2032
- Table 110: Rest of Europe APAC Plant Protein Ingredients Market Volume (K Tons) Forecast, by Application 2019 & 2032
- Table 111: Global APAC Plant Protein Ingredients Market Revenue Million Forecast, by Protein Type 2019 & 2032
- Table 112: Global APAC Plant Protein Ingredients Market Volume K Tons Forecast, by Protein Type 2019 & 2032
- Table 113: Global APAC Plant Protein Ingredients Market Revenue Million Forecast, by End User 2019 & 2032
- Table 114: Global APAC Plant Protein Ingredients Market Volume K Tons Forecast, by End User 2019 & 2032
- Table 115: Global APAC Plant Protein Ingredients Market Revenue Million Forecast, by Country 2019 & 2032
- Table 116: Global APAC Plant Protein Ingredients Market Volume K Tons Forecast, by Country 2019 & 2032
- Table 117: Turkey APAC Plant Protein Ingredients Market Revenue (Million) Forecast, by Application 2019 & 2032
- Table 118: Turkey APAC Plant Protein Ingredients Market Volume (K Tons) Forecast, by Application 2019 & 2032
- Table 119: Israel APAC Plant Protein Ingredients Market Revenue (Million) Forecast, by Application 2019 & 2032
- Table 120: Israel APAC Plant Protein Ingredients Market Volume (K Tons) Forecast, by Application 2019 & 2032
- Table 121: GCC APAC Plant Protein Ingredients Market Revenue (Million) Forecast, by Application 2019 & 2032
- Table 122: GCC APAC Plant Protein Ingredients Market Volume (K Tons) Forecast, by Application 2019 & 2032
- Table 123: North Africa APAC Plant Protein Ingredients Market Revenue (Million) Forecast, by Application 2019 & 2032
- Table 124: North Africa APAC Plant Protein Ingredients Market Volume (K Tons) Forecast, by Application 2019 & 2032
- Table 125: South Africa APAC Plant Protein Ingredients Market Revenue (Million) Forecast, by Application 2019 & 2032
- Table 126: South Africa APAC Plant Protein Ingredients Market Volume (K Tons) Forecast, by Application 2019 & 2032
- Table 127: Rest of Middle East & Africa APAC Plant Protein Ingredients Market Revenue (Million) Forecast, by Application 2019 & 2032
- Table 128: Rest of Middle East & Africa APAC Plant Protein Ingredients Market Volume (K Tons) Forecast, by Application 2019 & 2032
- Table 129: Global APAC Plant Protein Ingredients Market Revenue Million Forecast, by Protein Type 2019 & 2032
- Table 130: Global APAC Plant Protein Ingredients Market Volume K Tons Forecast, by Protein Type 2019 & 2032
- Table 131: Global APAC Plant Protein Ingredients Market Revenue Million Forecast, by End User 2019 & 2032
- Table 132: Global APAC Plant Protein Ingredients Market Volume K Tons Forecast, by End User 2019 & 2032
- Table 133: Global APAC Plant Protein Ingredients Market Revenue Million Forecast, by Country 2019 & 2032
- Table 134: Global APAC Plant Protein Ingredients Market Volume K Tons Forecast, by Country 2019 & 2032
- Table 135: China APAC Plant Protein Ingredients Market Revenue (Million) Forecast, by Application 2019 & 2032
- Table 136: China APAC Plant Protein Ingredients Market Volume (K Tons) Forecast, by Application 2019 & 2032
- Table 137: India APAC Plant Protein Ingredients Market Revenue (Million) Forecast, by Application 2019 & 2032
- Table 138: India APAC Plant Protein Ingredients Market Volume (K Tons) Forecast, by Application 2019 & 2032
- Table 139: Japan APAC Plant Protein Ingredients Market Revenue (Million) Forecast, by Application 2019 & 2032
- Table 140: Japan APAC Plant Protein Ingredients Market Volume (K Tons) Forecast, by Application 2019 & 2032
- Table 141: South Korea APAC Plant Protein Ingredients Market Revenue (Million) Forecast, by Application 2019 & 2032
- Table 142: South Korea APAC Plant Protein Ingredients Market Volume (K Tons) Forecast, by Application 2019 & 2032
- Table 143: ASEAN APAC Plant Protein Ingredients Market Revenue (Million) Forecast, by Application 2019 & 2032
- Table 144: ASEAN APAC Plant Protein Ingredients Market Volume (K Tons) Forecast, by Application 2019 & 2032
- Table 145: Oceania APAC Plant Protein Ingredients Market Revenue (Million) Forecast, by Application 2019 & 2032
- Table 146: Oceania APAC Plant Protein Ingredients Market Volume (K Tons) Forecast, by Application 2019 & 2032
- Table 147: Rest of Asia Pacific APAC Plant Protein Ingredients Market Revenue (Million) Forecast, by Application 2019 & 2032
- Table 148: Rest of Asia Pacific APAC Plant Protein Ingredients Market Volume (K Tons) Forecast, by Application 2019 & 2032
Frequently Asked Questions
1. What is the projected Compound Annual Growth Rate (CAGR) of the APAC Plant Protein Ingredients Market?
The projected CAGR is approximately 2.67%.
2. Which companies are prominent players in the APAC Plant Protein Ingredients Market?
Key companies in the market include CHS Inc, Nippn Corporation, Shandong Jianyuan Bioengineering Co Ltd, International Flavors & Fragrances Inc, Tereos SCA, Wilmar International Lt, Archer Daniels Midland Company, Bunge Limited, Fuji Oil Group, Nagata Group, Kerry Group PLC, Südzucker AG.
3. What are the main segments of the APAC Plant Protein Ingredients Market?
The market segments include Protein Type, End User.
4. Can you provide details about the market size?
The market size is estimated to be USD XX Million as of 2022.
5. What are some drivers contributing to market growth?
Increasing Demand for Organic Plant Proteins; Increasing Application of Pea Protein in Food and Beverages.
6. What are the notable trends driving market growth?
OTHER KEY INDUSTRY TRENDS COVERED IN THE REPORT.
7. Are there any restraints impacting market growth?
Presence of Alternative protein sources.
8. Can you provide examples of recent developments in the market?
May 2022: BENEO, a subsidiary of Südzucker, entered a purchase agreement to acquire Meatless BV, a producer of functional ingredients. BENEO is expanding its existing product offering with the acquisition to offer an even broader range of texturizing solutions for meat and fish alternatives.April 2021: ADM opened a new, cutting-edge plant-based innovation lab located in ADM’s Biopolis research hub in Singapore. The lab develops advanced products and customized solutions to meet the growing food and beverage demand in the Asia-Pacific region. The ADM Biopolis research hub in Singapore features a wide range of capabilities, including a food and flavor analytic lab, beverage and dairy applications lab and pilot plant, bakery and confectionery lab, meat and savory lab, sweet and savory creation lab, sensory evaluation facilities, customer innovation center, and a new plant-based innovation lab.April 2021: Bunge Limited has invested USD 45.7 million in Australian Plant Proteins (APP) to double the production of plant protein isolates in the country by March 2022. The ingredients manufactured by APP include fava bean isolate powder, yellow lentil isolate powder, and red lentil isolate powder.
9. What pricing options are available for accessing the report?
Pricing options include single-user, multi-user, and enterprise licenses priced at USD 3800, USD 4500, and USD 5800 respectively.
10. Is the market size provided in terms of value or volume?
The market size is provided in terms of value, measured in Million and volume, measured in K Tons.
11. Are there any specific market keywords associated with the report?
Yes, the market keyword associated with the report is "APAC Plant Protein Ingredients Market," which aids in identifying and referencing the specific market segment covered.
12. How do I determine which pricing option suits my needs best?
The pricing options vary based on user requirements and access needs. Individual users may opt for single-user licenses, while businesses requiring broader access may choose multi-user or enterprise licenses for cost-effective access to the report.
13. Are there any additional resources or data provided in the APAC Plant Protein Ingredients Market report?
While the report offers comprehensive insights, it's advisable to review the specific contents or supplementary materials provided to ascertain if additional resources or data are available.
14. How can I stay updated on further developments or reports in the APAC Plant Protein Ingredients Market?
To stay informed about further developments, trends, and reports in the APAC Plant Protein Ingredients Market, consider subscribing to industry newsletters, following relevant companies and organizations, or regularly checking reputable industry news sources and publications.
Methodology
Step 1 - Identification of Relevant Samples Size from Population Database


Step 2 - Approaches for Defining Global Market Size (Value, Volume* & Price*)

Note*: In applicable scenarios
Step 3 - Data Sources
Primary Research
- Web Analytics
- Survey Reports
- Research Institute
- Latest Research Reports
- Opinion Leaders
Secondary Research
- Annual Reports
- White Paper
- Latest Press Release
- Industry Association
- Paid Database
- Investor Presentations

Step 4 - Data Triangulation
Involves using different sources of information in order to increase the validity of a study
These sources are likely to be stakeholders in a program - participants, other researchers, program staff, other community members, and so on.
Then we put all data in single framework & apply various statistical tools to find out the dynamic on the market.
During the analysis stage, feedback from the stakeholder groups would be compared to determine areas of agreement as well as areas of divergence
