

Key Insights
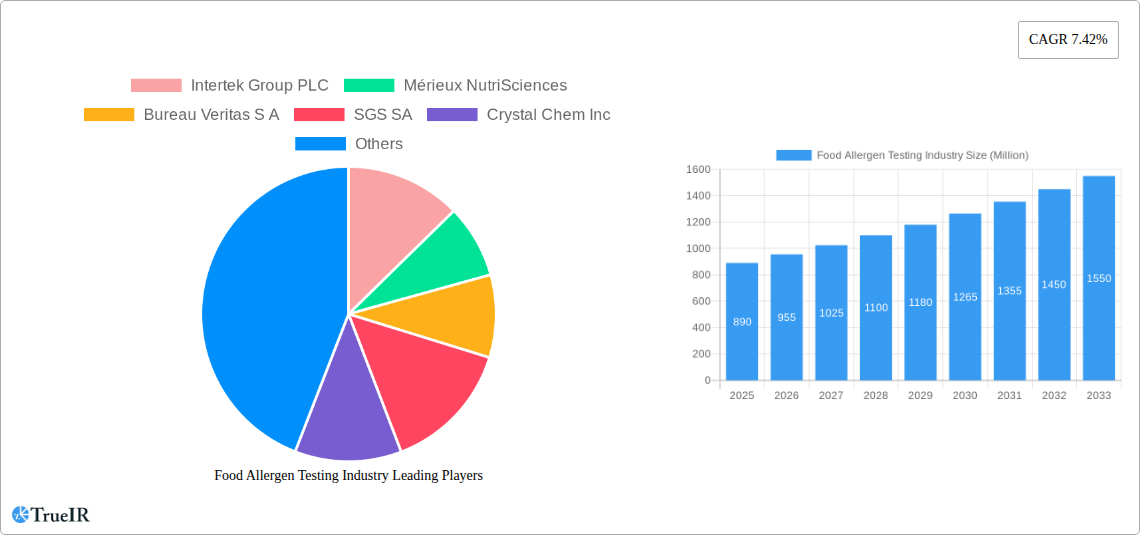
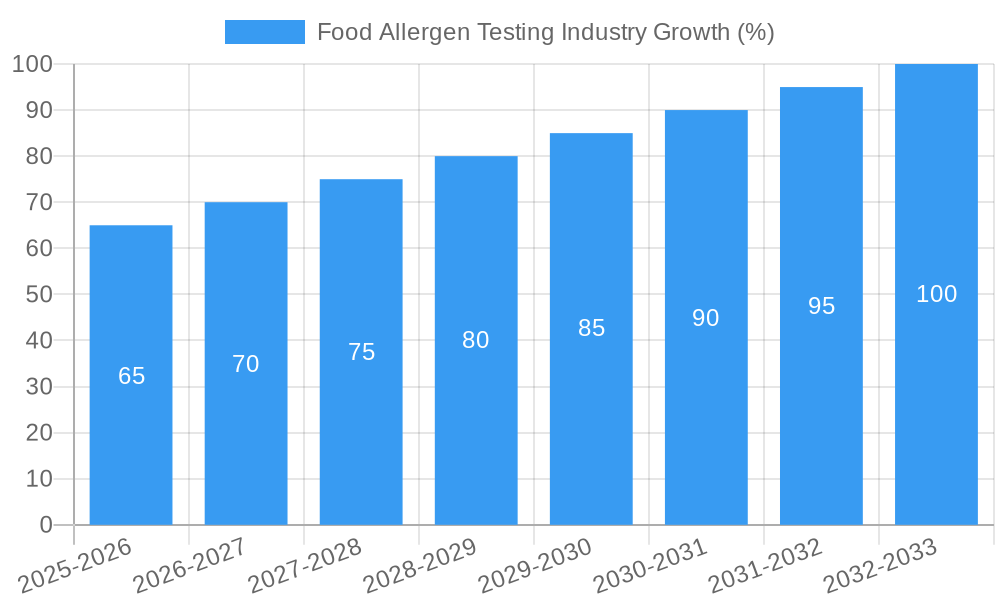
The global food allergen testing market, valued at $0.89 billion in 2025, is projected to experience robust growth, driven by increasing consumer awareness of food allergies, stringent government regulations mandating allergen labeling, and the rising prevalence of food allergies worldwide. The market's Compound Annual Growth Rate (CAGR) of 7.42% from 2019 to 2024 indicates a significant upward trajectory, expected to continue through 2033. Key drivers include the expanding food processing industry, the growing demand for safe and reliable food products, and advancements in testing technologies like ELISA and PCR, offering faster and more accurate results. The market is segmented by application (seafood and meat, dairy, beverages, bakery, baby food, and others) and technology (immunoassay, PCR, and others). The increasing demand for allergen testing across various food categories, particularly in baby food and infant formula due to heightened safety concerns, is a significant growth catalyst. Geographical expansion, particularly in rapidly developing economies in Asia-Pacific and South America, further fuels market expansion. However, the high cost of advanced testing technologies and the need for skilled personnel could act as potential restraints. Major players such as Intertek, Mérieux NutriSciences, Bureau Veritas, SGS, and Neogen Corporation are shaping the market through technological innovations, strategic partnerships, and global expansions.
The competitive landscape is characterized by the presence of both large multinational companies and smaller specialized laboratories. These companies are constantly striving to improve the accuracy, speed, and affordability of allergen testing. Technological advancements focus on developing rapid, point-of-care testing solutions and integrating advanced data analytics for better allergen management. Future growth will be influenced by the evolving regulatory landscape, consumer preferences for transparency and traceability in food supply chains, and the continuous innovation in allergen detection methodologies. The market's robust growth outlook stems from a confluence of factors, pointing towards a significant expansion in the coming years. This growth is expected to be fueled by the increasingly stringent regulations on food labeling and the growing consumer demand for allergen-free products.
Food Allergen Testing Industry Market Report: 2019-2033
This comprehensive report provides an in-depth analysis of the global Food Allergen Testing industry, covering the period from 2019 to 2033. The report offers a detailed examination of market size, growth drivers, challenges, key players, and future outlook, providing valuable insights for industry stakeholders, investors, and researchers. The global market is projected to reach xx Million by 2033, exhibiting a CAGR of xx% during the forecast period (2025-2033).
Food Allergen Testing Industry Market Structure & Competitive Landscape
The food allergen testing market is moderately concentrated, with several major players dominating the landscape. The Herfindahl-Hirschman Index (HHI) is estimated to be xx in 2025, indicating a moderately competitive environment. Innovation is a key driver, with companies continually developing advanced technologies like PCR-based tests and immunoassay-based ELISA to improve accuracy and speed. Stringent regulatory frameworks, such as those enforced by the FDA and EFSA, significantly impact market dynamics, driving demand for compliant testing services. Product substitutes are limited, as accurate allergen detection is crucial for food safety.
End-user segmentation includes food manufacturers (Seafood and Meat Products, Dairy Products, Beverages, Bakery and Confectionery, Baby Food and Infant Formula, and Other Applications), and testing laboratories. Mergers and acquisitions (M&A) activity is significant, with a total M&A volume of approximately xx Million in the past five years. Key examples include ALS Limited's acquisition of York Analytical Laboratories and Wessling Holding GmbH & Co. This consolidation trend is likely to continue, driven by the desire for expansion and technological enhancement.
- Market Concentration: Moderately concentrated, HHI of xx in 2025.
- Innovation Drivers: Advancements in PCR and ELISA technologies.
- Regulatory Impacts: Stringent FDA and EFSA regulations drive demand.
- Product Substitutes: Limited alternatives for accurate allergen detection.
- End-User Segmentation: Food manufacturers and testing laboratories.
- M&A Trends: Significant activity, driven by expansion and technology acquisition.
Food Allergen Testing Industry Market Trends & Opportunities
The global food allergen testing market is experiencing robust growth, fueled by increasing consumer awareness of food allergies, stricter regulatory requirements for food labeling accuracy, and the rising prevalence of food allergies globally. The market size reached xx Million in 2024 and is projected to expand significantly over the forecast period, driven by a CAGR of xx%. This growth is further propelled by technological advancements like the introduction of faster, more sensitive testing methods and increased adoption of sophisticated testing techniques in developing economies. The market penetration rate for advanced technologies like PCR is steadily increasing, as is the demand for services capable of detecting a wider range of allergens. The competitive landscape is characterized by both intense competition among established players and the emergence of new entrants offering innovative solutions. The overall trend shows a move towards more comprehensive and efficient allergen testing, meeting the evolving needs of consumers and regulatory bodies.
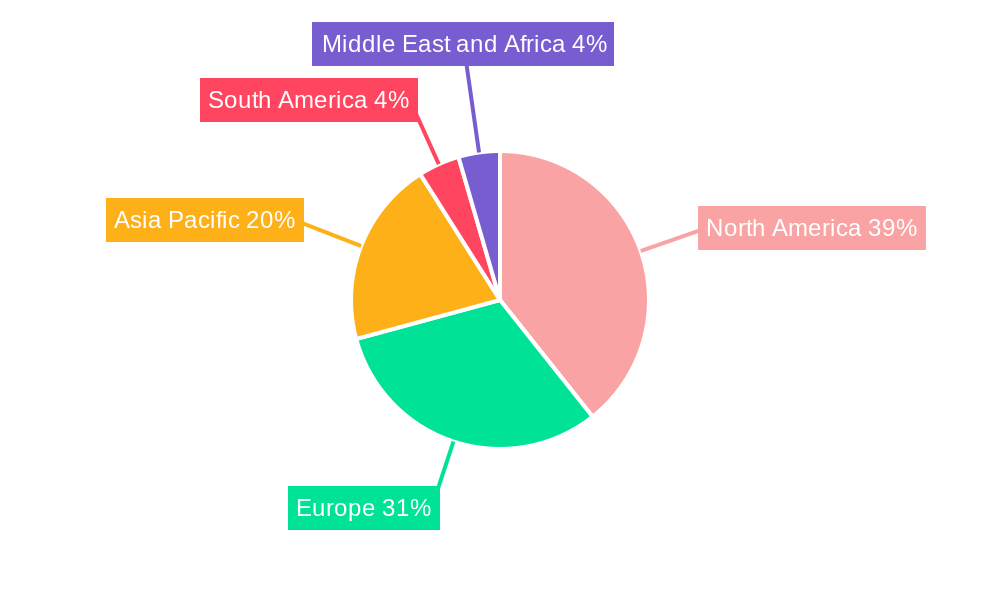
Dominant Markets & Segments in Food Allergen Testing Industry
The North American region currently holds the largest market share in the food allergen testing industry, followed by Europe. Within application segments, Baby Food and Infant Formula demonstrates the highest growth rate due to stringent regulations and the inherent sensitivity of this product category to allergen contamination. The Immunoassay-based/ELISA technology segment dominates due to its cost-effectiveness and established presence in the market, though PCR-based testing is gaining traction due to its superior sensitivity and specificity.
- Leading Region: North America
- Fastest-Growing Segment (Application): Baby Food and Infant Formula
- Dominant Technology: Immunoassay-based /ELISA
- Key Growth Drivers:
- Stringent Regulations: Enforced by agencies like the FDA and EFSA.
- Rising Consumer Awareness: Of food allergies and related health risks.
- Technological Advancements: Higher sensitivity and specificity of new tests.
- Increasing Prevalence of Food Allergies: Globally driving demand.
Food Allergen Testing Industry Product Analysis
Recent innovations in food allergen testing focus on enhancing sensitivity, speed, and cost-effectiveness. Products like the SENSIStrip Gluten PowerLine Lateral Flow Device exemplify this trend, providing rapid and accurate detection of gluten residues. The competitive advantage often lies in the speed and accuracy of testing, as well as the ability to detect a wider range of allergens with a single test. The market is evolving towards integrated solutions that streamline the testing process and provide comprehensive data for food manufacturers.
Key Drivers, Barriers & Challenges in Food Allergen Testing Industry
Key Drivers:
- Increased consumer awareness of food allergies.
- Stringent government regulations regarding food safety and labeling.
- Technological advancements leading to faster and more accurate testing methods.
- Growing demand for allergen-free products, particularly in the baby food sector.
Key Challenges:
- High cost of advanced testing technologies, particularly PCR-based methods.
- Complex regulatory landscape varying across different regions.
- Supply chain disruptions affecting the availability of reagents and consumables.
- Intense competition among established players and the entry of new market participants.
Growth Drivers in the Food Allergen Testing Industry Market
The market is driven by increasing consumer awareness of food allergies, stricter regulations demanding accurate allergen labeling, and technological advancements making testing more efficient and accurate. Government initiatives promoting food safety and improved testing infrastructure in developing countries also contribute to growth.
Challenges Impacting Food Allergen Testing Industry Growth
Challenges include the high cost of advanced technologies, complex and often varying regulatory landscapes across jurisdictions, potential supply chain vulnerabilities affecting reagent availability, and intense competition among market participants.
Key Players Shaping the Food Allergen Testing Industry Market
- Intertek Group PLC
- Mérieux NutriSciences
- Bureau Veritas S A
- SGS SA
- Crystal Chem Inc
- Lifeasible
- ALS Limited
- Microbac Laboratories Inc
- Eurofins Scientific SE
- Neogen Corporation
Significant Food Allergen Testing Industry Milestones
- March 2024: Gold Standard Diagnostics launched the SENSIStrip Gluten PowerLine Lateral Flow Device, a sensitive gluten detection system.
- March 2024: ALS Limited expanded its Life Sciences presence through acquisitions in the US and Europe.
- February 2024: Mérieux NutriSciences opened a new food analysis laboratory in Maringá, Brazil.
Future Outlook for Food Allergen Testing Industry Market
The food allergen testing market is poised for continued growth, driven by innovation, regulatory pressures, and increasing consumer demand. Strategic opportunities lie in developing more sensitive and cost-effective testing technologies, expanding into emerging markets, and offering comprehensive, integrated testing solutions. The market potential is substantial, with significant growth expected across various segments and regions in the coming years.
Food Allergen Testing Industry Segmentation
-
1. Technology
- 1.1. Immunoassay-based /ELISA
- 1.2. PCR (Polymerase Chain Reaction)-based
- 1.3. Other Technologies
-
2. Application
- 2.1. Seafood and Meat Products
- 2.2. Dairy Products
- 2.3. Beverages
- 2.4. Bakery and Confectionery
- 2.5. Baby Food and Infant Formula
- 2.6. Other Applications
Food Allergen Testing Industry Segmentation By Geography
-
1. North America
- 1.1. United States
- 1.2. Canada
- 1.3. Mexico
- 1.4. Rest of North America
-
2. Europe
- 2.1. Germany
- 2.2. United Kingdom
- 2.3. France
- 2.4. Russia
- 2.5. Spain
- 2.6. Italy
- 2.7. Rest of Europe
-
3. Asia Pacific
- 3.1. India
- 3.2. China
- 3.3. Japan
- 3.4. Australia
- 3.5. Rest of Asia Pacific
-
4. South America
- 4.1. Brazil
- 4.2. Argentina
- 4.3. Rest of South America
-
5. Middle East and Africa
- 5.1. South Africa
- 5.2. Saudi Arabia
- 5.3. Rest of Middle East and Africa
Food Allergen Testing Industry REPORT HIGHLIGHTS
| Aspects | Details |
|---|---|
| Study Period | 2019-2033 |
| Base Year | 2024 |
| Estimated Year | 2025 |
| Forecast Period | 2025-2033 |
| Historical Period | 2019-2024 |
| Growth Rate | CAGR of 7.42% from 2019-2033 |
| Segmentation |
|
Table of Contents
- 1. Introduction
- 1.1. Research Scope
- 1.2. Market Segmentation
- 1.3. Research Methodology
- 1.4. Definitions and Assumptions
- 2. Executive Summary
- 2.1. Introduction
- 3. Market Dynamics
- 3.1. Introduction
- 3.2. Market Drivers
- 3.2.1. Increasing Incidences of Food Allergies; Favorable Government Initiatives and Regulations for Food Safety
- 3.3. Market Restrains
- 3.3.1. Inconsistencies Involved in Food Allergen Declarations
- 3.4. Market Trends
- 3.4.1. Increasing Prevalence of Food Allergies
- 4. Market Factor Analysis
- 4.1. Porters Five Forces
- 4.2. Supply/Value Chain
- 4.3. PESTEL analysis
- 4.4. Market Entropy
- 4.5. Patent/Trademark Analysis
- 5. Global Food Allergen Testing Industry Analysis, Insights and Forecast, 2019-2031
- 5.1. Market Analysis, Insights and Forecast - by Technology
- 5.1.1. Immunoassay-based /ELISA
- 5.1.2. PCR (Polymerase Chain Reaction)-based
- 5.1.3. Other Technologies
- 5.2. Market Analysis, Insights and Forecast - by Application
- 5.2.1. Seafood and Meat Products
- 5.2.2. Dairy Products
- 5.2.3. Beverages
- 5.2.4. Bakery and Confectionery
- 5.2.5. Baby Food and Infant Formula
- 5.2.6. Other Applications
- 5.3. Market Analysis, Insights and Forecast - by Region
- 5.3.1. North America
- 5.3.2. Europe
- 5.3.3. Asia Pacific
- 5.3.4. South America
- 5.3.5. Middle East and Africa
- 5.1. Market Analysis, Insights and Forecast - by Technology
- 6. North America Food Allergen Testing Industry Analysis, Insights and Forecast, 2019-2031
- 6.1. Market Analysis, Insights and Forecast - by Technology
- 6.1.1. Immunoassay-based /ELISA
- 6.1.2. PCR (Polymerase Chain Reaction)-based
- 6.1.3. Other Technologies
- 6.2. Market Analysis, Insights and Forecast - by Application
- 6.2.1. Seafood and Meat Products
- 6.2.2. Dairy Products
- 6.2.3. Beverages
- 6.2.4. Bakery and Confectionery
- 6.2.5. Baby Food and Infant Formula
- 6.2.6. Other Applications
- 6.1. Market Analysis, Insights and Forecast - by Technology
- 7. Europe Food Allergen Testing Industry Analysis, Insights and Forecast, 2019-2031
- 7.1. Market Analysis, Insights and Forecast - by Technology
- 7.1.1. Immunoassay-based /ELISA
- 7.1.2. PCR (Polymerase Chain Reaction)-based
- 7.1.3. Other Technologies
- 7.2. Market Analysis, Insights and Forecast - by Application
- 7.2.1. Seafood and Meat Products
- 7.2.2. Dairy Products
- 7.2.3. Beverages
- 7.2.4. Bakery and Confectionery
- 7.2.5. Baby Food and Infant Formula
- 7.2.6. Other Applications
- 7.1. Market Analysis, Insights and Forecast - by Technology
- 8. Asia Pacific Food Allergen Testing Industry Analysis, Insights and Forecast, 2019-2031
- 8.1. Market Analysis, Insights and Forecast - by Technology
- 8.1.1. Immunoassay-based /ELISA
- 8.1.2. PCR (Polymerase Chain Reaction)-based
- 8.1.3. Other Technologies
- 8.2. Market Analysis, Insights and Forecast - by Application
- 8.2.1. Seafood and Meat Products
- 8.2.2. Dairy Products
- 8.2.3. Beverages
- 8.2.4. Bakery and Confectionery
- 8.2.5. Baby Food and Infant Formula
- 8.2.6. Other Applications
- 8.1. Market Analysis, Insights and Forecast - by Technology
- 9. South America Food Allergen Testing Industry Analysis, Insights and Forecast, 2019-2031
- 9.1. Market Analysis, Insights and Forecast - by Technology
- 9.1.1. Immunoassay-based /ELISA
- 9.1.2. PCR (Polymerase Chain Reaction)-based
- 9.1.3. Other Technologies
- 9.2. Market Analysis, Insights and Forecast - by Application
- 9.2.1. Seafood and Meat Products
- 9.2.2. Dairy Products
- 9.2.3. Beverages
- 9.2.4. Bakery and Confectionery
- 9.2.5. Baby Food and Infant Formula
- 9.2.6. Other Applications
- 9.1. Market Analysis, Insights and Forecast - by Technology
- 10. Middle East and Africa Food Allergen Testing Industry Analysis, Insights and Forecast, 2019-2031
- 10.1. Market Analysis, Insights and Forecast - by Technology
- 10.1.1. Immunoassay-based /ELISA
- 10.1.2. PCR (Polymerase Chain Reaction)-based
- 10.1.3. Other Technologies
- 10.2. Market Analysis, Insights and Forecast - by Application
- 10.2.1. Seafood and Meat Products
- 10.2.2. Dairy Products
- 10.2.3. Beverages
- 10.2.4. Bakery and Confectionery
- 10.2.5. Baby Food and Infant Formula
- 10.2.6. Other Applications
- 10.1. Market Analysis, Insights and Forecast - by Technology
- 11. North America Food Allergen Testing Industry Analysis, Insights and Forecast, 2019-2031
- 11.1. Market Analysis, Insights and Forecast - By Country/Sub-region
- 11.1.1 United States
- 11.1.2 Canada
- 11.1.3 Mexico
- 11.1.4 Rest of North America
- 12. Europe Food Allergen Testing Industry Analysis, Insights and Forecast, 2019-2031
- 12.1. Market Analysis, Insights and Forecast - By Country/Sub-region
- 12.1.1 Germany
- 12.1.2 United Kingdom
- 12.1.3 France
- 12.1.4 Russia
- 12.1.5 Spain
- 12.1.6 Italy
- 12.1.7 Rest of Europe
- 13. Asia Pacific Food Allergen Testing Industry Analysis, Insights and Forecast, 2019-2031
- 13.1. Market Analysis, Insights and Forecast - By Country/Sub-region
- 13.1.1 India
- 13.1.2 China
- 13.1.3 Japan
- 13.1.4 Australia
- 13.1.5 Rest of Asia Pacific
- 14. South America Food Allergen Testing Industry Analysis, Insights and Forecast, 2019-2031
- 14.1. Market Analysis, Insights and Forecast - By Country/Sub-region
- 14.1.1 Brazil
- 14.1.2 Argentina
- 14.1.3 Rest of South America
- 15. Middle East and Africa Food Allergen Testing Industry Analysis, Insights and Forecast, 2019-2031
- 15.1. Market Analysis, Insights and Forecast - By Country/Sub-region
- 15.1.1 South Africa
- 15.1.2 Saudi Arabia
- 15.1.3 Rest of Middle East and Africa
- 16. Competitive Analysis
- 16.1. Global Market Share Analysis 2024
- 16.2. Company Profiles
- 16.2.1 Intertek Group PLC
- 16.2.1.1. Overview
- 16.2.1.2. Products
- 16.2.1.3. SWOT Analysis
- 16.2.1.4. Recent Developments
- 16.2.1.5. Financials (Based on Availability)
- 16.2.2 Mérieux NutriSciences
- 16.2.2.1. Overview
- 16.2.2.2. Products
- 16.2.2.3. SWOT Analysis
- 16.2.2.4. Recent Developments
- 16.2.2.5. Financials (Based on Availability)
- 16.2.3 Bureau Veritas S A
- 16.2.3.1. Overview
- 16.2.3.2. Products
- 16.2.3.3. SWOT Analysis
- 16.2.3.4. Recent Developments
- 16.2.3.5. Financials (Based on Availability)
- 16.2.4 SGS SA
- 16.2.4.1. Overview
- 16.2.4.2. Products
- 16.2.4.3. SWOT Analysis
- 16.2.4.4. Recent Developments
- 16.2.4.5. Financials (Based on Availability)
- 16.2.5 Crystal Chem Inc
- 16.2.5.1. Overview
- 16.2.5.2. Products
- 16.2.5.3. SWOT Analysis
- 16.2.5.4. Recent Developments
- 16.2.5.5. Financials (Based on Availability)
- 16.2.6 Lifeasible
- 16.2.6.1. Overview
- 16.2.6.2. Products
- 16.2.6.3. SWOT Analysis
- 16.2.6.4. Recent Developments
- 16.2.6.5. Financials (Based on Availability)
- 16.2.7 ALS Limited
- 16.2.7.1. Overview
- 16.2.7.2. Products
- 16.2.7.3. SWOT Analysis
- 16.2.7.4. Recent Developments
- 16.2.7.5. Financials (Based on Availability)
- 16.2.8 Microbac Laboratories Inc
- 16.2.8.1. Overview
- 16.2.8.2. Products
- 16.2.8.3. SWOT Analysis
- 16.2.8.4. Recent Developments
- 16.2.8.5. Financials (Based on Availability)
- 16.2.9 Eurofins Scientific SE
- 16.2.9.1. Overview
- 16.2.9.2. Products
- 16.2.9.3. SWOT Analysis
- 16.2.9.4. Recent Developments
- 16.2.9.5. Financials (Based on Availability)
- 16.2.10 Neogen Corporation
- 16.2.10.1. Overview
- 16.2.10.2. Products
- 16.2.10.3. SWOT Analysis
- 16.2.10.4. Recent Developments
- 16.2.10.5. Financials (Based on Availability)
- 16.2.1 Intertek Group PLC
List of Figures
- Figure 1: Global Food Allergen Testing Industry Revenue Breakdown (Million, %) by Region 2024 & 2032
- Figure 2: North America Food Allergen Testing Industry Revenue (Million), by Country 2024 & 2032
- Figure 3: North America Food Allergen Testing Industry Revenue Share (%), by Country 2024 & 2032
- Figure 4: Europe Food Allergen Testing Industry Revenue (Million), by Country 2024 & 2032
- Figure 5: Europe Food Allergen Testing Industry Revenue Share (%), by Country 2024 & 2032
- Figure 6: Asia Pacific Food Allergen Testing Industry Revenue (Million), by Country 2024 & 2032
- Figure 7: Asia Pacific Food Allergen Testing Industry Revenue Share (%), by Country 2024 & 2032
- Figure 8: South America Food Allergen Testing Industry Revenue (Million), by Country 2024 & 2032
- Figure 9: South America Food Allergen Testing Industry Revenue Share (%), by Country 2024 & 2032
- Figure 10: Middle East and Africa Food Allergen Testing Industry Revenue (Million), by Country 2024 & 2032
- Figure 11: Middle East and Africa Food Allergen Testing Industry Revenue Share (%), by Country 2024 & 2032
- Figure 12: North America Food Allergen Testing Industry Revenue (Million), by Technology 2024 & 2032
- Figure 13: North America Food Allergen Testing Industry Revenue Share (%), by Technology 2024 & 2032
- Figure 14: North America Food Allergen Testing Industry Revenue (Million), by Application 2024 & 2032
- Figure 15: North America Food Allergen Testing Industry Revenue Share (%), by Application 2024 & 2032
- Figure 16: North America Food Allergen Testing Industry Revenue (Million), by Country 2024 & 2032
- Figure 17: North America Food Allergen Testing Industry Revenue Share (%), by Country 2024 & 2032
- Figure 18: Europe Food Allergen Testing Industry Revenue (Million), by Technology 2024 & 2032
- Figure 19: Europe Food Allergen Testing Industry Revenue Share (%), by Technology 2024 & 2032
- Figure 20: Europe Food Allergen Testing Industry Revenue (Million), by Application 2024 & 2032
- Figure 21: Europe Food Allergen Testing Industry Revenue Share (%), by Application 2024 & 2032
- Figure 22: Europe Food Allergen Testing Industry Revenue (Million), by Country 2024 & 2032
- Figure 23: Europe Food Allergen Testing Industry Revenue Share (%), by Country 2024 & 2032
- Figure 24: Asia Pacific Food Allergen Testing Industry Revenue (Million), by Technology 2024 & 2032
- Figure 25: Asia Pacific Food Allergen Testing Industry Revenue Share (%), by Technology 2024 & 2032
- Figure 26: Asia Pacific Food Allergen Testing Industry Revenue (Million), by Application 2024 & 2032
- Figure 27: Asia Pacific Food Allergen Testing Industry Revenue Share (%), by Application 2024 & 2032
- Figure 28: Asia Pacific Food Allergen Testing Industry Revenue (Million), by Country 2024 & 2032
- Figure 29: Asia Pacific Food Allergen Testing Industry Revenue Share (%), by Country 2024 & 2032
- Figure 30: South America Food Allergen Testing Industry Revenue (Million), by Technology 2024 & 2032
- Figure 31: South America Food Allergen Testing Industry Revenue Share (%), by Technology 2024 & 2032
- Figure 32: South America Food Allergen Testing Industry Revenue (Million), by Application 2024 & 2032
- Figure 33: South America Food Allergen Testing Industry Revenue Share (%), by Application 2024 & 2032
- Figure 34: South America Food Allergen Testing Industry Revenue (Million), by Country 2024 & 2032
- Figure 35: South America Food Allergen Testing Industry Revenue Share (%), by Country 2024 & 2032
- Figure 36: Middle East and Africa Food Allergen Testing Industry Revenue (Million), by Technology 2024 & 2032
- Figure 37: Middle East and Africa Food Allergen Testing Industry Revenue Share (%), by Technology 2024 & 2032
- Figure 38: Middle East and Africa Food Allergen Testing Industry Revenue (Million), by Application 2024 & 2032
- Figure 39: Middle East and Africa Food Allergen Testing Industry Revenue Share (%), by Application 2024 & 2032
- Figure 40: Middle East and Africa Food Allergen Testing Industry Revenue (Million), by Country 2024 & 2032
- Figure 41: Middle East and Africa Food Allergen Testing Industry Revenue Share (%), by Country 2024 & 2032
List of Tables
- Table 1: Global Food Allergen Testing Industry Revenue Million Forecast, by Region 2019 & 2032
- Table 2: Global Food Allergen Testing Industry Revenue Million Forecast, by Technology 2019 & 2032
- Table 3: Global Food Allergen Testing Industry Revenue Million Forecast, by Application 2019 & 2032
- Table 4: Global Food Allergen Testing Industry Revenue Million Forecast, by Region 2019 & 2032
- Table 5: Global Food Allergen Testing Industry Revenue Million Forecast, by Country 2019 & 2032
- Table 6: United States Food Allergen Testing Industry Revenue (Million) Forecast, by Application 2019 & 2032
- Table 7: Canada Food Allergen Testing Industry Revenue (Million) Forecast, by Application 2019 & 2032
- Table 8: Mexico Food Allergen Testing Industry Revenue (Million) Forecast, by Application 2019 & 2032
- Table 9: Rest of North America Food Allergen Testing Industry Revenue (Million) Forecast, by Application 2019 & 2032
- Table 10: Global Food Allergen Testing Industry Revenue Million Forecast, by Country 2019 & 2032
- Table 11: Germany Food Allergen Testing Industry Revenue (Million) Forecast, by Application 2019 & 2032
- Table 12: United Kingdom Food Allergen Testing Industry Revenue (Million) Forecast, by Application 2019 & 2032
- Table 13: France Food Allergen Testing Industry Revenue (Million) Forecast, by Application 2019 & 2032
- Table 14: Russia Food Allergen Testing Industry Revenue (Million) Forecast, by Application 2019 & 2032
- Table 15: Spain Food Allergen Testing Industry Revenue (Million) Forecast, by Application 2019 & 2032
- Table 16: Italy Food Allergen Testing Industry Revenue (Million) Forecast, by Application 2019 & 2032
- Table 17: Rest of Europe Food Allergen Testing Industry Revenue (Million) Forecast, by Application 2019 & 2032
- Table 18: Global Food Allergen Testing Industry Revenue Million Forecast, by Country 2019 & 2032
- Table 19: India Food Allergen Testing Industry Revenue (Million) Forecast, by Application 2019 & 2032
- Table 20: China Food Allergen Testing Industry Revenue (Million) Forecast, by Application 2019 & 2032
- Table 21: Japan Food Allergen Testing Industry Revenue (Million) Forecast, by Application 2019 & 2032
- Table 22: Australia Food Allergen Testing Industry Revenue (Million) Forecast, by Application 2019 & 2032
- Table 23: Rest of Asia Pacific Food Allergen Testing Industry Revenue (Million) Forecast, by Application 2019 & 2032
- Table 24: Global Food Allergen Testing Industry Revenue Million Forecast, by Country 2019 & 2032
- Table 25: Brazil Food Allergen Testing Industry Revenue (Million) Forecast, by Application 2019 & 2032
- Table 26: Argentina Food Allergen Testing Industry Revenue (Million) Forecast, by Application 2019 & 2032
- Table 27: Rest of South America Food Allergen Testing Industry Revenue (Million) Forecast, by Application 2019 & 2032
- Table 28: Global Food Allergen Testing Industry Revenue Million Forecast, by Country 2019 & 2032
- Table 29: South Africa Food Allergen Testing Industry Revenue (Million) Forecast, by Application 2019 & 2032
- Table 30: Saudi Arabia Food Allergen Testing Industry Revenue (Million) Forecast, by Application 2019 & 2032
- Table 31: Rest of Middle East and Africa Food Allergen Testing Industry Revenue (Million) Forecast, by Application 2019 & 2032
- Table 32: Global Food Allergen Testing Industry Revenue Million Forecast, by Technology 2019 & 2032
- Table 33: Global Food Allergen Testing Industry Revenue Million Forecast, by Application 2019 & 2032
- Table 34: Global Food Allergen Testing Industry Revenue Million Forecast, by Country 2019 & 2032
- Table 35: United States Food Allergen Testing Industry Revenue (Million) Forecast, by Application 2019 & 2032
- Table 36: Canada Food Allergen Testing Industry Revenue (Million) Forecast, by Application 2019 & 2032
- Table 37: Mexico Food Allergen Testing Industry Revenue (Million) Forecast, by Application 2019 & 2032
- Table 38: Rest of North America Food Allergen Testing Industry Revenue (Million) Forecast, by Application 2019 & 2032
- Table 39: Global Food Allergen Testing Industry Revenue Million Forecast, by Technology 2019 & 2032
- Table 40: Global Food Allergen Testing Industry Revenue Million Forecast, by Application 2019 & 2032
- Table 41: Global Food Allergen Testing Industry Revenue Million Forecast, by Country 2019 & 2032
- Table 42: Germany Food Allergen Testing Industry Revenue (Million) Forecast, by Application 2019 & 2032
- Table 43: United Kingdom Food Allergen Testing Industry Revenue (Million) Forecast, by Application 2019 & 2032
- Table 44: France Food Allergen Testing Industry Revenue (Million) Forecast, by Application 2019 & 2032
- Table 45: Russia Food Allergen Testing Industry Revenue (Million) Forecast, by Application 2019 & 2032
- Table 46: Spain Food Allergen Testing Industry Revenue (Million) Forecast, by Application 2019 & 2032
- Table 47: Italy Food Allergen Testing Industry Revenue (Million) Forecast, by Application 2019 & 2032
- Table 48: Rest of Europe Food Allergen Testing Industry Revenue (Million) Forecast, by Application 2019 & 2032
- Table 49: Global Food Allergen Testing Industry Revenue Million Forecast, by Technology 2019 & 2032
- Table 50: Global Food Allergen Testing Industry Revenue Million Forecast, by Application 2019 & 2032
- Table 51: Global Food Allergen Testing Industry Revenue Million Forecast, by Country 2019 & 2032
- Table 52: India Food Allergen Testing Industry Revenue (Million) Forecast, by Application 2019 & 2032
- Table 53: China Food Allergen Testing Industry Revenue (Million) Forecast, by Application 2019 & 2032
- Table 54: Japan Food Allergen Testing Industry Revenue (Million) Forecast, by Application 2019 & 2032
- Table 55: Australia Food Allergen Testing Industry Revenue (Million) Forecast, by Application 2019 & 2032
- Table 56: Rest of Asia Pacific Food Allergen Testing Industry Revenue (Million) Forecast, by Application 2019 & 2032
- Table 57: Global Food Allergen Testing Industry Revenue Million Forecast, by Technology 2019 & 2032
- Table 58: Global Food Allergen Testing Industry Revenue Million Forecast, by Application 2019 & 2032
- Table 59: Global Food Allergen Testing Industry Revenue Million Forecast, by Country 2019 & 2032
- Table 60: Brazil Food Allergen Testing Industry Revenue (Million) Forecast, by Application 2019 & 2032
- Table 61: Argentina Food Allergen Testing Industry Revenue (Million) Forecast, by Application 2019 & 2032
- Table 62: Rest of South America Food Allergen Testing Industry Revenue (Million) Forecast, by Application 2019 & 2032
- Table 63: Global Food Allergen Testing Industry Revenue Million Forecast, by Technology 2019 & 2032
- Table 64: Global Food Allergen Testing Industry Revenue Million Forecast, by Application 2019 & 2032
- Table 65: Global Food Allergen Testing Industry Revenue Million Forecast, by Country 2019 & 2032
- Table 66: South Africa Food Allergen Testing Industry Revenue (Million) Forecast, by Application 2019 & 2032
- Table 67: Saudi Arabia Food Allergen Testing Industry Revenue (Million) Forecast, by Application 2019 & 2032
- Table 68: Rest of Middle East and Africa Food Allergen Testing Industry Revenue (Million) Forecast, by Application 2019 & 2032
Frequently Asked Questions
1. What is the projected Compound Annual Growth Rate (CAGR) of the Food Allergen Testing Industry?
The projected CAGR is approximately 7.42%.
2. Which companies are prominent players in the Food Allergen Testing Industry?
Key companies in the market include Intertek Group PLC, Mérieux NutriSciences, Bureau Veritas S A, SGS SA, Crystal Chem Inc , Lifeasible, ALS Limited, Microbac Laboratories Inc, Eurofins Scientific SE, Neogen Corporation.
3. What are the main segments of the Food Allergen Testing Industry?
The market segments include Technology, Application .
4. Can you provide details about the market size?
The market size is estimated to be USD 0.89 Million as of 2022.
5. What are some drivers contributing to market growth?
Increasing Incidences of Food Allergies; Favorable Government Initiatives and Regulations for Food Safety.
6. What are the notable trends driving market growth?
Increasing Prevalence of Food Allergies.
7. Are there any restraints impacting market growth?
Inconsistencies Involved in Food Allergen Declarations.
8. Can you provide examples of recent developments in the market?
March 2024: Gold Standard Diagnostics launched the first product of the new allergen PowerLine tests: the SENSIStrip Gluten PowerLine Lateral Flow Device. The product comprises a sensitive detection system based on a monoclonal antibody and can detect gluten residues in food matrices, rinse water, and swabs.
9. What pricing options are available for accessing the report?
Pricing options include single-user, multi-user, and enterprise licenses priced at USD 4750, USD 5250, and USD 8750 respectively.
10. Is the market size provided in terms of value or volume?
The market size is provided in terms of value, measured in Million.
11. Are there any specific market keywords associated with the report?
Yes, the market keyword associated with the report is "Food Allergen Testing Industry," which aids in identifying and referencing the specific market segment covered.
12. How do I determine which pricing option suits my needs best?
The pricing options vary based on user requirements and access needs. Individual users may opt for single-user licenses, while businesses requiring broader access may choose multi-user or enterprise licenses for cost-effective access to the report.
13. Are there any additional resources or data provided in the Food Allergen Testing Industry report?
While the report offers comprehensive insights, it's advisable to review the specific contents or supplementary materials provided to ascertain if additional resources or data are available.
14. How can I stay updated on further developments or reports in the Food Allergen Testing Industry?
To stay informed about further developments, trends, and reports in the Food Allergen Testing Industry, consider subscribing to industry newsletters, following relevant companies and organizations, or regularly checking reputable industry news sources and publications.
Methodology
Step 1 - Identification of Relevant Samples Size from Population Database


Step 2 - Approaches for Defining Global Market Size (Value, Volume* & Price*)

Note*: In applicable scenarios
Step 3 - Data Sources
Primary Research
- Web Analytics
- Survey Reports
- Research Institute
- Latest Research Reports
- Opinion Leaders
Secondary Research
- Annual Reports
- White Paper
- Latest Press Release
- Industry Association
- Paid Database
- Investor Presentations

Step 4 - Data Triangulation
Involves using different sources of information in order to increase the validity of a study
These sources are likely to be stakeholders in a program - participants, other researchers, program staff, other community members, and so on.
Then we put all data in single framework & apply various statistical tools to find out the dynamic on the market.
During the analysis stage, feedback from the stakeholder groups would be compared to determine areas of agreement as well as areas of divergence
