

Key Insights
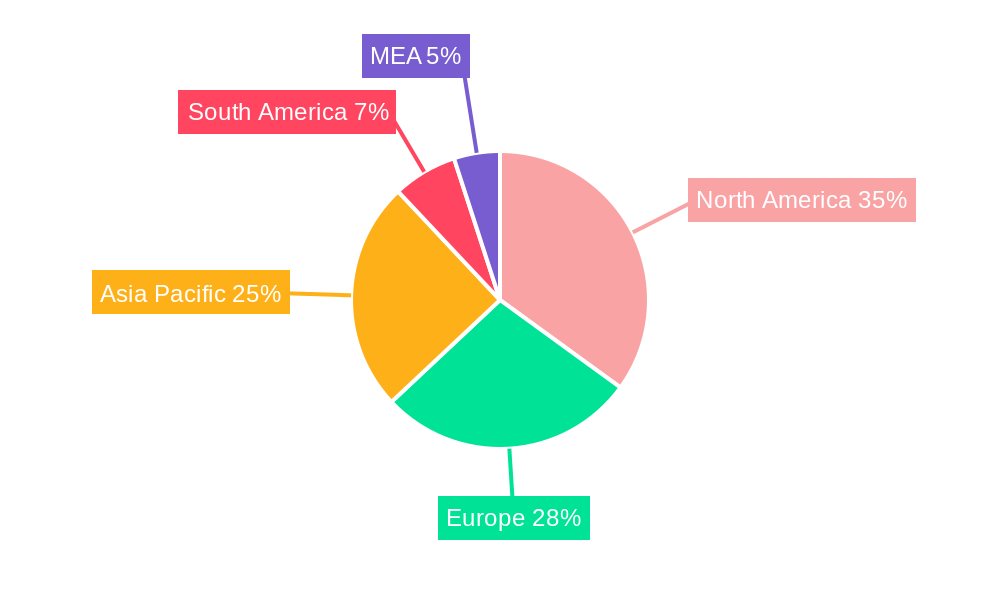
The aprotic solvents market, valued at $17.49 billion in 2025, is projected to experience steady growth, driven by increasing demand across diverse sectors. A compound annual growth rate (CAGR) of 3.06% from 2025 to 2033 indicates a sustained expansion, primarily fueled by the burgeoning oil and gas industry, the flourishing plastics sector, and the ever-growing pharmaceutical and electronics manufacturing. The robust growth in these industries necessitates higher volumes of solvents for cleaning, extraction, and reaction processes. N-Methyl-2-Pyrrolidone (NMP) and toluene currently dominate the solvent type segment, reflecting their versatile applications and established market presence. However, the market is witnessing a growing adoption of more environmentally friendly solvents, pushing manufacturers towards innovation and the development of sustainable alternatives to mitigate concerns regarding toxicity and environmental impact. This shift toward sustainability, coupled with stringent environmental regulations, presents both challenges and opportunities for market players. Regional analysis reveals North America and Asia-Pacific as key contributors, reflecting the concentration of major industries and manufacturing hubs in these regions. Competitive dynamics are shaped by established players like INEOS, Mitsui Chemicals, and BASF, who are constantly striving for technological advancements and strategic partnerships to maintain their market share.
The forecast period (2025-2033) anticipates continued growth, albeit at a moderate pace. Factors such as fluctuating raw material prices and potential economic downturns could influence market trajectory. However, the long-term outlook remains positive, driven by the continuous expansion of key end-use industries. The increasing demand for high-performance materials, coupled with technological innovations within the solvent manufacturing sector, promises further expansion of this vital market segment. The ongoing research and development in the synthesis of novel aprotic solvents with improved properties and reduced environmental impact will play a crucial role in shaping market dynamics in the coming years.
This comprehensive report provides an in-depth analysis of the Aprotic Solvents industry, projecting a market value exceeding $XX Billion by 2033. The study covers the period 2019-2033, with 2025 serving as the base and estimated year. It offers invaluable insights into market structure, competitive dynamics, segment performance, technological advancements, and future growth prospects. Key players like INEOS, Mitsui Chemicals Inc, Gaylord Chemical Company LLC, AlzChem Group AG, Ashland, BASF SE, Dow, and Eastman Chemical Company are analyzed in detail.

Aprotic Solvents Industry Market Structure & Competitive Landscape
The Aprotic Solvents market exhibits a moderately concentrated structure, with the top five players holding approximately xx% market share in 2025. INEOS, BASF SE, and Dow are prominent leaders, driving innovation and setting industry standards. The market is characterized by intense competition, fueled by product differentiation and expansion into diverse applications.
- Market Concentration: The Herfindahl-Hirschman Index (HHI) is estimated at xx in 2025, suggesting a moderately concentrated market.
- Innovation Drivers: Research and development efforts focus on developing environmentally friendly solvents and expanding applications in high-growth sectors like electronics and pharmaceuticals.
- Regulatory Impacts: Stringent environmental regulations regarding volatile organic compounds (VOCs) and hazardous waste management significantly influence market dynamics.
- Product Substitutes: The industry faces competition from alternative solvents like ionic liquids and supercritical fluids, particularly in environmentally sensitive applications.
- End-User Segmentation: The market is driven by strong demand from the plastics, pharmaceuticals, and coatings industries, while the oil and gas sector contributes a significant share.
- M&A Trends: Consolidation through mergers and acquisitions (M&A) is observed, with an estimated xx Billion in M&A activity during 2019-2024, driven by efforts to expand product portfolios and market reach.
Aprotic Solvents Industry Market Trends & Opportunities
The Aprotic Solvents market is projected to experience robust growth, with a CAGR of xx% during the forecast period (2025-2033). This growth is attributed to several factors, including rising demand across diverse end-use industries, technological advancements leading to the development of high-performance solvents, and the increasing adoption of sustainable practices. Market penetration rates in emerging economies are expected to increase significantly, driving overall market expansion. The shift towards eco-friendly solvents and the development of advanced applications, particularly within the electronics and pharmaceutical sectors, present significant growth opportunities. Intensifying competition among established players is driving innovation and the introduction of new and improved products, further enhancing market growth.

Dominant Markets & Segments in Aprotic Solvents Industry
The global Aprotic Solvents market is geographically diversified, with significant contributions from North America, Europe, and Asia Pacific. However, the Asia-Pacific region is expected to exhibit the fastest growth rate over the forecast period, driven by robust industrial growth and increasing infrastructure development.
Dominant Segments:
- By Type: N-Methyl-2-Pyrrolidone (NMP) holds the largest market share due to its versatility and high demand across various applications.
- By Application: The plastics and pharmaceutical sectors are the dominant consumers of Aprotic solvents, followed by the coatings and adhesives industries.
Key Growth Drivers:
- Rapid industrialization in developing economies: Increased manufacturing activities, particularly in Asia-Pacific, fuels demand for Aprotic solvents.
- Government support for infrastructure development: Government investments in infrastructure projects in various regions contribute to the growth of the Aprotic solvent market.
- Technological advancements in end-use industries: Innovations in plastics, pharmaceuticals, and electronic equipment manufacturing increase the need for specialized Aprotic solvents.
Aprotic Solvents Industry Product Analysis
Technological advancements are driving innovation in Aprotic solvents, leading to the development of more efficient, safer, and environmentally friendly products. This includes the development of biodegradable solvents and those with improved performance characteristics. Key innovations include the introduction of tailored solvents for specific applications, improving process efficiency and product quality. These improvements are strengthening the market position of leading companies and attracting new players.
Key Drivers, Barriers & Challenges in Aprotic Solvents Industry
Key Drivers:
- Growing demand from various industries: The increasing use of Aprotic solvents in diverse sectors like plastics, pharmaceuticals, and coatings is a key driver.
- Technological advancements: The development of new and improved Aprotic solvents with enhanced performance and environmental properties is driving market growth.
- Favorable government policies: Support for sustainable manufacturing and infrastructure development in various countries contributes positively.
Challenges:
- Stringent environmental regulations: Compliance costs associated with stringent regulations regarding VOC emissions and waste disposal present a challenge. Estimated compliance costs are projected to reach $XX Billion annually by 2033.
- Fluctuations in raw material prices: Price volatility of key raw materials used in the production of Aprotic solvents affects profitability.
- Intense competition: The presence of numerous players in the market, with varying levels of scale and technological capabilities, intensifies competition.
Growth Drivers in the Aprotic Solvents Industry Market
Strong demand from diverse end-use industries, coupled with ongoing technological advancements, are the primary growth drivers. The development of eco-friendly solvents and favorable government policies promoting sustainable manufacturing further contribute to market expansion. Increasing investments in research and development to develop high-performance and specialized solvents also play a significant role.
Challenges Impacting Aprotic Solvents Industry Growth
Stringent environmental regulations, fluctuating raw material prices, and intense competition pose significant challenges. Ensuring compliance with environmental regulations, managing raw material cost volatility, and developing a strong competitive edge are crucial for success in this market.
Key Players Shaping the Aprotic Solvents Industry Market
- INEOS
- Mitsui Chemicals Inc
- Gaylord Chemical Company LLC
- AlzChem Group AG
- Ashland
- BASF SE
- Dow
- Eastman Chemical Company
Significant Aprotic Solvents Industry Milestones
- 2020: INEOS launched a new line of sustainable Aprotic solvents.
- 2022: BASF SE announced a significant expansion of its Aprotic solvent production capacity.
- 2023: A major merger between two mid-sized Aprotic solvent producers created a more consolidated market structure. (Further details are unavailable)
Future Outlook for Aprotic Solvents Industry Market
The Aprotic solvents market is poised for continued growth, driven by the increasing demand from diverse sectors, technological innovations leading to more sustainable and efficient products, and favorable governmental policies. Strategic partnerships, expansions into emerging markets, and investments in research and development will play key roles in shaping the future landscape of this industry. The market is expected to reach a value exceeding $XX Billion by 2033, presenting significant opportunities for established and emerging players alike.
Aprotic Solvents Industry Segmentation
-
1. Type
- 1.1. N-Methyl-2-Pyrrolidone (NMP)
- 1.2. Toluene
- 1.3. Benzene
- 1.4. Acetone
- 1.5. Others
-
2. Application
- 2.1. Oil and Gas
- 2.2. Plastics
- 2.3. Pharmaceutical
- 2.4. Electronic Equipments
- 2.5. Paints and Coatings
- 2.6. Adhesives
- 2.7. Others
Aprotic Solvents Industry Segmentation By Geography
-
1. Asia Pacific
- 1.1. China
- 1.2. India
- 1.3. Japan
- 1.4. South Korea
- 1.5. Rest of Asia Pacific
-
2. North America
- 2.1. United States
- 2.2. Canada
- 2.3. Mexico
-
3. Europe
- 3.1. Germany
- 3.2. United Kingdom
- 3.3. France
- 3.4. Italy
- 3.5. Rest of Europe
-
4. South America
- 4.1. Brazil
- 4.2. Argentina
- 4.3. Rest of South America
-
5. Middle East and Africa
- 5.1. Saudi Arabia
- 5.2. South Africa
- 5.3. Rest of Middle East and Africa
Aprotic Solvents Industry REPORT HIGHLIGHTS
| Aspects | Details |
|---|---|
| Study Period | 2019-2033 |
| Base Year | 2024 |
| Estimated Year | 2025 |
| Forecast Period | 2025-2033 |
| Historical Period | 2019-2024 |
| Growth Rate | CAGR of 3.06% from 2019-2033 |
| Segmentation |
|
Table of Contents
- 1. Introduction
- 1.1. Research Scope
- 1.2. Market Segmentation
- 1.3. Research Methodology
- 1.4. Definitions and Assumptions
- 2. Executive Summary
- 2.1. Introduction
- 3. Market Dynamics
- 3.1. Introduction
- 3.2. Market Drivers
- 3.2.1. ; Growing Demand from Oil and Gas Industry; Increasing Consumption in Pharmaceutical Sector
- 3.3. Market Restrains
- 3.3.1. ; Non-Toxic Substitutes; Envrionmental Concerns; Unfavorable Conditions Arising Due to COVID-19 Outbreak
- 3.4. Market Trends
- 3.4.1. Application in the Oil and Gas Sector to Dominate the Market
- 4. Market Factor Analysis
- 4.1. Porters Five Forces
- 4.2. Supply/Value Chain
- 4.3. PESTEL analysis
- 4.4. Market Entropy
- 4.5. Patent/Trademark Analysis
- 5. Global Aprotic Solvents Industry Analysis, Insights and Forecast, 2019-2031
- 5.1. Market Analysis, Insights and Forecast - by Type
- 5.1.1. N-Methyl-2-Pyrrolidone (NMP)
- 5.1.2. Toluene
- 5.1.3. Benzene
- 5.1.4. Acetone
- 5.1.5. Others
- 5.2. Market Analysis, Insights and Forecast - by Application
- 5.2.1. Oil and Gas
- 5.2.2. Plastics
- 5.2.3. Pharmaceutical
- 5.2.4. Electronic Equipments
- 5.2.5. Paints and Coatings
- 5.2.6. Adhesives
- 5.2.7. Others
- 5.3. Market Analysis, Insights and Forecast - by Region
- 5.3.1. Asia Pacific
- 5.3.2. North America
- 5.3.3. Europe
- 5.3.4. South America
- 5.3.5. Middle East and Africa
- 5.1. Market Analysis, Insights and Forecast - by Type
- 6. Asia Pacific Aprotic Solvents Industry Analysis, Insights and Forecast, 2019-2031
- 6.1. Market Analysis, Insights and Forecast - by Type
- 6.1.1. N-Methyl-2-Pyrrolidone (NMP)
- 6.1.2. Toluene
- 6.1.3. Benzene
- 6.1.4. Acetone
- 6.1.5. Others
- 6.2. Market Analysis, Insights and Forecast - by Application
- 6.2.1. Oil and Gas
- 6.2.2. Plastics
- 6.2.3. Pharmaceutical
- 6.2.4. Electronic Equipments
- 6.2.5. Paints and Coatings
- 6.2.6. Adhesives
- 6.2.7. Others
- 6.1. Market Analysis, Insights and Forecast - by Type
- 7. North America Aprotic Solvents Industry Analysis, Insights and Forecast, 2019-2031
- 7.1. Market Analysis, Insights and Forecast - by Type
- 7.1.1. N-Methyl-2-Pyrrolidone (NMP)
- 7.1.2. Toluene
- 7.1.3. Benzene
- 7.1.4. Acetone
- 7.1.5. Others
- 7.2. Market Analysis, Insights and Forecast - by Application
- 7.2.1. Oil and Gas
- 7.2.2. Plastics
- 7.2.3. Pharmaceutical
- 7.2.4. Electronic Equipments
- 7.2.5. Paints and Coatings
- 7.2.6. Adhesives
- 7.2.7. Others
- 7.1. Market Analysis, Insights and Forecast - by Type
- 8. Europe Aprotic Solvents Industry Analysis, Insights and Forecast, 2019-2031
- 8.1. Market Analysis, Insights and Forecast - by Type
- 8.1.1. N-Methyl-2-Pyrrolidone (NMP)
- 8.1.2. Toluene
- 8.1.3. Benzene
- 8.1.4. Acetone
- 8.1.5. Others
- 8.2. Market Analysis, Insights and Forecast - by Application
- 8.2.1. Oil and Gas
- 8.2.2. Plastics
- 8.2.3. Pharmaceutical
- 8.2.4. Electronic Equipments
- 8.2.5. Paints and Coatings
- 8.2.6. Adhesives
- 8.2.7. Others
- 8.1. Market Analysis, Insights and Forecast - by Type
- 9. South America Aprotic Solvents Industry Analysis, Insights and Forecast, 2019-2031
- 9.1. Market Analysis, Insights and Forecast - by Type
- 9.1.1. N-Methyl-2-Pyrrolidone (NMP)
- 9.1.2. Toluene
- 9.1.3. Benzene
- 9.1.4. Acetone
- 9.1.5. Others
- 9.2. Market Analysis, Insights and Forecast - by Application
- 9.2.1. Oil and Gas
- 9.2.2. Plastics
- 9.2.3. Pharmaceutical
- 9.2.4. Electronic Equipments
- 9.2.5. Paints and Coatings
- 9.2.6. Adhesives
- 9.2.7. Others
- 9.1. Market Analysis, Insights and Forecast - by Type
- 10. Middle East and Africa Aprotic Solvents Industry Analysis, Insights and Forecast, 2019-2031
- 10.1. Market Analysis, Insights and Forecast - by Type
- 10.1.1. N-Methyl-2-Pyrrolidone (NMP)
- 10.1.2. Toluene
- 10.1.3. Benzene
- 10.1.4. Acetone
- 10.1.5. Others
- 10.2. Market Analysis, Insights and Forecast - by Application
- 10.2.1. Oil and Gas
- 10.2.2. Plastics
- 10.2.3. Pharmaceutical
- 10.2.4. Electronic Equipments
- 10.2.5. Paints and Coatings
- 10.2.6. Adhesives
- 10.2.7. Others
- 10.1. Market Analysis, Insights and Forecast - by Type
- 11. North America Aprotic Solvents Industry Analysis, Insights and Forecast, 2019-2031
- 11.1. Market Analysis, Insights and Forecast - By Country/Sub-region
- 11.1.1 United States
- 11.1.2 Canada
- 11.1.3 Mexico
- 12. Europe Aprotic Solvents Industry Analysis, Insights and Forecast, 2019-2031
- 12.1. Market Analysis, Insights and Forecast - By Country/Sub-region
- 12.1.1 Germany
- 12.1.2 France
- 12.1.3 Italy
- 12.1.4 United Kingdom
- 12.1.5 Netherlands
- 12.1.6 Rest of Europe
- 13. Asia Pacific Aprotic Solvents Industry Analysis, Insights and Forecast, 2019-2031
- 13.1. Market Analysis, Insights and Forecast - By Country/Sub-region
- 13.1.1 China
- 13.1.2 Japan
- 13.1.3 India
- 13.1.4 South Korea
- 13.1.5 Taiwan
- 13.1.6 Australia
- 13.1.7 Rest of Asia-Pacific
- 14. South America Aprotic Solvents Industry Analysis, Insights and Forecast, 2019-2031
- 14.1. Market Analysis, Insights and Forecast - By Country/Sub-region
- 14.1.1 Brazil
- 14.1.2 Argentina
- 14.1.3 Rest of South America
- 15. MEA Aprotic Solvents Industry Analysis, Insights and Forecast, 2019-2031
- 15.1. Market Analysis, Insights and Forecast - By Country/Sub-region
- 15.1.1 Middle East
- 15.1.2 Africa
- 16. Competitive Analysis
- 16.1. Global Market Share Analysis 2024
- 16.2. Company Profiles
- 16.2.1 INEOS
- 16.2.1.1. Overview
- 16.2.1.2. Products
- 16.2.1.3. SWOT Analysis
- 16.2.1.4. Recent Developments
- 16.2.1.5. Financials (Based on Availability)
- 16.2.2 Mitsui Chemicals Inc
- 16.2.2.1. Overview
- 16.2.2.2. Products
- 16.2.2.3. SWOT Analysis
- 16.2.2.4. Recent Developments
- 16.2.2.5. Financials (Based on Availability)
- 16.2.3 Gaylord Chemical Company LLC
- 16.2.3.1. Overview
- 16.2.3.2. Products
- 16.2.3.3. SWOT Analysis
- 16.2.3.4. Recent Developments
- 16.2.3.5. Financials (Based on Availability)
- 16.2.4 AlzChem Group AG
- 16.2.4.1. Overview
- 16.2.4.2. Products
- 16.2.4.3. SWOT Analysis
- 16.2.4.4. Recent Developments
- 16.2.4.5. Financials (Based on Availability)
- 16.2.5 Ashland
- 16.2.5.1. Overview
- 16.2.5.2. Products
- 16.2.5.3. SWOT Analysis
- 16.2.5.4. Recent Developments
- 16.2.5.5. Financials (Based on Availability)
- 16.2.6 BASF SE
- 16.2.6.1. Overview
- 16.2.6.2. Products
- 16.2.6.3. SWOT Analysis
- 16.2.6.4. Recent Developments
- 16.2.6.5. Financials (Based on Availability)
- 16.2.7 Dow
- 16.2.7.1. Overview
- 16.2.7.2. Products
- 16.2.7.3. SWOT Analysis
- 16.2.7.4. Recent Developments
- 16.2.7.5. Financials (Based on Availability)
- 16.2.8 Eastman Chemical Company
- 16.2.8.1. Overview
- 16.2.8.2. Products
- 16.2.8.3. SWOT Analysis
- 16.2.8.4. Recent Developments
- 16.2.8.5. Financials (Based on Availability)
- 16.2.1 INEOS
List of Figures
- Figure 1: Global Aprotic Solvents Industry Revenue Breakdown (Billion, %) by Region 2024 & 2032
- Figure 2: Global Aprotic Solvents Industry Volume Breakdown (K Tons, %) by Region 2024 & 2032
- Figure 3: North America Aprotic Solvents Industry Revenue (Billion), by Country 2024 & 2032
- Figure 4: North America Aprotic Solvents Industry Volume (K Tons), by Country 2024 & 2032
- Figure 5: North America Aprotic Solvents Industry Revenue Share (%), by Country 2024 & 2032
- Figure 6: North America Aprotic Solvents Industry Volume Share (%), by Country 2024 & 2032
- Figure 7: Europe Aprotic Solvents Industry Revenue (Billion), by Country 2024 & 2032
- Figure 8: Europe Aprotic Solvents Industry Volume (K Tons), by Country 2024 & 2032
- Figure 9: Europe Aprotic Solvents Industry Revenue Share (%), by Country 2024 & 2032
- Figure 10: Europe Aprotic Solvents Industry Volume Share (%), by Country 2024 & 2032
- Figure 11: Asia Pacific Aprotic Solvents Industry Revenue (Billion), by Country 2024 & 2032
- Figure 12: Asia Pacific Aprotic Solvents Industry Volume (K Tons), by Country 2024 & 2032
- Figure 13: Asia Pacific Aprotic Solvents Industry Revenue Share (%), by Country 2024 & 2032
- Figure 14: Asia Pacific Aprotic Solvents Industry Volume Share (%), by Country 2024 & 2032
- Figure 15: South America Aprotic Solvents Industry Revenue (Billion), by Country 2024 & 2032
- Figure 16: South America Aprotic Solvents Industry Volume (K Tons), by Country 2024 & 2032
- Figure 17: South America Aprotic Solvents Industry Revenue Share (%), by Country 2024 & 2032
- Figure 18: South America Aprotic Solvents Industry Volume Share (%), by Country 2024 & 2032
- Figure 19: MEA Aprotic Solvents Industry Revenue (Billion), by Country 2024 & 2032
- Figure 20: MEA Aprotic Solvents Industry Volume (K Tons), by Country 2024 & 2032
- Figure 21: MEA Aprotic Solvents Industry Revenue Share (%), by Country 2024 & 2032
- Figure 22: MEA Aprotic Solvents Industry Volume Share (%), by Country 2024 & 2032
- Figure 23: Asia Pacific Aprotic Solvents Industry Revenue (Billion), by Type 2024 & 2032
- Figure 24: Asia Pacific Aprotic Solvents Industry Volume (K Tons), by Type 2024 & 2032
- Figure 25: Asia Pacific Aprotic Solvents Industry Revenue Share (%), by Type 2024 & 2032
- Figure 26: Asia Pacific Aprotic Solvents Industry Volume Share (%), by Type 2024 & 2032
- Figure 27: Asia Pacific Aprotic Solvents Industry Revenue (Billion), by Application 2024 & 2032
- Figure 28: Asia Pacific Aprotic Solvents Industry Volume (K Tons), by Application 2024 & 2032
- Figure 29: Asia Pacific Aprotic Solvents Industry Revenue Share (%), by Application 2024 & 2032
- Figure 30: Asia Pacific Aprotic Solvents Industry Volume Share (%), by Application 2024 & 2032
- Figure 31: Asia Pacific Aprotic Solvents Industry Revenue (Billion), by Country 2024 & 2032
- Figure 32: Asia Pacific Aprotic Solvents Industry Volume (K Tons), by Country 2024 & 2032
- Figure 33: Asia Pacific Aprotic Solvents Industry Revenue Share (%), by Country 2024 & 2032
- Figure 34: Asia Pacific Aprotic Solvents Industry Volume Share (%), by Country 2024 & 2032
- Figure 35: North America Aprotic Solvents Industry Revenue (Billion), by Type 2024 & 2032
- Figure 36: North America Aprotic Solvents Industry Volume (K Tons), by Type 2024 & 2032
- Figure 37: North America Aprotic Solvents Industry Revenue Share (%), by Type 2024 & 2032
- Figure 38: North America Aprotic Solvents Industry Volume Share (%), by Type 2024 & 2032
- Figure 39: North America Aprotic Solvents Industry Revenue (Billion), by Application 2024 & 2032
- Figure 40: North America Aprotic Solvents Industry Volume (K Tons), by Application 2024 & 2032
- Figure 41: North America Aprotic Solvents Industry Revenue Share (%), by Application 2024 & 2032
- Figure 42: North America Aprotic Solvents Industry Volume Share (%), by Application 2024 & 2032
- Figure 43: North America Aprotic Solvents Industry Revenue (Billion), by Country 2024 & 2032
- Figure 44: North America Aprotic Solvents Industry Volume (K Tons), by Country 2024 & 2032
- Figure 45: North America Aprotic Solvents Industry Revenue Share (%), by Country 2024 & 2032
- Figure 46: North America Aprotic Solvents Industry Volume Share (%), by Country 2024 & 2032
- Figure 47: Europe Aprotic Solvents Industry Revenue (Billion), by Type 2024 & 2032
- Figure 48: Europe Aprotic Solvents Industry Volume (K Tons), by Type 2024 & 2032
- Figure 49: Europe Aprotic Solvents Industry Revenue Share (%), by Type 2024 & 2032
- Figure 50: Europe Aprotic Solvents Industry Volume Share (%), by Type 2024 & 2032
- Figure 51: Europe Aprotic Solvents Industry Revenue (Billion), by Application 2024 & 2032
- Figure 52: Europe Aprotic Solvents Industry Volume (K Tons), by Application 2024 & 2032
- Figure 53: Europe Aprotic Solvents Industry Revenue Share (%), by Application 2024 & 2032
- Figure 54: Europe Aprotic Solvents Industry Volume Share (%), by Application 2024 & 2032
- Figure 55: Europe Aprotic Solvents Industry Revenue (Billion), by Country 2024 & 2032
- Figure 56: Europe Aprotic Solvents Industry Volume (K Tons), by Country 2024 & 2032
- Figure 57: Europe Aprotic Solvents Industry Revenue Share (%), by Country 2024 & 2032
- Figure 58: Europe Aprotic Solvents Industry Volume Share (%), by Country 2024 & 2032
- Figure 59: South America Aprotic Solvents Industry Revenue (Billion), by Type 2024 & 2032
- Figure 60: South America Aprotic Solvents Industry Volume (K Tons), by Type 2024 & 2032
- Figure 61: South America Aprotic Solvents Industry Revenue Share (%), by Type 2024 & 2032
- Figure 62: South America Aprotic Solvents Industry Volume Share (%), by Type 2024 & 2032
- Figure 63: South America Aprotic Solvents Industry Revenue (Billion), by Application 2024 & 2032
- Figure 64: South America Aprotic Solvents Industry Volume (K Tons), by Application 2024 & 2032
- Figure 65: South America Aprotic Solvents Industry Revenue Share (%), by Application 2024 & 2032
- Figure 66: South America Aprotic Solvents Industry Volume Share (%), by Application 2024 & 2032
- Figure 67: South America Aprotic Solvents Industry Revenue (Billion), by Country 2024 & 2032
- Figure 68: South America Aprotic Solvents Industry Volume (K Tons), by Country 2024 & 2032
- Figure 69: South America Aprotic Solvents Industry Revenue Share (%), by Country 2024 & 2032
- Figure 70: South America Aprotic Solvents Industry Volume Share (%), by Country 2024 & 2032
- Figure 71: Middle East and Africa Aprotic Solvents Industry Revenue (Billion), by Type 2024 & 2032
- Figure 72: Middle East and Africa Aprotic Solvents Industry Volume (K Tons), by Type 2024 & 2032
- Figure 73: Middle East and Africa Aprotic Solvents Industry Revenue Share (%), by Type 2024 & 2032
- Figure 74: Middle East and Africa Aprotic Solvents Industry Volume Share (%), by Type 2024 & 2032
- Figure 75: Middle East and Africa Aprotic Solvents Industry Revenue (Billion), by Application 2024 & 2032
- Figure 76: Middle East and Africa Aprotic Solvents Industry Volume (K Tons), by Application 2024 & 2032
- Figure 77: Middle East and Africa Aprotic Solvents Industry Revenue Share (%), by Application 2024 & 2032
- Figure 78: Middle East and Africa Aprotic Solvents Industry Volume Share (%), by Application 2024 & 2032
- Figure 79: Middle East and Africa Aprotic Solvents Industry Revenue (Billion), by Country 2024 & 2032
- Figure 80: Middle East and Africa Aprotic Solvents Industry Volume (K Tons), by Country 2024 & 2032
- Figure 81: Middle East and Africa Aprotic Solvents Industry Revenue Share (%), by Country 2024 & 2032
- Figure 82: Middle East and Africa Aprotic Solvents Industry Volume Share (%), by Country 2024 & 2032
List of Tables
- Table 1: Global Aprotic Solvents Industry Revenue Billion Forecast, by Region 2019 & 2032
- Table 2: Global Aprotic Solvents Industry Volume K Tons Forecast, by Region 2019 & 2032
- Table 3: Global Aprotic Solvents Industry Revenue Billion Forecast, by Type 2019 & 2032
- Table 4: Global Aprotic Solvents Industry Volume K Tons Forecast, by Type 2019 & 2032
- Table 5: Global Aprotic Solvents Industry Revenue Billion Forecast, by Application 2019 & 2032
- Table 6: Global Aprotic Solvents Industry Volume K Tons Forecast, by Application 2019 & 2032
- Table 7: Global Aprotic Solvents Industry Revenue Billion Forecast, by Region 2019 & 2032
- Table 8: Global Aprotic Solvents Industry Volume K Tons Forecast, by Region 2019 & 2032
- Table 9: Global Aprotic Solvents Industry Revenue Billion Forecast, by Country 2019 & 2032
- Table 10: Global Aprotic Solvents Industry Volume K Tons Forecast, by Country 2019 & 2032
- Table 11: United States Aprotic Solvents Industry Revenue (Billion) Forecast, by Application 2019 & 2032
- Table 12: United States Aprotic Solvents Industry Volume (K Tons) Forecast, by Application 2019 & 2032
- Table 13: Canada Aprotic Solvents Industry Revenue (Billion) Forecast, by Application 2019 & 2032
- Table 14: Canada Aprotic Solvents Industry Volume (K Tons) Forecast, by Application 2019 & 2032
- Table 15: Mexico Aprotic Solvents Industry Revenue (Billion) Forecast, by Application 2019 & 2032
- Table 16: Mexico Aprotic Solvents Industry Volume (K Tons) Forecast, by Application 2019 & 2032
- Table 17: Global Aprotic Solvents Industry Revenue Billion Forecast, by Country 2019 & 2032
- Table 18: Global Aprotic Solvents Industry Volume K Tons Forecast, by Country 2019 & 2032
- Table 19: Germany Aprotic Solvents Industry Revenue (Billion) Forecast, by Application 2019 & 2032
- Table 20: Germany Aprotic Solvents Industry Volume (K Tons) Forecast, by Application 2019 & 2032
- Table 21: France Aprotic Solvents Industry Revenue (Billion) Forecast, by Application 2019 & 2032
- Table 22: France Aprotic Solvents Industry Volume (K Tons) Forecast, by Application 2019 & 2032
- Table 23: Italy Aprotic Solvents Industry Revenue (Billion) Forecast, by Application 2019 & 2032
- Table 24: Italy Aprotic Solvents Industry Volume (K Tons) Forecast, by Application 2019 & 2032
- Table 25: United Kingdom Aprotic Solvents Industry Revenue (Billion) Forecast, by Application 2019 & 2032
- Table 26: United Kingdom Aprotic Solvents Industry Volume (K Tons) Forecast, by Application 2019 & 2032
- Table 27: Netherlands Aprotic Solvents Industry Revenue (Billion) Forecast, by Application 2019 & 2032
- Table 28: Netherlands Aprotic Solvents Industry Volume (K Tons) Forecast, by Application 2019 & 2032
- Table 29: Rest of Europe Aprotic Solvents Industry Revenue (Billion) Forecast, by Application 2019 & 2032
- Table 30: Rest of Europe Aprotic Solvents Industry Volume (K Tons) Forecast, by Application 2019 & 2032
- Table 31: Global Aprotic Solvents Industry Revenue Billion Forecast, by Country 2019 & 2032
- Table 32: Global Aprotic Solvents Industry Volume K Tons Forecast, by Country 2019 & 2032
- Table 33: China Aprotic Solvents Industry Revenue (Billion) Forecast, by Application 2019 & 2032
- Table 34: China Aprotic Solvents Industry Volume (K Tons) Forecast, by Application 2019 & 2032
- Table 35: Japan Aprotic Solvents Industry Revenue (Billion) Forecast, by Application 2019 & 2032
- Table 36: Japan Aprotic Solvents Industry Volume (K Tons) Forecast, by Application 2019 & 2032
- Table 37: India Aprotic Solvents Industry Revenue (Billion) Forecast, by Application 2019 & 2032
- Table 38: India Aprotic Solvents Industry Volume (K Tons) Forecast, by Application 2019 & 2032
- Table 39: South Korea Aprotic Solvents Industry Revenue (Billion) Forecast, by Application 2019 & 2032
- Table 40: South Korea Aprotic Solvents Industry Volume (K Tons) Forecast, by Application 2019 & 2032
- Table 41: Taiwan Aprotic Solvents Industry Revenue (Billion) Forecast, by Application 2019 & 2032
- Table 42: Taiwan Aprotic Solvents Industry Volume (K Tons) Forecast, by Application 2019 & 2032
- Table 43: Australia Aprotic Solvents Industry Revenue (Billion) Forecast, by Application 2019 & 2032
- Table 44: Australia Aprotic Solvents Industry Volume (K Tons) Forecast, by Application 2019 & 2032
- Table 45: Rest of Asia-Pacific Aprotic Solvents Industry Revenue (Billion) Forecast, by Application 2019 & 2032
- Table 46: Rest of Asia-Pacific Aprotic Solvents Industry Volume (K Tons) Forecast, by Application 2019 & 2032
- Table 47: Global Aprotic Solvents Industry Revenue Billion Forecast, by Country 2019 & 2032
- Table 48: Global Aprotic Solvents Industry Volume K Tons Forecast, by Country 2019 & 2032
- Table 49: Brazil Aprotic Solvents Industry Revenue (Billion) Forecast, by Application 2019 & 2032
- Table 50: Brazil Aprotic Solvents Industry Volume (K Tons) Forecast, by Application 2019 & 2032
- Table 51: Argentina Aprotic Solvents Industry Revenue (Billion) Forecast, by Application 2019 & 2032
- Table 52: Argentina Aprotic Solvents Industry Volume (K Tons) Forecast, by Application 2019 & 2032
- Table 53: Rest of South America Aprotic Solvents Industry Revenue (Billion) Forecast, by Application 2019 & 2032
- Table 54: Rest of South America Aprotic Solvents Industry Volume (K Tons) Forecast, by Application 2019 & 2032
- Table 55: Global Aprotic Solvents Industry Revenue Billion Forecast, by Country 2019 & 2032
- Table 56: Global Aprotic Solvents Industry Volume K Tons Forecast, by Country 2019 & 2032
- Table 57: Middle East Aprotic Solvents Industry Revenue (Billion) Forecast, by Application 2019 & 2032
- Table 58: Middle East Aprotic Solvents Industry Volume (K Tons) Forecast, by Application 2019 & 2032
- Table 59: Africa Aprotic Solvents Industry Revenue (Billion) Forecast, by Application 2019 & 2032
- Table 60: Africa Aprotic Solvents Industry Volume (K Tons) Forecast, by Application 2019 & 2032
- Table 61: Global Aprotic Solvents Industry Revenue Billion Forecast, by Type 2019 & 2032
- Table 62: Global Aprotic Solvents Industry Volume K Tons Forecast, by Type 2019 & 2032
- Table 63: Global Aprotic Solvents Industry Revenue Billion Forecast, by Application 2019 & 2032
- Table 64: Global Aprotic Solvents Industry Volume K Tons Forecast, by Application 2019 & 2032
- Table 65: Global Aprotic Solvents Industry Revenue Billion Forecast, by Country 2019 & 2032
- Table 66: Global Aprotic Solvents Industry Volume K Tons Forecast, by Country 2019 & 2032
- Table 67: China Aprotic Solvents Industry Revenue (Billion) Forecast, by Application 2019 & 2032
- Table 68: China Aprotic Solvents Industry Volume (K Tons) Forecast, by Application 2019 & 2032
- Table 69: India Aprotic Solvents Industry Revenue (Billion) Forecast, by Application 2019 & 2032
- Table 70: India Aprotic Solvents Industry Volume (K Tons) Forecast, by Application 2019 & 2032
- Table 71: Japan Aprotic Solvents Industry Revenue (Billion) Forecast, by Application 2019 & 2032
- Table 72: Japan Aprotic Solvents Industry Volume (K Tons) Forecast, by Application 2019 & 2032
- Table 73: South Korea Aprotic Solvents Industry Revenue (Billion) Forecast, by Application 2019 & 2032
- Table 74: South Korea Aprotic Solvents Industry Volume (K Tons) Forecast, by Application 2019 & 2032
- Table 75: Rest of Asia Pacific Aprotic Solvents Industry Revenue (Billion) Forecast, by Application 2019 & 2032
- Table 76: Rest of Asia Pacific Aprotic Solvents Industry Volume (K Tons) Forecast, by Application 2019 & 2032
- Table 77: Global Aprotic Solvents Industry Revenue Billion Forecast, by Type 2019 & 2032
- Table 78: Global Aprotic Solvents Industry Volume K Tons Forecast, by Type 2019 & 2032
- Table 79: Global Aprotic Solvents Industry Revenue Billion Forecast, by Application 2019 & 2032
- Table 80: Global Aprotic Solvents Industry Volume K Tons Forecast, by Application 2019 & 2032
- Table 81: Global Aprotic Solvents Industry Revenue Billion Forecast, by Country 2019 & 2032
- Table 82: Global Aprotic Solvents Industry Volume K Tons Forecast, by Country 2019 & 2032
- Table 83: United States Aprotic Solvents Industry Revenue (Billion) Forecast, by Application 2019 & 2032
- Table 84: United States Aprotic Solvents Industry Volume (K Tons) Forecast, by Application 2019 & 2032
- Table 85: Canada Aprotic Solvents Industry Revenue (Billion) Forecast, by Application 2019 & 2032
- Table 86: Canada Aprotic Solvents Industry Volume (K Tons) Forecast, by Application 2019 & 2032
- Table 87: Mexico Aprotic Solvents Industry Revenue (Billion) Forecast, by Application 2019 & 2032
- Table 88: Mexico Aprotic Solvents Industry Volume (K Tons) Forecast, by Application 2019 & 2032
- Table 89: Global Aprotic Solvents Industry Revenue Billion Forecast, by Type 2019 & 2032
- Table 90: Global Aprotic Solvents Industry Volume K Tons Forecast, by Type 2019 & 2032
- Table 91: Global Aprotic Solvents Industry Revenue Billion Forecast, by Application 2019 & 2032
- Table 92: Global Aprotic Solvents Industry Volume K Tons Forecast, by Application 2019 & 2032
- Table 93: Global Aprotic Solvents Industry Revenue Billion Forecast, by Country 2019 & 2032
- Table 94: Global Aprotic Solvents Industry Volume K Tons Forecast, by Country 2019 & 2032
- Table 95: Germany Aprotic Solvents Industry Revenue (Billion) Forecast, by Application 2019 & 2032
- Table 96: Germany Aprotic Solvents Industry Volume (K Tons) Forecast, by Application 2019 & 2032
- Table 97: United Kingdom Aprotic Solvents Industry Revenue (Billion) Forecast, by Application 2019 & 2032
- Table 98: United Kingdom Aprotic Solvents Industry Volume (K Tons) Forecast, by Application 2019 & 2032
- Table 99: France Aprotic Solvents Industry Revenue (Billion) Forecast, by Application 2019 & 2032
- Table 100: France Aprotic Solvents Industry Volume (K Tons) Forecast, by Application 2019 & 2032
- Table 101: Italy Aprotic Solvents Industry Revenue (Billion) Forecast, by Application 2019 & 2032
- Table 102: Italy Aprotic Solvents Industry Volume (K Tons) Forecast, by Application 2019 & 2032
- Table 103: Rest of Europe Aprotic Solvents Industry Revenue (Billion) Forecast, by Application 2019 & 2032
- Table 104: Rest of Europe Aprotic Solvents Industry Volume (K Tons) Forecast, by Application 2019 & 2032
- Table 105: Global Aprotic Solvents Industry Revenue Billion Forecast, by Type 2019 & 2032
- Table 106: Global Aprotic Solvents Industry Volume K Tons Forecast, by Type 2019 & 2032
- Table 107: Global Aprotic Solvents Industry Revenue Billion Forecast, by Application 2019 & 2032
- Table 108: Global Aprotic Solvents Industry Volume K Tons Forecast, by Application 2019 & 2032
- Table 109: Global Aprotic Solvents Industry Revenue Billion Forecast, by Country 2019 & 2032
- Table 110: Global Aprotic Solvents Industry Volume K Tons Forecast, by Country 2019 & 2032
- Table 111: Brazil Aprotic Solvents Industry Revenue (Billion) Forecast, by Application 2019 & 2032
- Table 112: Brazil Aprotic Solvents Industry Volume (K Tons) Forecast, by Application 2019 & 2032
- Table 113: Argentina Aprotic Solvents Industry Revenue (Billion) Forecast, by Application 2019 & 2032
- Table 114: Argentina Aprotic Solvents Industry Volume (K Tons) Forecast, by Application 2019 & 2032
- Table 115: Rest of South America Aprotic Solvents Industry Revenue (Billion) Forecast, by Application 2019 & 2032
- Table 116: Rest of South America Aprotic Solvents Industry Volume (K Tons) Forecast, by Application 2019 & 2032
- Table 117: Global Aprotic Solvents Industry Revenue Billion Forecast, by Type 2019 & 2032
- Table 118: Global Aprotic Solvents Industry Volume K Tons Forecast, by Type 2019 & 2032
- Table 119: Global Aprotic Solvents Industry Revenue Billion Forecast, by Application 2019 & 2032
- Table 120: Global Aprotic Solvents Industry Volume K Tons Forecast, by Application 2019 & 2032
- Table 121: Global Aprotic Solvents Industry Revenue Billion Forecast, by Country 2019 & 2032
- Table 122: Global Aprotic Solvents Industry Volume K Tons Forecast, by Country 2019 & 2032
- Table 123: Saudi Arabia Aprotic Solvents Industry Revenue (Billion) Forecast, by Application 2019 & 2032
- Table 124: Saudi Arabia Aprotic Solvents Industry Volume (K Tons) Forecast, by Application 2019 & 2032
- Table 125: South Africa Aprotic Solvents Industry Revenue (Billion) Forecast, by Application 2019 & 2032
- Table 126: South Africa Aprotic Solvents Industry Volume (K Tons) Forecast, by Application 2019 & 2032
- Table 127: Rest of Middle East and Africa Aprotic Solvents Industry Revenue (Billion) Forecast, by Application 2019 & 2032
- Table 128: Rest of Middle East and Africa Aprotic Solvents Industry Volume (K Tons) Forecast, by Application 2019 & 2032
Frequently Asked Questions
1. What is the projected Compound Annual Growth Rate (CAGR) of the Aprotic Solvents Industry?
The projected CAGR is approximately 3.06%.
2. Which companies are prominent players in the Aprotic Solvents Industry?
Key companies in the market include INEOS, Mitsui Chemicals Inc , Gaylord Chemical Company LLC, AlzChem Group AG, Ashland, BASF SE, Dow, Eastman Chemical Company.
3. What are the main segments of the Aprotic Solvents Industry?
The market segments include Type, Application.
4. Can you provide details about the market size?
The market size is estimated to be USD 17.49 Billion as of 2022.
5. What are some drivers contributing to market growth?
; Growing Demand from Oil and Gas Industry; Increasing Consumption in Pharmaceutical Sector.
6. What are the notable trends driving market growth?
Application in the Oil and Gas Sector to Dominate the Market.
7. Are there any restraints impacting market growth?
; Non-Toxic Substitutes; Envrionmental Concerns; Unfavorable Conditions Arising Due to COVID-19 Outbreak.
8. Can you provide examples of recent developments in the market?
N/A
9. What pricing options are available for accessing the report?
Pricing options include single-user, multi-user, and enterprise licenses priced at USD 4750, USD 5250, and USD 8750 respectively.
10. Is the market size provided in terms of value or volume?
The market size is provided in terms of value, measured in Billion and volume, measured in K Tons.
11. Are there any specific market keywords associated with the report?
Yes, the market keyword associated with the report is "Aprotic Solvents Industry," which aids in identifying and referencing the specific market segment covered.
12. How do I determine which pricing option suits my needs best?
The pricing options vary based on user requirements and access needs. Individual users may opt for single-user licenses, while businesses requiring broader access may choose multi-user or enterprise licenses for cost-effective access to the report.
13. Are there any additional resources or data provided in the Aprotic Solvents Industry report?
While the report offers comprehensive insights, it's advisable to review the specific contents or supplementary materials provided to ascertain if additional resources or data are available.
14. How can I stay updated on further developments or reports in the Aprotic Solvents Industry?
To stay informed about further developments, trends, and reports in the Aprotic Solvents Industry, consider subscribing to industry newsletters, following relevant companies and organizations, or regularly checking reputable industry news sources and publications.
Methodology
Step 1 - Identification of Relevant Samples Size from Population Database


Step 2 - Approaches for Defining Global Market Size (Value, Volume* & Price*)

Note*: In applicable scenarios
Step 3 - Data Sources
Primary Research
- Web Analytics
- Survey Reports
- Research Institute
- Latest Research Reports
- Opinion Leaders
Secondary Research
- Annual Reports
- White Paper
- Latest Press Release
- Industry Association
- Paid Database
- Investor Presentations

Step 4 - Data Triangulation
Involves using different sources of information in order to increase the validity of a study
These sources are likely to be stakeholders in a program - participants, other researchers, program staff, other community members, and so on.
Then we put all data in single framework & apply various statistical tools to find out the dynamic on the market.
During the analysis stage, feedback from the stakeholder groups would be compared to determine areas of agreement as well as areas of divergence
