

Key Insights
The naphthalene derivatives market, valued at approximately $XX million in 2025, exhibits robust growth potential, projected to expand at a compound annual growth rate (CAGR) exceeding 3.00% from 2025 to 2033. This growth is fueled by increasing demand from key sectors like plastics, dyes, and pharmaceuticals, where naphthalene derivatives serve as crucial intermediates and additives. The rising global population and expanding industrial activities further contribute to the market's expansion. Specific drivers include the growing demand for high-performance polymers in diverse applications, such as automotive parts and electronics, coupled with ongoing innovation in material science leading to the development of novel naphthalene-based products with enhanced properties. However, stringent environmental regulations regarding the handling and disposal of naphthalene-based chemicals pose a significant restraint to market growth, necessitating the adoption of sustainable production practices and waste management solutions by market players. Furthermore, fluctuations in raw material prices and the emergence of substitute materials can impact market dynamics. The market is segmented by type (e.g., phthalic anhydride, naphthol, naphthylamine), application (e.g., plastics, dyes, pharmaceuticals), and geography. Major players like Biosynth Carbosynth, Huntsman International LLC, and Koppers Inc. compete in this market, leveraging their technological expertise and established distribution networks to maintain a significant market share.
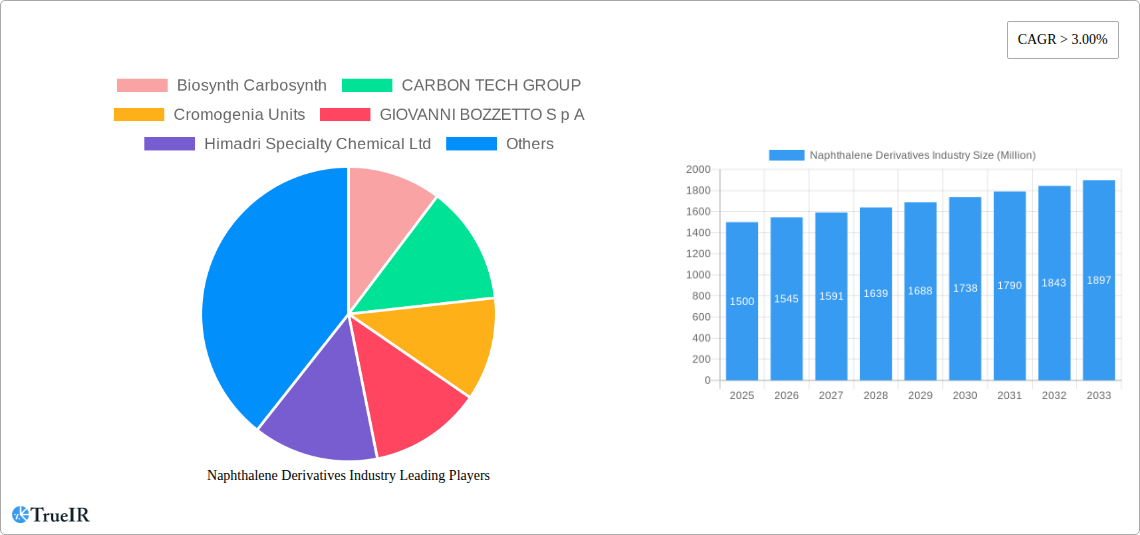
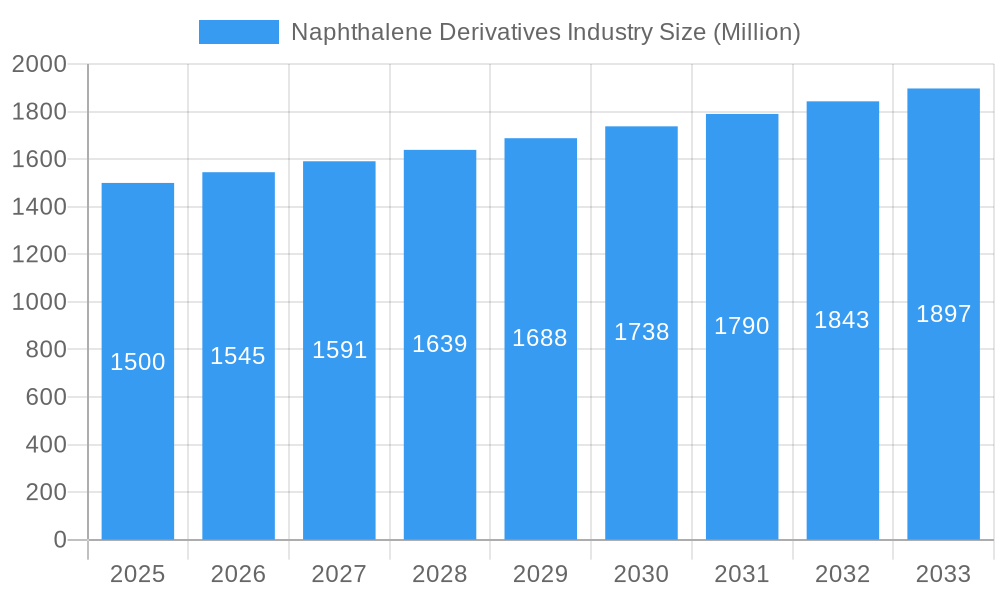
Naphthalene Derivatives Industry Market Size (In Billion)
The forecast period from 2025 to 2033 anticipates continued growth, driven by the predicted increase in the consumption of naphthalene derivatives across various sectors. Specific application segments, such as high-performance plastics and specialized pharmaceuticals, are expected to showcase higher growth rates compared to others. Regional market variations will likely persist, with developed economies in North America and Europe maintaining relatively larger market shares owing to well-established industries. However, the burgeoning industrialization in emerging economies in Asia-Pacific and the Middle East is predicted to drive significant market expansion in these regions over the forecast period. Companies will need to focus on efficient production methods, sustainable practices, and strategic partnerships to maintain profitability in a competitive and increasingly regulated market landscape. Innovation in product development and diversification into high-value applications will be critical for success.
Naphthalene Derivatives Industry Company Market Share
Dynamic Naphthalene Derivatives Industry Market Report: 2019-2033
This comprehensive report provides an in-depth analysis of the Naphthalene Derivatives industry, offering invaluable insights for stakeholders seeking to navigate this dynamic market. Covering the period 2019-2033, with a base year of 2025 and a forecast period of 2025-2033, this report leverages extensive data analysis and expert insights to deliver actionable intelligence. The global market size is projected to reach xx Million by 2033, exhibiting a CAGR of xx% during the forecast period.
Naphthalene Derivatives Industry Market Structure & Competitive Landscape
The Naphthalene Derivatives market exhibits a moderately concentrated structure, with several key players holding significant market share. The Herfindahl-Hirschman Index (HHI) is estimated at xx in 2025, indicating a competitive yet consolidated landscape. Innovation drives competition, primarily focusing on enhancing product efficiency, expanding application areas, and developing sustainable production methods. Stringent environmental regulations significantly impact production processes and necessitate investments in cleaner technologies. Product substitutes, such as alternative aromatic compounds, pose a moderate competitive threat, while end-user segmentation spans various industries, including plastics, dyes, and pharmaceuticals. M&A activity has been relatively stable in recent years, with approximately xx Million in deal value recorded between 2019 and 2024.
- Market Concentration: Moderately concentrated, HHI of xx (2025).
- Innovation Drivers: Enhanced efficiency, new applications, sustainable production.
- Regulatory Impacts: Stringent environmental regulations drive cleaner technologies.
- Product Substitutes: Alternative aromatic compounds pose a moderate threat.
- End-User Segmentation: Plastics, dyes, pharmaceuticals, and others.
- M&A Trends: Approximately xx Million in deal value (2019-2024).
Naphthalene Derivatives Industry Market Trends & Opportunities
The Naphthalene Derivatives market is experiencing steady growth, driven by increasing demand from key end-use sectors. The market size reached xx Million in 2024 and is projected to reach xx Million by 2033. Technological advancements, particularly in catalysis and process optimization, are enhancing production efficiency and reducing costs. Consumer preferences are shifting towards sustainable and environmentally friendly products, prompting manufacturers to adopt greener production methods. Competitive dynamics are characterized by ongoing innovation and strategic partnerships. Market penetration rates vary across different segments and geographic regions, with higher penetration observed in established markets. The CAGR for the forecast period is estimated at xx%. The growth is primarily fuelled by the increasing demand for plastics and other downstream products.
Dominant Markets & Segments in Naphthalene Derivatives Industry
The Asia-Pacific region dominates the Naphthalene Derivatives market, accounting for approximately xx% of the global market share in 2025. China and India are the key growth drivers within this region, fueled by robust economic expansion, increasing industrialization, and expanding downstream industries.
- Key Growth Drivers in Asia-Pacific:
- Rapid industrialization and infrastructure development.
- Growing demand from the plastics and textile sectors.
- Favorable government policies supporting chemical manufacturing.
- Increasing consumer spending.
Europe and North America hold significant market shares, although growth rates are comparatively slower. The dominance of the Asia-Pacific region is largely attributable to its burgeoning manufacturing sector and substantial demand from various end-use applications.
Naphthalene Derivatives Industry Product Analysis
Naphthalene derivatives encompass a wide range of products with diverse applications. Recent innovations focus on developing high-performance derivatives with enhanced properties such as improved thermal stability and enhanced reactivity. This drives advancements in various applications, including high-performance polymers, specialty chemicals, and advanced materials. The competitive advantage lies in developing specialized products tailored to specific end-user needs and offering superior performance characteristics compared to existing solutions.
Key Drivers, Barriers & Challenges in Naphthalene Derivatives Industry
Key Drivers: Growing demand from downstream industries (plastics, dyes, pharmaceuticals), technological advancements leading to improved efficiency and cost reduction, and government support for chemical manufacturing in key regions.
Key Challenges: Stringent environmental regulations necessitate significant investments in cleaner production technologies. Fluctuations in raw material prices (naphthalene) can impact profitability. Intense competition requires continuous innovation and cost optimization. Supply chain disruptions, particularly during global events, can significantly affect production and delivery.
Growth Drivers in the Naphthalene Derivatives Industry Market
The Naphthalene Derivatives market is primarily driven by robust demand from downstream industries such as plastics, dyes, and pharmaceuticals. Technological advancements, leading to improved efficiency and cost reduction, further propel market expansion. Favorable government policies supporting chemical manufacturing in several key regions also contribute significantly to the market's growth trajectory.
Challenges Impacting Naphthalene Derivatives Industry Growth
Stringent environmental regulations, coupled with fluctuating raw material prices, pose significant challenges. Supply chain vulnerabilities and intense competition necessitate continuous innovation and cost optimization to ensure long-term profitability and sustainability.
Key Players Shaping the Naphthalene Derivatives Industry Market
- Biosynth Carbosynth
- CARBON TECH GROUP
- Cromogenia Units
- GIOVANNI BOZZETTO S p A
- Himadri Specialty Chemical Ltd
- Huntsman International LLC
- JFE Chemical Corporation
- King Industries Inc
- Koppers Inc
- Rain Carbon Inc
- *List Not Exhaustive
Significant Naphthalene Derivatives Industry Milestones
- 2021: Introduction of a new, more sustainable production process by Huntsman International LLC.
- 2022: Acquisition of a smaller Naphthalene Derivatives producer by Koppers Inc, expanding their market share.
- 2023: Launch of a new high-performance Naphthalene derivative by Biosynth Carbosynth. (Specific details would be inserted here in the full report.)
- 2024: Implementation of stricter environmental regulations in several key regions.
Future Outlook for Naphthalene Derivatives Industry Market
The Naphthalene Derivatives market is poised for continued growth, driven by sustained demand from various end-use sectors and ongoing innovation. Strategic investments in R&D, the development of sustainable production methods, and expansion into new emerging markets present significant opportunities. The market’s future outlook is positive, with considerable potential for expansion and increased market penetration.
Naphthalene Derivatives Industry Segmentation
-
1. Form
- 1.1. Powder
- 1.2. Liquid
-
2. Source
- 2.1. Coal-Tar
- 2.2. Petroleum Based
- 2.3. Others
-
3. Derivative
- 3.1. Sulphonated Naphthalene Formaldehyde (SNF)
- 3.2. Phthalic Anhydride
- 3.3. Naphthalene Sulphonic Acid
- 3.4. Naphthols
- 3.5. Alkyl Naphthalene Sulphonate Salts
- 3.6. Others
-
4. End-User Industry
- 4.1. Paints and Coatings
- 4.2. Construction
- 4.3. Textile
- 4.4. Pulp and Paper
- 4.5. Oil and Gas
- 4.6. Pharmaceutical
- 4.7. Others
Naphthalene Derivatives Industry Segmentation By Geography
-
1. Asia Pacific
- 1.1. China
- 1.2. India
- 1.3. Japan
- 1.4. South Korea
- 1.5. Rest of Asia Pacific
-
2. North America
- 2.1. United States
- 2.2. Canada
- 2.3. Mexico
-
3. Europe
- 3.1. Germany
- 3.2. United Kingdom
- 3.3. France
- 3.4. Italy
- 3.5. Rest of Europe
-
4. South America
- 4.1. Brazil
- 4.2. Argentina
- 4.3. Rest of South America
-
5. Middle East and Africa
- 5.1. Saudi Arabia
- 5.2. South Africa
- 5.3. Rest of Middle East and Africa

Naphthalene Derivatives Industry Regional Market Share
Geographic Coverage of Naphthalene Derivatives Industry
Naphthalene Derivatives Industry REPORT HIGHLIGHTS
| Aspects | Details |
|---|---|
| Study Period | 2020-2034 |
| Base Year | 2025 |
| Estimated Year | 2026 |
| Forecast Period | 2026-2034 |
| Historical Period | 2020-2025 |
| Growth Rate | CAGR of > 3.00% from 2020-2034 |
| Segmentation |
|
Table of Contents
- 1. Introduction
- 1.1. Research Scope
- 1.2. Market Segmentation
- 1.3. Research Objective
- 1.4. Definitions and Assumptions
- 2. Executive Summary
- 2.1. Market Snapshot
- 3. Market Dynamics
- 3.1. Market Drivers
- 3.2. Market Restrains
- 3.3. Market Trends
- 3.4. Market Opportunities
- 4. Market Factor Analysis
- 4.1. Porters Five Forces
- 4.1.1. Bargaining Power of Suppliers
- 4.1.2. Bargaining Power of Buyers
- 4.1.3. Threat of New Entrants
- 4.1.4. Threat of Substitutes
- 4.1.5. Competitive Rivalry
- 4.2. PESTEL analysis
- 4.3. BCG Analysis
- 4.3.1. Stars (High Growth, High Market Share)
- 4.3.2. Cash Cows (Low Growth, High Market Share)
- 4.3.3. Question Mark (High Growth, Low Market Share)
- 4.3.4. Dogs (Low Growth, Low Market Share)
- 4.4. Ansoff Matrix Analysis
- 4.5. Supply Chain Analysis
- 4.6. Regulatory Landscape
- 4.7. Current Market Potential and Opportunity Assessment (TAM–SAM–SOM Framework)
- 4.8. TIR Analyst Note
- 4.1. Porters Five Forces
- 5. Market Analysis, Insights and Forecast 2021-2033
- 5.1. Market Analysis, Insights and Forecast - by Form
- 5.1.1. Powder
- 5.1.2. Liquid
- 5.2. Market Analysis, Insights and Forecast - by Source
- 5.2.1. Coal-Tar
- 5.2.2. Petroleum Based
- 5.2.3. Others
- 5.3. Market Analysis, Insights and Forecast - by Derivative
- 5.3.1. Sulphonated Naphthalene Formaldehyde (SNF)
- 5.3.2. Phthalic Anhydride
- 5.3.3. Naphthalene Sulphonic Acid
- 5.3.4. Naphthols
- 5.3.5. Alkyl Naphthalene Sulphonate Salts
- 5.3.6. Others
- 5.4. Market Analysis, Insights and Forecast - by End-User Industry
- 5.4.1. Paints and Coatings
- 5.4.2. Construction
- 5.4.3. Textile
- 5.4.4. Pulp and Paper
- 5.4.5. Oil and Gas
- 5.4.6. Pharmaceutical
- 5.4.7. Others
- 5.5. Market Analysis, Insights and Forecast - by Region
- 5.5.1. Asia Pacific
- 5.5.2. North America
- 5.5.3. Europe
- 5.5.4. South America
- 5.5.5. Middle East and Africa
- 5.1. Market Analysis, Insights and Forecast - by Form
- 6. Global Naphthalene Derivatives Industry Analysis, Insights and Forecast, 2021-2033
- 6.1. Market Analysis, Insights and Forecast - by Form
- 6.1.1. Powder
- 6.1.2. Liquid
- 6.2. Market Analysis, Insights and Forecast - by Source
- 6.2.1. Coal-Tar
- 6.2.2. Petroleum Based
- 6.2.3. Others
- 6.3. Market Analysis, Insights and Forecast - by Derivative
- 6.3.1. Sulphonated Naphthalene Formaldehyde (SNF)
- 6.3.2. Phthalic Anhydride
- 6.3.3. Naphthalene Sulphonic Acid
- 6.3.4. Naphthols
- 6.3.5. Alkyl Naphthalene Sulphonate Salts
- 6.3.6. Others
- 6.4. Market Analysis, Insights and Forecast - by End-User Industry
- 6.4.1. Paints and Coatings
- 6.4.2. Construction
- 6.4.3. Textile
- 6.4.4. Pulp and Paper
- 6.4.5. Oil and Gas
- 6.4.6. Pharmaceutical
- 6.4.7. Others
- 6.1. Market Analysis, Insights and Forecast - by Form
- 7. Asia Pacific Naphthalene Derivatives Industry Analysis, Insights and Forecast, 2020-2032
- 7.1. Market Analysis, Insights and Forecast - by Form
- 7.1.1. Powder
- 7.1.2. Liquid
- 7.2. Market Analysis, Insights and Forecast - by Source
- 7.2.1. Coal-Tar
- 7.2.2. Petroleum Based
- 7.2.3. Others
- 7.3. Market Analysis, Insights and Forecast - by Derivative
- 7.3.1. Sulphonated Naphthalene Formaldehyde (SNF)
- 7.3.2. Phthalic Anhydride
- 7.3.3. Naphthalene Sulphonic Acid
- 7.3.4. Naphthols
- 7.3.5. Alkyl Naphthalene Sulphonate Salts
- 7.3.6. Others
- 7.4. Market Analysis, Insights and Forecast - by End-User Industry
- 7.4.1. Paints and Coatings
- 7.4.2. Construction
- 7.4.3. Textile
- 7.4.4. Pulp and Paper
- 7.4.5. Oil and Gas
- 7.4.6. Pharmaceutical
- 7.4.7. Others
- 7.1. Market Analysis, Insights and Forecast - by Form
- 8. North America Naphthalene Derivatives Industry Analysis, Insights and Forecast, 2020-2032
- 8.1. Market Analysis, Insights and Forecast - by Form
- 8.1.1. Powder
- 8.1.2. Liquid
- 8.2. Market Analysis, Insights and Forecast - by Source
- 8.2.1. Coal-Tar
- 8.2.2. Petroleum Based
- 8.2.3. Others
- 8.3. Market Analysis, Insights and Forecast - by Derivative
- 8.3.1. Sulphonated Naphthalene Formaldehyde (SNF)
- 8.3.2. Phthalic Anhydride
- 8.3.3. Naphthalene Sulphonic Acid
- 8.3.4. Naphthols
- 8.3.5. Alkyl Naphthalene Sulphonate Salts
- 8.3.6. Others
- 8.4. Market Analysis, Insights and Forecast - by End-User Industry
- 8.4.1. Paints and Coatings
- 8.4.2. Construction
- 8.4.3. Textile
- 8.4.4. Pulp and Paper
- 8.4.5. Oil and Gas
- 8.4.6. Pharmaceutical
- 8.4.7. Others
- 8.1. Market Analysis, Insights and Forecast - by Form
- 9. Europe Naphthalene Derivatives Industry Analysis, Insights and Forecast, 2020-2032
- 9.1. Market Analysis, Insights and Forecast - by Form
- 9.1.1. Powder
- 9.1.2. Liquid
- 9.2. Market Analysis, Insights and Forecast - by Source
- 9.2.1. Coal-Tar
- 9.2.2. Petroleum Based
- 9.2.3. Others
- 9.3. Market Analysis, Insights and Forecast - by Derivative
- 9.3.1. Sulphonated Naphthalene Formaldehyde (SNF)
- 9.3.2. Phthalic Anhydride
- 9.3.3. Naphthalene Sulphonic Acid
- 9.3.4. Naphthols
- 9.3.5. Alkyl Naphthalene Sulphonate Salts
- 9.3.6. Others
- 9.4. Market Analysis, Insights and Forecast - by End-User Industry
- 9.4.1. Paints and Coatings
- 9.4.2. Construction
- 9.4.3. Textile
- 9.4.4. Pulp and Paper
- 9.4.5. Oil and Gas
- 9.4.6. Pharmaceutical
- 9.4.7. Others
- 9.1. Market Analysis, Insights and Forecast - by Form
- 10. South America Naphthalene Derivatives Industry Analysis, Insights and Forecast, 2020-2032
- 10.1. Market Analysis, Insights and Forecast - by Form
- 10.1.1. Powder
- 10.1.2. Liquid
- 10.2. Market Analysis, Insights and Forecast - by Source
- 10.2.1. Coal-Tar
- 10.2.2. Petroleum Based
- 10.2.3. Others
- 10.3. Market Analysis, Insights and Forecast - by Derivative
- 10.3.1. Sulphonated Naphthalene Formaldehyde (SNF)
- 10.3.2. Phthalic Anhydride
- 10.3.3. Naphthalene Sulphonic Acid
- 10.3.4. Naphthols
- 10.3.5. Alkyl Naphthalene Sulphonate Salts
- 10.3.6. Others
- 10.4. Market Analysis, Insights and Forecast - by End-User Industry
- 10.4.1. Paints and Coatings
- 10.4.2. Construction
- 10.4.3. Textile
- 10.4.4. Pulp and Paper
- 10.4.5. Oil and Gas
- 10.4.6. Pharmaceutical
- 10.4.7. Others
- 10.1. Market Analysis, Insights and Forecast - by Form
- 11. Middle East and Africa Naphthalene Derivatives Industry Analysis, Insights and Forecast, 2020-2032
- 11.1. Market Analysis, Insights and Forecast - by Form
- 11.1.1. Powder
- 11.1.2. Liquid
- 11.2. Market Analysis, Insights and Forecast - by Source
- 11.2.1. Coal-Tar
- 11.2.2. Petroleum Based
- 11.2.3. Others
- 11.3. Market Analysis, Insights and Forecast - by Derivative
- 11.3.1. Sulphonated Naphthalene Formaldehyde (SNF)
- 11.3.2. Phthalic Anhydride
- 11.3.3. Naphthalene Sulphonic Acid
- 11.3.4. Naphthols
- 11.3.5. Alkyl Naphthalene Sulphonate Salts
- 11.3.6. Others
- 11.4. Market Analysis, Insights and Forecast - by End-User Industry
- 11.4.1. Paints and Coatings
- 11.4.2. Construction
- 11.4.3. Textile
- 11.4.4. Pulp and Paper
- 11.4.5. Oil and Gas
- 11.4.6. Pharmaceutical
- 11.4.7. Others
- 11.1. Market Analysis, Insights and Forecast - by Form
- 12. Competitive Analysis
- 12.1. Company Profiles
- 12.1.1 Biosynth Carbosynth
- 12.1.1.1. Company Overview
- 12.1.1.2. Products
- 12.1.1.3. Company Financials
- 12.1.1.4. SWOT Analysis
- 12.1.2 CARBON TECH GROUP
- 12.1.2.1. Company Overview
- 12.1.2.2. Products
- 12.1.2.3. Company Financials
- 12.1.2.4. SWOT Analysis
- 12.1.3 Cromogenia Units
- 12.1.3.1. Company Overview
- 12.1.3.2. Products
- 12.1.3.3. Company Financials
- 12.1.3.4. SWOT Analysis
- 12.1.4 GIOVANNI BOZZETTO S p A
- 12.1.4.1. Company Overview
- 12.1.4.2. Products
- 12.1.4.3. Company Financials
- 12.1.4.4. SWOT Analysis
- 12.1.5 Himadri Specialty Chemical Ltd
- 12.1.5.1. Company Overview
- 12.1.5.2. Products
- 12.1.5.3. Company Financials
- 12.1.5.4. SWOT Analysis
- 12.1.6 Huntsman International LLC
- 12.1.6.1. Company Overview
- 12.1.6.2. Products
- 12.1.6.3. Company Financials
- 12.1.6.4. SWOT Analysis
- 12.1.7 JFE Chemical Corporation
- 12.1.7.1. Company Overview
- 12.1.7.2. Products
- 12.1.7.3. Company Financials
- 12.1.7.4. SWOT Analysis
- 12.1.8 King Industries Inc
- 12.1.8.1. Company Overview
- 12.1.8.2. Products
- 12.1.8.3. Company Financials
- 12.1.8.4. SWOT Analysis
- 12.1.9 Koppers Inc
- 12.1.9.1. Company Overview
- 12.1.9.2. Products
- 12.1.9.3. Company Financials
- 12.1.9.4. SWOT Analysis
- 12.1.10 Rain Carbon Inc *List Not Exhaustive
- 12.1.10.1. Company Overview
- 12.1.10.2. Products
- 12.1.10.3. Company Financials
- 12.1.10.4. SWOT Analysis
- 12.1.1 Biosynth Carbosynth
- 12.2. Market Entropy
- 12.2.1 Company's Key Areas Served
- 12.2.2 Recent Developments
- 12.3. Company Market Share Analysis 2025
- 12.3.1 Top 5 Companies Market Share Analysis
- 12.3.2 Top 3 Companies Market Share Analysis
- 12.4. List of Potential Customers
- 13. Research Methodology
List of Figures
- Figure 1: Global Naphthalene Derivatives Industry Revenue Breakdown (Million, %) by Region 2025 & 2033
- Figure 2: Asia Pacific Naphthalene Derivatives Industry Revenue (Million), by Form 2025 & 2033
- Figure 3: Asia Pacific Naphthalene Derivatives Industry Revenue Share (%), by Form 2025 & 2033
- Figure 4: Asia Pacific Naphthalene Derivatives Industry Revenue (Million), by Source 2025 & 2033
- Figure 5: Asia Pacific Naphthalene Derivatives Industry Revenue Share (%), by Source 2025 & 2033
- Figure 6: Asia Pacific Naphthalene Derivatives Industry Revenue (Million), by Derivative 2025 & 2033
- Figure 7: Asia Pacific Naphthalene Derivatives Industry Revenue Share (%), by Derivative 2025 & 2033
- Figure 8: Asia Pacific Naphthalene Derivatives Industry Revenue (Million), by End-User Industry 2025 & 2033
- Figure 9: Asia Pacific Naphthalene Derivatives Industry Revenue Share (%), by End-User Industry 2025 & 2033
- Figure 10: Asia Pacific Naphthalene Derivatives Industry Revenue (Million), by Country 2025 & 2033
- Figure 11: Asia Pacific Naphthalene Derivatives Industry Revenue Share (%), by Country 2025 & 2033
- Figure 12: North America Naphthalene Derivatives Industry Revenue (Million), by Form 2025 & 2033
- Figure 13: North America Naphthalene Derivatives Industry Revenue Share (%), by Form 2025 & 2033
- Figure 14: North America Naphthalene Derivatives Industry Revenue (Million), by Source 2025 & 2033
- Figure 15: North America Naphthalene Derivatives Industry Revenue Share (%), by Source 2025 & 2033
- Figure 16: North America Naphthalene Derivatives Industry Revenue (Million), by Derivative 2025 & 2033
- Figure 17: North America Naphthalene Derivatives Industry Revenue Share (%), by Derivative 2025 & 2033
- Figure 18: North America Naphthalene Derivatives Industry Revenue (Million), by End-User Industry 2025 & 2033
- Figure 19: North America Naphthalene Derivatives Industry Revenue Share (%), by End-User Industry 2025 & 2033
- Figure 20: North America Naphthalene Derivatives Industry Revenue (Million), by Country 2025 & 2033
- Figure 21: North America Naphthalene Derivatives Industry Revenue Share (%), by Country 2025 & 2033
- Figure 22: Europe Naphthalene Derivatives Industry Revenue (Million), by Form 2025 & 2033
- Figure 23: Europe Naphthalene Derivatives Industry Revenue Share (%), by Form 2025 & 2033
- Figure 24: Europe Naphthalene Derivatives Industry Revenue (Million), by Source 2025 & 2033
- Figure 25: Europe Naphthalene Derivatives Industry Revenue Share (%), by Source 2025 & 2033
- Figure 26: Europe Naphthalene Derivatives Industry Revenue (Million), by Derivative 2025 & 2033
- Figure 27: Europe Naphthalene Derivatives Industry Revenue Share (%), by Derivative 2025 & 2033
- Figure 28: Europe Naphthalene Derivatives Industry Revenue (Million), by End-User Industry 2025 & 2033
- Figure 29: Europe Naphthalene Derivatives Industry Revenue Share (%), by End-User Industry 2025 & 2033
- Figure 30: Europe Naphthalene Derivatives Industry Revenue (Million), by Country 2025 & 2033
- Figure 31: Europe Naphthalene Derivatives Industry Revenue Share (%), by Country 2025 & 2033
- Figure 32: South America Naphthalene Derivatives Industry Revenue (Million), by Form 2025 & 2033
- Figure 33: South America Naphthalene Derivatives Industry Revenue Share (%), by Form 2025 & 2033
- Figure 34: South America Naphthalene Derivatives Industry Revenue (Million), by Source 2025 & 2033
- Figure 35: South America Naphthalene Derivatives Industry Revenue Share (%), by Source 2025 & 2033
- Figure 36: South America Naphthalene Derivatives Industry Revenue (Million), by Derivative 2025 & 2033
- Figure 37: South America Naphthalene Derivatives Industry Revenue Share (%), by Derivative 2025 & 2033
- Figure 38: South America Naphthalene Derivatives Industry Revenue (Million), by End-User Industry 2025 & 2033
- Figure 39: South America Naphthalene Derivatives Industry Revenue Share (%), by End-User Industry 2025 & 2033
- Figure 40: South America Naphthalene Derivatives Industry Revenue (Million), by Country 2025 & 2033
- Figure 41: South America Naphthalene Derivatives Industry Revenue Share (%), by Country 2025 & 2033
- Figure 42: Middle East and Africa Naphthalene Derivatives Industry Revenue (Million), by Form 2025 & 2033
- Figure 43: Middle East and Africa Naphthalene Derivatives Industry Revenue Share (%), by Form 2025 & 2033
- Figure 44: Middle East and Africa Naphthalene Derivatives Industry Revenue (Million), by Source 2025 & 2033
- Figure 45: Middle East and Africa Naphthalene Derivatives Industry Revenue Share (%), by Source 2025 & 2033
- Figure 46: Middle East and Africa Naphthalene Derivatives Industry Revenue (Million), by Derivative 2025 & 2033
- Figure 47: Middle East and Africa Naphthalene Derivatives Industry Revenue Share (%), by Derivative 2025 & 2033
- Figure 48: Middle East and Africa Naphthalene Derivatives Industry Revenue (Million), by End-User Industry 2025 & 2033
- Figure 49: Middle East and Africa Naphthalene Derivatives Industry Revenue Share (%), by End-User Industry 2025 & 2033
- Figure 50: Middle East and Africa Naphthalene Derivatives Industry Revenue (Million), by Country 2025 & 2033
- Figure 51: Middle East and Africa Naphthalene Derivatives Industry Revenue Share (%), by Country 2025 & 2033
List of Tables
- Table 1: Global Naphthalene Derivatives Industry Revenue Million Forecast, by Form 2020 & 2033
- Table 2: Global Naphthalene Derivatives Industry Revenue Million Forecast, by Source 2020 & 2033
- Table 3: Global Naphthalene Derivatives Industry Revenue Million Forecast, by Derivative 2020 & 2033
- Table 4: Global Naphthalene Derivatives Industry Revenue Million Forecast, by End-User Industry 2020 & 2033
- Table 5: Global Naphthalene Derivatives Industry Revenue Million Forecast, by Region 2020 & 2033
- Table 6: Global Naphthalene Derivatives Industry Revenue Million Forecast, by Form 2020 & 2033
- Table 7: Global Naphthalene Derivatives Industry Revenue Million Forecast, by Source 2020 & 2033
- Table 8: Global Naphthalene Derivatives Industry Revenue Million Forecast, by Derivative 2020 & 2033
- Table 9: Global Naphthalene Derivatives Industry Revenue Million Forecast, by End-User Industry 2020 & 2033
- Table 10: Global Naphthalene Derivatives Industry Revenue Million Forecast, by Country 2020 & 2033
- Table 11: China Naphthalene Derivatives Industry Revenue (Million) Forecast, by Application 2020 & 2033
- Table 12: India Naphthalene Derivatives Industry Revenue (Million) Forecast, by Application 2020 & 2033
- Table 13: Japan Naphthalene Derivatives Industry Revenue (Million) Forecast, by Application 2020 & 2033
- Table 14: South Korea Naphthalene Derivatives Industry Revenue (Million) Forecast, by Application 2020 & 2033
- Table 15: Rest of Asia Pacific Naphthalene Derivatives Industry Revenue (Million) Forecast, by Application 2020 & 2033
- Table 16: Global Naphthalene Derivatives Industry Revenue Million Forecast, by Form 2020 & 2033
- Table 17: Global Naphthalene Derivatives Industry Revenue Million Forecast, by Source 2020 & 2033
- Table 18: Global Naphthalene Derivatives Industry Revenue Million Forecast, by Derivative 2020 & 2033
- Table 19: Global Naphthalene Derivatives Industry Revenue Million Forecast, by End-User Industry 2020 & 2033
- Table 20: Global Naphthalene Derivatives Industry Revenue Million Forecast, by Country 2020 & 2033
- Table 21: United States Naphthalene Derivatives Industry Revenue (Million) Forecast, by Application 2020 & 2033
- Table 22: Canada Naphthalene Derivatives Industry Revenue (Million) Forecast, by Application 2020 & 2033
- Table 23: Mexico Naphthalene Derivatives Industry Revenue (Million) Forecast, by Application 2020 & 2033
- Table 24: Global Naphthalene Derivatives Industry Revenue Million Forecast, by Form 2020 & 2033
- Table 25: Global Naphthalene Derivatives Industry Revenue Million Forecast, by Source 2020 & 2033
- Table 26: Global Naphthalene Derivatives Industry Revenue Million Forecast, by Derivative 2020 & 2033
- Table 27: Global Naphthalene Derivatives Industry Revenue Million Forecast, by End-User Industry 2020 & 2033
- Table 28: Global Naphthalene Derivatives Industry Revenue Million Forecast, by Country 2020 & 2033
- Table 29: Germany Naphthalene Derivatives Industry Revenue (Million) Forecast, by Application 2020 & 2033
- Table 30: United Kingdom Naphthalene Derivatives Industry Revenue (Million) Forecast, by Application 2020 & 2033
- Table 31: France Naphthalene Derivatives Industry Revenue (Million) Forecast, by Application 2020 & 2033
- Table 32: Italy Naphthalene Derivatives Industry Revenue (Million) Forecast, by Application 2020 & 2033
- Table 33: Rest of Europe Naphthalene Derivatives Industry Revenue (Million) Forecast, by Application 2020 & 2033
- Table 34: Global Naphthalene Derivatives Industry Revenue Million Forecast, by Form 2020 & 2033
- Table 35: Global Naphthalene Derivatives Industry Revenue Million Forecast, by Source 2020 & 2033
- Table 36: Global Naphthalene Derivatives Industry Revenue Million Forecast, by Derivative 2020 & 2033
- Table 37: Global Naphthalene Derivatives Industry Revenue Million Forecast, by End-User Industry 2020 & 2033
- Table 38: Global Naphthalene Derivatives Industry Revenue Million Forecast, by Country 2020 & 2033
- Table 39: Brazil Naphthalene Derivatives Industry Revenue (Million) Forecast, by Application 2020 & 2033
- Table 40: Argentina Naphthalene Derivatives Industry Revenue (Million) Forecast, by Application 2020 & 2033
- Table 41: Rest of South America Naphthalene Derivatives Industry Revenue (Million) Forecast, by Application 2020 & 2033
- Table 42: Global Naphthalene Derivatives Industry Revenue Million Forecast, by Form 2020 & 2033
- Table 43: Global Naphthalene Derivatives Industry Revenue Million Forecast, by Source 2020 & 2033
- Table 44: Global Naphthalene Derivatives Industry Revenue Million Forecast, by Derivative 2020 & 2033
- Table 45: Global Naphthalene Derivatives Industry Revenue Million Forecast, by End-User Industry 2020 & 2033
- Table 46: Global Naphthalene Derivatives Industry Revenue Million Forecast, by Country 2020 & 2033
- Table 47: Saudi Arabia Naphthalene Derivatives Industry Revenue (Million) Forecast, by Application 2020 & 2033
- Table 48: South Africa Naphthalene Derivatives Industry Revenue (Million) Forecast, by Application 2020 & 2033
- Table 49: Rest of Middle East and Africa Naphthalene Derivatives Industry Revenue (Million) Forecast, by Application 2020 & 2033
Frequently Asked Questions
1. What is the projected Compound Annual Growth Rate (CAGR) of the Naphthalene Derivatives Industry?
The projected CAGR is approximately > 3.00%.
2. Which companies are prominent players in the Naphthalene Derivatives Industry?
Key companies in the market include Biosynth Carbosynth, CARBON TECH GROUP, Cromogenia Units, GIOVANNI BOZZETTO S p A, Himadri Specialty Chemical Ltd, Huntsman International LLC, JFE Chemical Corporation, King Industries Inc, Koppers Inc, Rain Carbon Inc *List Not Exhaustive.
3. What are the main segments of the Naphthalene Derivatives Industry?
The market segments include Form, Source, Derivative, End-User Industry.
4. Can you provide details about the market size?
The market size is estimated to be USD XX Million as of 2022.
5. What are some drivers contributing to market growth?
; Growing Construction Industry; Rising Application in Textile Sector.
6. What are the notable trends driving market growth?
Construction Industry to Dominate the Market.
7. Are there any restraints impacting market growth?
; Growing Construction Industry; Rising Application in Textile Sector.
8. Can you provide examples of recent developments in the market?
N/A
9. What pricing options are available for accessing the report?
Pricing options include single-user, multi-user, and enterprise licenses priced at USD 4750, USD 5250, and USD 8750 respectively.
10. Is the market size provided in terms of value or volume?
The market size is provided in terms of value, measured in Million.
11. Are there any specific market keywords associated with the report?
Yes, the market keyword associated with the report is "Naphthalene Derivatives Industry," which aids in identifying and referencing the specific market segment covered.
12. How do I determine which pricing option suits my needs best?
The pricing options vary based on user requirements and access needs. Individual users may opt for single-user licenses, while businesses requiring broader access may choose multi-user or enterprise licenses for cost-effective access to the report.
13. Are there any additional resources or data provided in the Naphthalene Derivatives Industry report?
While the report offers comprehensive insights, it's advisable to review the specific contents or supplementary materials provided to ascertain if additional resources or data are available.
14. How can I stay updated on further developments or reports in the Naphthalene Derivatives Industry?
To stay informed about further developments, trends, and reports in the Naphthalene Derivatives Industry, consider subscribing to industry newsletters, following relevant companies and organizations, or regularly checking reputable industry news sources and publications.
Methodology
Step 1 - Identification of Relevant Samples Size from Population Database


Step 2 - Approaches for Defining Global Market Size (Value, Volume* & Price*)

Note*: In applicable scenarios
Step 3 - Data Sources
Primary Research
- Web Analytics
- Survey Reports
- Research Institute
- Latest Research Reports
- Opinion Leaders
Secondary Research
- Annual Reports
- White Paper
- Latest Press Release
- Industry Association
- Paid Database
- Investor Presentations

Step 4 - Data Triangulation
Involves using different sources of information in order to increase the validity of a study
These sources are likely to be stakeholders in a program - participants, other researchers, program staff, other community members, and so on.
Then we put all data in single framework & apply various statistical tools to find out the dynamic on the market.
During the analysis stage, feedback from the stakeholder groups would be compared to determine areas of agreement as well as areas of divergence