

Key Insights
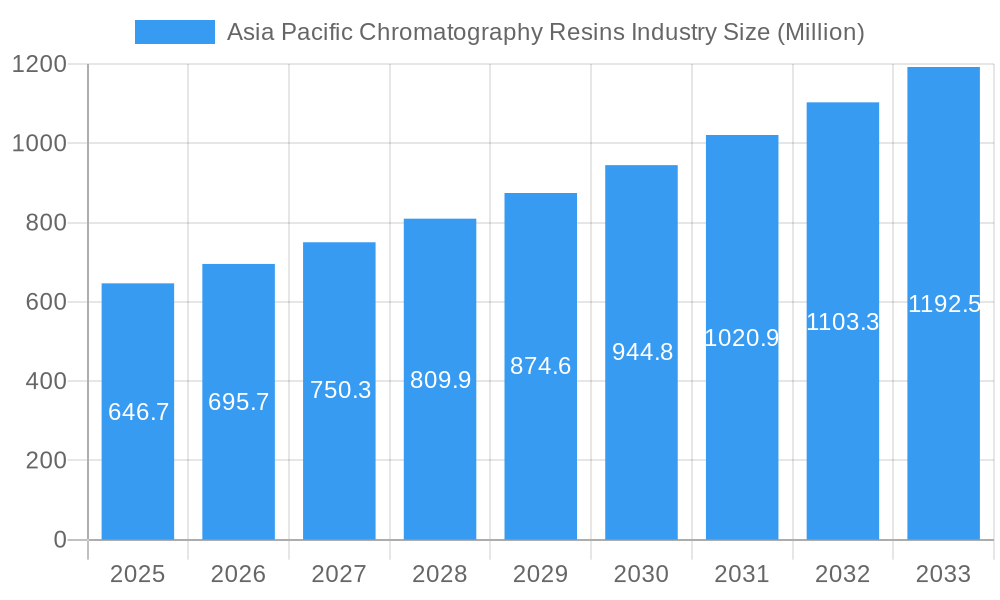
The Asia Pacific chromatography resins market, valued at $646.7 million in 2025, is projected to experience robust growth, exceeding a 7% CAGR through 2033. This expansion is fueled by several key factors. Firstly, the burgeoning pharmaceutical and biotechnology sectors in countries like China, India, and Japan are driving significant demand for high-quality chromatography resins used in drug discovery, development, and manufacturing. Increased investments in research and development within these industries are further stimulating market growth. Secondly, the growing awareness of food safety and quality is boosting the adoption of chromatography resins in food and beverage testing and quality control. Stringent regulatory frameworks for food safety across the region are also contributing to this demand. Finally, advancements in chromatography resin technology, including the development of more efficient and selective resins, are enhancing separation capabilities and driving market adoption. The dominance of natural-based origins in the market currently hints at a potential future shift towards synthetic-based options as the technology continues to mature and cost-effectiveness improves. The segment breakdown showcases the pharmaceutical sector as a major driver, with significant contributions expected from water and environmental agencies in the coming years.
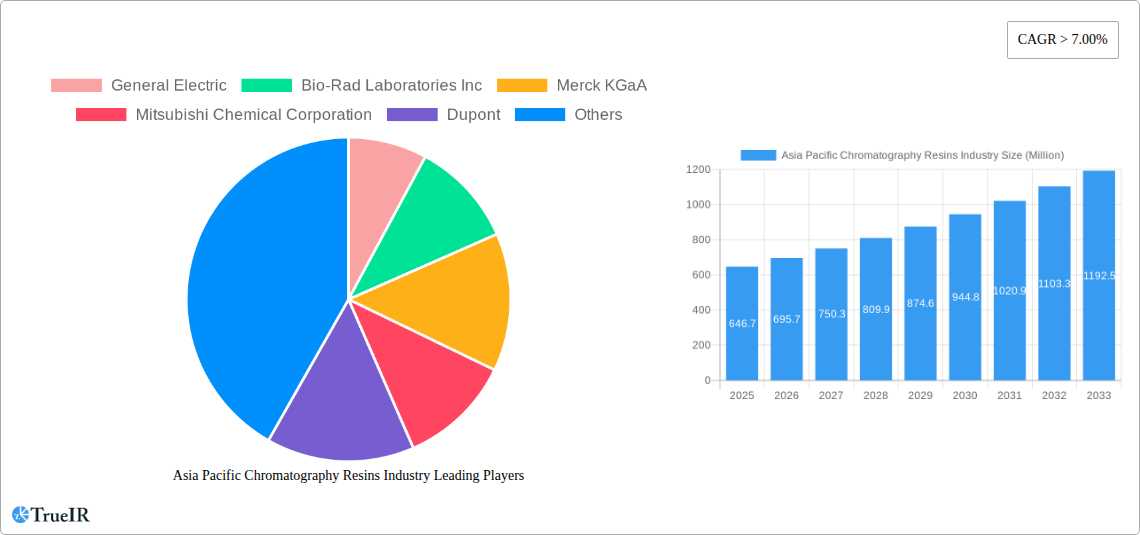
Asia Pacific Chromatography Resins Industry Market Size (In Million)
The competitive landscape is characterized by both established global players like General Electric, Merck KGaA, and Thermo Fisher Scientific, and regional manufacturers. Competition is likely to intensify with further technological advancements and increasing market penetration. While the Asia Pacific region is currently a major contributor to overall market growth, future expansion opportunities also exist in other less developed regions within Asia-Pacific, especially as regulatory landscapes evolve and economic development continues. Furthermore, industry consolidation through mergers and acquisitions might influence market dynamics, leading to changes in the competitive landscape and potential price adjustments. However, potential price fluctuations in raw materials and ongoing economic uncertainty could pose challenges to sustained growth.
Asia Pacific Chromatography Resins Industry Company Market Share
Asia Pacific Chromatography Resins Industry: Market Analysis & Forecast (2019-2033)
This comprehensive report provides an in-depth analysis of the Asia Pacific chromatography resins industry, offering invaluable insights for stakeholders seeking to navigate this dynamic market. Covering the period 2019-2033, with a focus on 2025, this study unveils market trends, competitive landscapes, and growth opportunities within this rapidly evolving sector. The report leverages extensive data analysis and expert insights to provide a clear understanding of market dynamics and future projections. Key segments, including drug production, water & environmental agencies, and food & beverages, are meticulously examined, along with detailed analysis of resin types (ion exchange, affinity, size exclusion, hydrophobic interaction) and origins (natural, synthetic). The report values the market size in Millions.
Asia Pacific Chromatography Resins Industry Market Structure & Competitive Landscape
The Asia Pacific chromatography resins market exhibits a moderately concentrated structure, with several major players holding significant market share. The Herfindahl-Hirschman Index (HHI) for 2025 is estimated at xx, indicating a moderately competitive landscape. Key drivers of innovation include advancements in resin technology, demand for high-purity products, and stringent regulatory requirements. Regulatory impacts, particularly concerning environmental regulations and product safety standards, significantly influence market dynamics. Product substitutes, such as membrane filtration techniques, pose a competitive threat, although chromatography resins retain a strong position due to their superior separation capabilities. The market is segmented by end-user industries, with pharmaceuticals, water and environmental agencies, and food and beverage sectors representing major application areas. M&A activity in the industry has been moderate in recent years, with approximately xx deals recorded between 2019 and 2024, primarily focused on expanding product portfolios and geographic reach.
- Market Concentration: HHI (2025) estimated at xx
- Innovation Drivers: Advancements in resin technology, demand for high-purity products, stringent regulations.
- Regulatory Impacts: Environmental regulations, product safety standards.
- Product Substitutes: Membrane filtration techniques.
- End-User Segmentation: Pharmaceuticals, Water & Environmental, Food & Beverage, Other.
- M&A Activity: Approximately xx deals (2019-2024).
Asia Pacific Chromatography Resins Industry Market Trends & Opportunities
The Asia Pacific chromatography resins market is experiencing robust growth, driven by increasing demand from various end-use sectors. The market size in 2025 is estimated at xx Million, exhibiting a Compound Annual Growth Rate (CAGR) of xx% during the forecast period (2025-2033). This growth is fueled by technological advancements leading to improved resin efficiency and selectivity, along with a rising preference for high-quality products across diverse industries. The pharmaceutical industry remains the dominant driver, with increasing demand for biopharmaceuticals and advanced drug delivery systems. The expanding water and environmental monitoring sectors also contribute significantly to market growth, driven by stricter environmental regulations and a growing awareness of water quality issues. Competitive dynamics are characterized by both established players and emerging companies, leading to continuous innovation and product diversification. Market penetration rates vary across different segments, with pharmaceuticals exhibiting higher penetration compared to other sectors.
Dominant Markets & Segments in Asia Pacific Chromatography Resins Industry
China and India are the leading markets in the Asia Pacific chromatography resins industry, driven by robust economic growth, expanding healthcare infrastructure, and a growing demand for advanced analytical techniques. Within the segments, the pharmaceutical industry stands out as the dominant end-user, fueled by the rising demand for biopharmaceuticals and personalized medicines. Synthetic-based chromatography resins are experiencing higher growth compared to natural-based resins, due to their superior performance characteristics and consistency. Ion exchange chromatography resins hold a significant market share, owing to their wide range of applications.
- Key Growth Drivers in China & India:
- Rapid economic expansion.
- Investments in healthcare infrastructure.
- Growing demand for advanced analytical techniques.
- Dominant End-User Segment: Pharmaceuticals (driven by biopharmaceuticals and personalized medicine).
- Leading Resin Type: Ion exchange chromatography resins.
- Fastest Growing Resin Origin: Synthetic-based resins.
Asia Pacific Chromatography Resins Industry Product Analysis
Recent innovations in chromatography resins focus on enhancing separation efficiency, selectivity, and scalability. Advancements in resin materials and surface modifications are leading to the development of highly specialized resins tailored to specific applications. These innovations cater to the increasing demand for high-throughput screening and purification processes across various industries. The competitive advantage stems from superior resin performance, such as increased binding capacity, improved resolution, and enhanced stability.
Key Drivers, Barriers & Challenges in Asia Pacific Chromatography Resins Industry
Key Drivers: Technological advancements (e.g., development of novel resin materials), increasing demand from pharmaceutical and biotechnology sectors, rising investments in research and development, and stringent environmental regulations driving adoption in water treatment.
Challenges: Fluctuations in raw material prices, stringent regulatory approvals, intense competition from established and emerging players, and the complexity of supply chain management, potentially leading to production delays and cost increases. These challenges could impact the overall market growth by xx% by 2033.
Growth Drivers in the Asia Pacific Chromatography Resins Industry Market
The market is primarily driven by the burgeoning pharmaceutical and biotechnology sectors, coupled with technological advancements leading to high-performance resins. Stringent environmental regulations are further boosting demand, particularly in water treatment and environmental monitoring applications. Government initiatives promoting technological advancements and research & development activities also play a crucial role.
Challenges Impacting Asia Pacific Chromatography Resins Industry Growth
Challenges include the volatility of raw material prices, complex regulatory processes leading to delays in product approvals, and intense competition from both domestic and international players. Supply chain disruptions, especially in the wake of global events, pose a significant threat to market stability.
Key Players Shaping the Asia Pacific Chromatography Resins Industry Market
Significant Asia Pacific Chromatography Resins Industry Industry Milestones
- 2020: Launch of a novel affinity chromatography resin by Merck KGaA.
- 2021: Acquisition of a smaller chromatography resin manufacturer by Bio-Rad Laboratories.
- 2022: Introduction of a new high-performance ion exchange resin by General Electric.
- 2023: Implementation of stricter environmental regulations in several Asian countries.
Future Outlook for Asia Pacific Chromatography Resins Industry Market
The Asia Pacific chromatography resins market is poised for continued growth, driven by the increasing demand from the pharmaceutical, biotechnology, and environmental sectors. Strategic partnerships, technological innovations, and expansion into emerging markets will be key factors in shaping future market dynamics. The market is expected to reach xx Million by 2033, presenting significant opportunities for both established players and new entrants.
Asia Pacific Chromatography Resins Industry Segmentation
-
1. Origin
-
1.1. Natural-based
- 1.1.1. Agarose
- 1.1.2. Dextran
-
1.2. Synthetic-based
- 1.2.1. Silica Gel
- 1.2.2. Aluminum Oxide
- 1.2.3. Polystyrene
- 1.2.4. Other Synthetic-based Resins
-
1.1. Natural-based
-
2. Technology
- 2.1. Ion Exchange Chromatography Resins
- 2.2. Affinity Chromatography Resins
- 2.3. Size Exclusion Chromatography Resins
- 2.4. Hydrophobic Interaction Chromatography Resins
- 2.5. Other Technologies
-
3. End-user Industry
-
3.1. Pharmaceuticals
- 3.1.1. Biotechnology
- 3.1.2. Drug Discovery
- 3.1.3. Drug Production
- 3.2. Water and Environmental Agencies
- 3.3. Food and Beverages
- 3.4. Other End-user Industries
-
3.1. Pharmaceuticals
-
4. Geography
- 4.1. China
- 4.2. India
- 4.3. Japan
- 4.4. Rest of Asia-Pacific
Asia Pacific Chromatography Resins Industry Segmentation By Geography
- 1. China
- 2. India
- 3. Japan
- 4. Rest of Asia Pacific
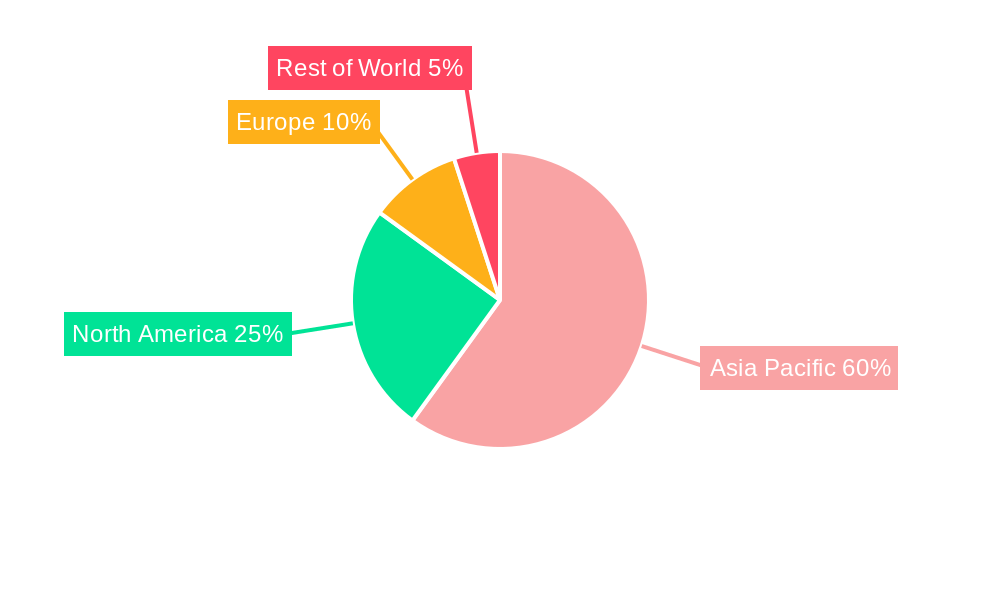
Asia Pacific Chromatography Resins Industry Regional Market Share
Geographic Coverage of Asia Pacific Chromatography Resins Industry
Asia Pacific Chromatography Resins Industry REPORT HIGHLIGHTS
| Aspects | Details |
|---|---|
| Study Period | 2020-2034 |
| Base Year | 2025 |
| Estimated Year | 2026 |
| Forecast Period | 2026-2034 |
| Historical Period | 2020-2025 |
| Growth Rate | CAGR of > 7.00% from 2020-2034 |
| Segmentation |
|
Table of Contents
- 1. Introduction
- 1.1. Research Scope
- 1.2. Market Segmentation
- 1.3. Research Objective
- 1.4. Definitions and Assumptions
- 2. Executive Summary
- 2.1. Market Snapshot
- 3. Market Dynamics
- 3.1. Market Drivers
- 3.2. Market Restrains
- 3.3. Market Trends
- 3.4. Market Opportunities
- 4. Market Factor Analysis
- 4.1. Porters Five Forces
- 4.1.1. Bargaining Power of Suppliers
- 4.1.2. Bargaining Power of Buyers
- 4.1.3. Threat of New Entrants
- 4.1.4. Threat of Substitutes
- 4.1.5. Competitive Rivalry
- 4.2. PESTEL analysis
- 4.3. BCG Analysis
- 4.3.1. Stars (High Growth, High Market Share)
- 4.3.2. Cash Cows (Low Growth, High Market Share)
- 4.3.3. Question Mark (High Growth, Low Market Share)
- 4.3.4. Dogs (Low Growth, Low Market Share)
- 4.4. Ansoff Matrix Analysis
- 4.5. Supply Chain Analysis
- 4.6. Regulatory Landscape
- 4.7. Current Market Potential and Opportunity Assessment (TAM–SAM–SOM Framework)
- 4.8. TIR Analyst Note
- 4.1. Porters Five Forces
- 5. Market Analysis, Insights and Forecast 2021-2033
- 5.1. Market Analysis, Insights and Forecast - by Origin
- 5.1.1. Natural-based
- 5.1.1.1. Agarose
- 5.1.1.2. Dextran
- 5.1.2. Synthetic-based
- 5.1.2.1. Silica Gel
- 5.1.2.2. Aluminum Oxide
- 5.1.2.3. Polystyrene
- 5.1.2.4. Other Synthetic-based Resins
- 5.1.1. Natural-based
- 5.2. Market Analysis, Insights and Forecast - by Technology
- 5.2.1. Ion Exchange Chromatography Resins
- 5.2.2. Affinity Chromatography Resins
- 5.2.3. Size Exclusion Chromatography Resins
- 5.2.4. Hydrophobic Interaction Chromatography Resins
- 5.2.5. Other Technologies
- 5.3. Market Analysis, Insights and Forecast - by End-user Industry
- 5.3.1. Pharmaceuticals
- 5.3.1.1. Biotechnology
- 5.3.1.2. Drug Discovery
- 5.3.1.3. Drug Production
- 5.3.2. Water and Environmental Agencies
- 5.3.3. Food and Beverages
- 5.3.4. Other End-user Industries
- 5.3.1. Pharmaceuticals
- 5.4. Market Analysis, Insights and Forecast - by Geography
- 5.4.1. China
- 5.4.2. India
- 5.4.3. Japan
- 5.4.4. Rest of Asia-Pacific
- 5.5. Market Analysis, Insights and Forecast - by Region
- 5.5.1. China
- 5.5.2. India
- 5.5.3. Japan
- 5.5.4. Rest of Asia Pacific
- 5.1. Market Analysis, Insights and Forecast - by Origin
- 6. Asia Pacific Chromatography Resins Industry Analysis, Insights and Forecast, 2021-2033
- 6.1. Market Analysis, Insights and Forecast - by Origin
- 6.1.1. Natural-based
- 6.1.1.1. Agarose
- 6.1.1.2. Dextran
- 6.1.2. Synthetic-based
- 6.1.2.1. Silica Gel
- 6.1.2.2. Aluminum Oxide
- 6.1.2.3. Polystyrene
- 6.1.2.4. Other Synthetic-based Resins
- 6.1.1. Natural-based
- 6.2. Market Analysis, Insights and Forecast - by Technology
- 6.2.1. Ion Exchange Chromatography Resins
- 6.2.2. Affinity Chromatography Resins
- 6.2.3. Size Exclusion Chromatography Resins
- 6.2.4. Hydrophobic Interaction Chromatography Resins
- 6.2.5. Other Technologies
- 6.3. Market Analysis, Insights and Forecast - by End-user Industry
- 6.3.1. Pharmaceuticals
- 6.3.1.1. Biotechnology
- 6.3.1.2. Drug Discovery
- 6.3.1.3. Drug Production
- 6.3.2. Water and Environmental Agencies
- 6.3.3. Food and Beverages
- 6.3.4. Other End-user Industries
- 6.3.1. Pharmaceuticals
- 6.4. Market Analysis, Insights and Forecast - by Geography
- 6.4.1. China
- 6.4.2. India
- 6.4.3. Japan
- 6.4.4. Rest of Asia-Pacific
- 6.1. Market Analysis, Insights and Forecast - by Origin
- 7. China Asia Pacific Chromatography Resins Industry Analysis, Insights and Forecast, 2020-2032
- 7.1. Market Analysis, Insights and Forecast - by Origin
- 7.1.1. Natural-based
- 7.1.1.1. Agarose
- 7.1.1.2. Dextran
- 7.1.2. Synthetic-based
- 7.1.2.1. Silica Gel
- 7.1.2.2. Aluminum Oxide
- 7.1.2.3. Polystyrene
- 7.1.2.4. Other Synthetic-based Resins
- 7.1.1. Natural-based
- 7.2. Market Analysis, Insights and Forecast - by Technology
- 7.2.1. Ion Exchange Chromatography Resins
- 7.2.2. Affinity Chromatography Resins
- 7.2.3. Size Exclusion Chromatography Resins
- 7.2.4. Hydrophobic Interaction Chromatography Resins
- 7.2.5. Other Technologies
- 7.3. Market Analysis, Insights and Forecast - by End-user Industry
- 7.3.1. Pharmaceuticals
- 7.3.1.1. Biotechnology
- 7.3.1.2. Drug Discovery
- 7.3.1.3. Drug Production
- 7.3.2. Water and Environmental Agencies
- 7.3.3. Food and Beverages
- 7.3.4. Other End-user Industries
- 7.3.1. Pharmaceuticals
- 7.4. Market Analysis, Insights and Forecast - by Geography
- 7.4.1. China
- 7.4.2. India
- 7.4.3. Japan
- 7.4.4. Rest of Asia-Pacific
- 7.1. Market Analysis, Insights and Forecast - by Origin
- 8. India Asia Pacific Chromatography Resins Industry Analysis, Insights and Forecast, 2020-2032
- 8.1. Market Analysis, Insights and Forecast - by Origin
- 8.1.1. Natural-based
- 8.1.1.1. Agarose
- 8.1.1.2. Dextran
- 8.1.2. Synthetic-based
- 8.1.2.1. Silica Gel
- 8.1.2.2. Aluminum Oxide
- 8.1.2.3. Polystyrene
- 8.1.2.4. Other Synthetic-based Resins
- 8.1.1. Natural-based
- 8.2. Market Analysis, Insights and Forecast - by Technology
- 8.2.1. Ion Exchange Chromatography Resins
- 8.2.2. Affinity Chromatography Resins
- 8.2.3. Size Exclusion Chromatography Resins
- 8.2.4. Hydrophobic Interaction Chromatography Resins
- 8.2.5. Other Technologies
- 8.3. Market Analysis, Insights and Forecast - by End-user Industry
- 8.3.1. Pharmaceuticals
- 8.3.1.1. Biotechnology
- 8.3.1.2. Drug Discovery
- 8.3.1.3. Drug Production
- 8.3.2. Water and Environmental Agencies
- 8.3.3. Food and Beverages
- 8.3.4. Other End-user Industries
- 8.3.1. Pharmaceuticals
- 8.4. Market Analysis, Insights and Forecast - by Geography
- 8.4.1. China
- 8.4.2. India
- 8.4.3. Japan
- 8.4.4. Rest of Asia-Pacific
- 8.1. Market Analysis, Insights and Forecast - by Origin
- 9. Japan Asia Pacific Chromatography Resins Industry Analysis, Insights and Forecast, 2020-2032
- 9.1. Market Analysis, Insights and Forecast - by Origin
- 9.1.1. Natural-based
- 9.1.1.1. Agarose
- 9.1.1.2. Dextran
- 9.1.2. Synthetic-based
- 9.1.2.1. Silica Gel
- 9.1.2.2. Aluminum Oxide
- 9.1.2.3. Polystyrene
- 9.1.2.4. Other Synthetic-based Resins
- 9.1.1. Natural-based
- 9.2. Market Analysis, Insights and Forecast - by Technology
- 9.2.1. Ion Exchange Chromatography Resins
- 9.2.2. Affinity Chromatography Resins
- 9.2.3. Size Exclusion Chromatography Resins
- 9.2.4. Hydrophobic Interaction Chromatography Resins
- 9.2.5. Other Technologies
- 9.3. Market Analysis, Insights and Forecast - by End-user Industry
- 9.3.1. Pharmaceuticals
- 9.3.1.1. Biotechnology
- 9.3.1.2. Drug Discovery
- 9.3.1.3. Drug Production
- 9.3.2. Water and Environmental Agencies
- 9.3.3. Food and Beverages
- 9.3.4. Other End-user Industries
- 9.3.1. Pharmaceuticals
- 9.4. Market Analysis, Insights and Forecast - by Geography
- 9.4.1. China
- 9.4.2. India
- 9.4.3. Japan
- 9.4.4. Rest of Asia-Pacific
- 9.1. Market Analysis, Insights and Forecast - by Origin
- 10. Rest of Asia Pacific Asia Pacific Chromatography Resins Industry Analysis, Insights and Forecast, 2020-2032
- 10.1. Market Analysis, Insights and Forecast - by Origin
- 10.1.1. Natural-based
- 10.1.1.1. Agarose
- 10.1.1.2. Dextran
- 10.1.2. Synthetic-based
- 10.1.2.1. Silica Gel
- 10.1.2.2. Aluminum Oxide
- 10.1.2.3. Polystyrene
- 10.1.2.4. Other Synthetic-based Resins
- 10.1.1. Natural-based
- 10.2. Market Analysis, Insights and Forecast - by Technology
- 10.2.1. Ion Exchange Chromatography Resins
- 10.2.2. Affinity Chromatography Resins
- 10.2.3. Size Exclusion Chromatography Resins
- 10.2.4. Hydrophobic Interaction Chromatography Resins
- 10.2.5. Other Technologies
- 10.3. Market Analysis, Insights and Forecast - by End-user Industry
- 10.3.1. Pharmaceuticals
- 10.3.1.1. Biotechnology
- 10.3.1.2. Drug Discovery
- 10.3.1.3. Drug Production
- 10.3.2. Water and Environmental Agencies
- 10.3.3. Food and Beverages
- 10.3.4. Other End-user Industries
- 10.3.1. Pharmaceuticals
- 10.4. Market Analysis, Insights and Forecast - by Geography
- 10.4.1. China
- 10.4.2. India
- 10.4.3. Japan
- 10.4.4. Rest of Asia-Pacific
- 10.1. Market Analysis, Insights and Forecast - by Origin
- 11. Competitive Analysis
- 11.1. Company Profiles
- 11.1.1 General Electric
- 11.1.1.1. Company Overview
- 11.1.1.2. Products
- 11.1.1.3. Company Financials
- 11.1.1.4. SWOT Analysis
- 11.1.2 Bio-Rad Laboratories Inc
- 11.1.2.1. Company Overview
- 11.1.2.2. Products
- 11.1.2.3. Company Financials
- 11.1.2.4. SWOT Analysis
- 11.1.3 Merck KGaA
- 11.1.3.1. Company Overview
- 11.1.3.2. Products
- 11.1.3.3. Company Financials
- 11.1.3.4. SWOT Analysis
- 11.1.4 Mitsubishi Chemical Corporation
- 11.1.4.1. Company Overview
- 11.1.4.2. Products
- 11.1.4.3. Company Financials
- 11.1.4.4. SWOT Analysis
- 11.1.5 Dupont
- 11.1.5.1. Company Overview
- 11.1.5.2. Products
- 11.1.5.3. Company Financials
- 11.1.5.4. SWOT Analysis
- 11.1.6 Pall Corporation
- 11.1.6.1. Company Overview
- 11.1.6.2. Products
- 11.1.6.3. Company Financials
- 11.1.6.4. SWOT Analysis
- 11.1.7 Tosoh Bioscience LLC*List Not Exhaustive
- 11.1.7.1. Company Overview
- 11.1.7.2. Products
- 11.1.7.3. Company Financials
- 11.1.7.4. SWOT Analysis
- 11.1.8 Purolite
- 11.1.8.1. Company Overview
- 11.1.8.2. Products
- 11.1.8.3. Company Financials
- 11.1.8.4. SWOT Analysis
- 11.1.9 Agilient Technologies
- 11.1.9.1. Company Overview
- 11.1.9.2. Products
- 11.1.9.3. Company Financials
- 11.1.9.4. SWOT Analysis
- 11.1.10 Avantor Inc
- 11.1.10.1. Company Overview
- 11.1.10.2. Products
- 11.1.10.3. Company Financials
- 11.1.10.4. SWOT Analysis
- 11.1.11 Thermo Fisher Scientific
- 11.1.11.1. Company Overview
- 11.1.11.2. Products
- 11.1.11.3. Company Financials
- 11.1.11.4. SWOT Analysis
- 11.1.1 General Electric
- 11.2. Market Entropy
- 11.2.1 Company's Key Areas Served
- 11.2.2 Recent Developments
- 11.3. Company Market Share Analysis 2025
- 11.3.1 Top 5 Companies Market Share Analysis
- 11.3.2 Top 3 Companies Market Share Analysis
- 11.4. List of Potential Customers
- 12. Research Methodology
List of Figures
- Figure 1: Asia Pacific Chromatography Resins Industry Revenue Breakdown (Million, %) by Product 2025 & 2033
- Figure 2: Asia Pacific Chromatography Resins Industry Share (%) by Company 2025
List of Tables
- Table 1: Asia Pacific Chromatography Resins Industry Revenue Million Forecast, by Origin 2020 & 2033
- Table 2: Asia Pacific Chromatography Resins Industry Volume K Tons Forecast, by Origin 2020 & 2033
- Table 3: Asia Pacific Chromatography Resins Industry Revenue Million Forecast, by Technology 2020 & 2033
- Table 4: Asia Pacific Chromatography Resins Industry Volume K Tons Forecast, by Technology 2020 & 2033
- Table 5: Asia Pacific Chromatography Resins Industry Revenue Million Forecast, by End-user Industry 2020 & 2033
- Table 6: Asia Pacific Chromatography Resins Industry Volume K Tons Forecast, by End-user Industry 2020 & 2033
- Table 7: Asia Pacific Chromatography Resins Industry Revenue Million Forecast, by Geography 2020 & 2033
- Table 8: Asia Pacific Chromatography Resins Industry Volume K Tons Forecast, by Geography 2020 & 2033
- Table 9: Asia Pacific Chromatography Resins Industry Revenue Million Forecast, by Region 2020 & 2033
- Table 10: Asia Pacific Chromatography Resins Industry Volume K Tons Forecast, by Region 2020 & 2033
- Table 11: Asia Pacific Chromatography Resins Industry Revenue Million Forecast, by Origin 2020 & 2033
- Table 12: Asia Pacific Chromatography Resins Industry Volume K Tons Forecast, by Origin 2020 & 2033
- Table 13: Asia Pacific Chromatography Resins Industry Revenue Million Forecast, by Technology 2020 & 2033
- Table 14: Asia Pacific Chromatography Resins Industry Volume K Tons Forecast, by Technology 2020 & 2033
- Table 15: Asia Pacific Chromatography Resins Industry Revenue Million Forecast, by End-user Industry 2020 & 2033
- Table 16: Asia Pacific Chromatography Resins Industry Volume K Tons Forecast, by End-user Industry 2020 & 2033
- Table 17: Asia Pacific Chromatography Resins Industry Revenue Million Forecast, by Geography 2020 & 2033
- Table 18: Asia Pacific Chromatography Resins Industry Volume K Tons Forecast, by Geography 2020 & 2033
- Table 19: Asia Pacific Chromatography Resins Industry Revenue Million Forecast, by Country 2020 & 2033
- Table 20: Asia Pacific Chromatography Resins Industry Volume K Tons Forecast, by Country 2020 & 2033
- Table 21: Asia Pacific Chromatography Resins Industry Revenue Million Forecast, by Origin 2020 & 2033
- Table 22: Asia Pacific Chromatography Resins Industry Volume K Tons Forecast, by Origin 2020 & 2033
- Table 23: Asia Pacific Chromatography Resins Industry Revenue Million Forecast, by Technology 2020 & 2033
- Table 24: Asia Pacific Chromatography Resins Industry Volume K Tons Forecast, by Technology 2020 & 2033
- Table 25: Asia Pacific Chromatography Resins Industry Revenue Million Forecast, by End-user Industry 2020 & 2033
- Table 26: Asia Pacific Chromatography Resins Industry Volume K Tons Forecast, by End-user Industry 2020 & 2033
- Table 27: Asia Pacific Chromatography Resins Industry Revenue Million Forecast, by Geography 2020 & 2033
- Table 28: Asia Pacific Chromatography Resins Industry Volume K Tons Forecast, by Geography 2020 & 2033
- Table 29: Asia Pacific Chromatography Resins Industry Revenue Million Forecast, by Country 2020 & 2033
- Table 30: Asia Pacific Chromatography Resins Industry Volume K Tons Forecast, by Country 2020 & 2033
- Table 31: Asia Pacific Chromatography Resins Industry Revenue Million Forecast, by Origin 2020 & 2033
- Table 32: Asia Pacific Chromatography Resins Industry Volume K Tons Forecast, by Origin 2020 & 2033
- Table 33: Asia Pacific Chromatography Resins Industry Revenue Million Forecast, by Technology 2020 & 2033
- Table 34: Asia Pacific Chromatography Resins Industry Volume K Tons Forecast, by Technology 2020 & 2033
- Table 35: Asia Pacific Chromatography Resins Industry Revenue Million Forecast, by End-user Industry 2020 & 2033
- Table 36: Asia Pacific Chromatography Resins Industry Volume K Tons Forecast, by End-user Industry 2020 & 2033
- Table 37: Asia Pacific Chromatography Resins Industry Revenue Million Forecast, by Geography 2020 & 2033
- Table 38: Asia Pacific Chromatography Resins Industry Volume K Tons Forecast, by Geography 2020 & 2033
- Table 39: Asia Pacific Chromatography Resins Industry Revenue Million Forecast, by Country 2020 & 2033
- Table 40: Asia Pacific Chromatography Resins Industry Volume K Tons Forecast, by Country 2020 & 2033
- Table 41: Asia Pacific Chromatography Resins Industry Revenue Million Forecast, by Origin 2020 & 2033
- Table 42: Asia Pacific Chromatography Resins Industry Volume K Tons Forecast, by Origin 2020 & 2033
- Table 43: Asia Pacific Chromatography Resins Industry Revenue Million Forecast, by Technology 2020 & 2033
- Table 44: Asia Pacific Chromatography Resins Industry Volume K Tons Forecast, by Technology 2020 & 2033
- Table 45: Asia Pacific Chromatography Resins Industry Revenue Million Forecast, by End-user Industry 2020 & 2033
- Table 46: Asia Pacific Chromatography Resins Industry Volume K Tons Forecast, by End-user Industry 2020 & 2033
- Table 47: Asia Pacific Chromatography Resins Industry Revenue Million Forecast, by Geography 2020 & 2033
- Table 48: Asia Pacific Chromatography Resins Industry Volume K Tons Forecast, by Geography 2020 & 2033
- Table 49: Asia Pacific Chromatography Resins Industry Revenue Million Forecast, by Country 2020 & 2033
- Table 50: Asia Pacific Chromatography Resins Industry Volume K Tons Forecast, by Country 2020 & 2033
Frequently Asked Questions
1. What is the projected Compound Annual Growth Rate (CAGR) of the Asia Pacific Chromatography Resins Industry?
The projected CAGR is approximately > 7.00%.
2. Which companies are prominent players in the Asia Pacific Chromatography Resins Industry?
Key companies in the market include General Electric, Bio-Rad Laboratories Inc, Merck KGaA, Mitsubishi Chemical Corporation, Dupont, Pall Corporation, Tosoh Bioscience LLC*List Not Exhaustive, Purolite, Agilient Technologies, Avantor Inc, Thermo Fisher Scientific.
3. What are the main segments of the Asia Pacific Chromatography Resins Industry?
The market segments include Origin, Technology, End-user Industry, Geography.
4. Can you provide details about the market size?
The market size is estimated to be USD 646.7 Million as of 2022.
5. What are some drivers contributing to market growth?
; Rising Demand from the Pharmaceutical Sector; Technological Advancements in Chromatography Resins; Increasing Importance of Chromatography Tests in Drug Approvals.
6. What are the notable trends driving market growth?
Increasing Demand from Pharmaceutical Sector.
7. Are there any restraints impacting market growth?
; High Costs vs. Productivity of Chromatography Systems.
8. Can you provide examples of recent developments in the market?
N/A
9. What pricing options are available for accessing the report?
Pricing options include single-user, multi-user, and enterprise licenses priced at USD 4750, USD 5250, and USD 8750 respectively.
10. Is the market size provided in terms of value or volume?
The market size is provided in terms of value, measured in Million and volume, measured in K Tons.
11. Are there any specific market keywords associated with the report?
Yes, the market keyword associated with the report is "Asia Pacific Chromatography Resins Industry," which aids in identifying and referencing the specific market segment covered.
12. How do I determine which pricing option suits my needs best?
The pricing options vary based on user requirements and access needs. Individual users may opt for single-user licenses, while businesses requiring broader access may choose multi-user or enterprise licenses for cost-effective access to the report.
13. Are there any additional resources or data provided in the Asia Pacific Chromatography Resins Industry report?
While the report offers comprehensive insights, it's advisable to review the specific contents or supplementary materials provided to ascertain if additional resources or data are available.
14. How can I stay updated on further developments or reports in the Asia Pacific Chromatography Resins Industry?
To stay informed about further developments, trends, and reports in the Asia Pacific Chromatography Resins Industry, consider subscribing to industry newsletters, following relevant companies and organizations, or regularly checking reputable industry news sources and publications.
Methodology
Step 1 - Identification of Relevant Samples Size from Population Database


Step 2 - Approaches for Defining Global Market Size (Value, Volume* & Price*)

Note*: In applicable scenarios
Step 3 - Data Sources
Primary Research
- Web Analytics
- Survey Reports
- Research Institute
- Latest Research Reports
- Opinion Leaders
Secondary Research
- Annual Reports
- White Paper
- Latest Press Release
- Industry Association
- Paid Database
- Investor Presentations

Step 4 - Data Triangulation
Involves using different sources of information in order to increase the validity of a study
These sources are likely to be stakeholders in a program - participants, other researchers, program staff, other community members, and so on.
Then we put all data in single framework & apply various statistical tools to find out the dynamic on the market.
During the analysis stage, feedback from the stakeholder groups would be compared to determine areas of agreement as well as areas of divergence