

Key Insights
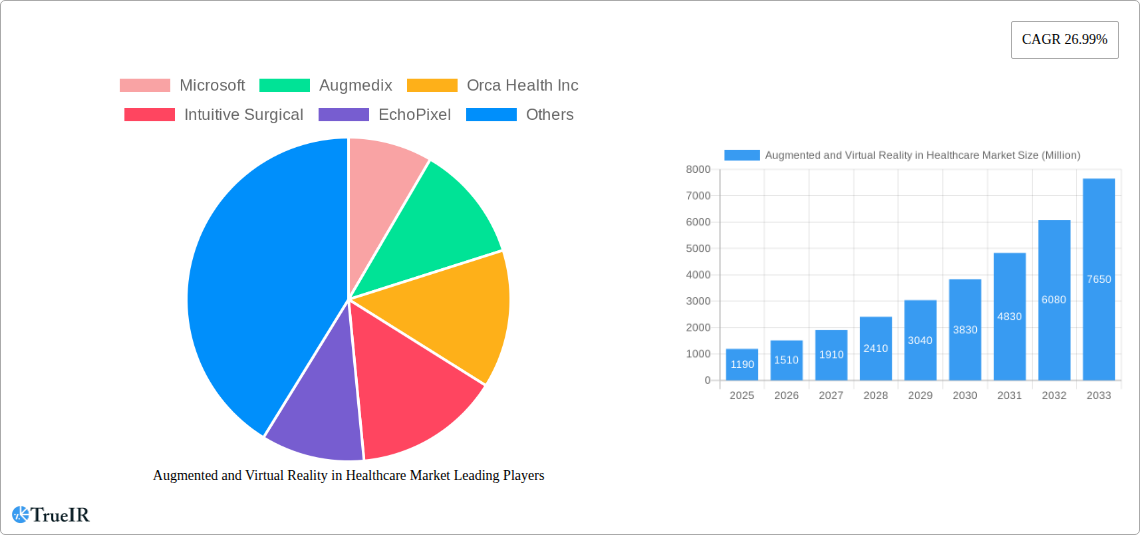
The Augmented and Virtual Reality (AR/VR) in Healthcare market is experiencing explosive growth, projected to reach a substantial size driven by technological advancements and increasing demand for improved healthcare solutions. The market's Compound Annual Growth Rate (CAGR) of 26.99% from 2019 to 2024 indicates a significant upward trajectory, fueled by factors such as the rising adoption of minimally invasive surgical procedures, the need for enhanced medical training and simulations, and the growing preference for remote patient monitoring. Key segments driving this growth include AR/VR devices specifically designed for healthcare applications (head-mounted displays, handheld devices), and software solutions like AR displays for surgical navigation and AR sensors for precise diagnostics. Major players like Microsoft, Intuitive Surgical, and Philips are actively investing in R&D and strategic partnerships to capitalize on this burgeoning market, further accelerating its expansion. The geographical distribution shows strong growth across North America and Europe, with Asia Pacific emerging as a rapidly developing market, driven by increased healthcare spending and technological adoption in major economies like China and India.
This robust growth is further underpinned by several key trends. The increasing integration of AI and machine learning within AR/VR systems is leading to more sophisticated and accurate diagnostic tools. The development of more user-friendly and affordable AR/VR devices is expanding accessibility across diverse healthcare settings. Regulatory approvals for new AR/VR medical devices are streamlining market entry and accelerating the adoption of these technologies. While challenges remain, such as high initial investment costs and concerns regarding data privacy and security, the long-term potential of AR/VR in revolutionizing healthcare delivery remains undeniable. The continuous innovation in hardware and software, coupled with supportive regulatory frameworks, positions this market for sustained and significant expansion throughout the forecast period (2025-2033).
This dynamic report provides a comprehensive analysis of the Augmented and Virtual Reality (AR/VR) in Healthcare market, offering invaluable insights for stakeholders seeking to navigate this rapidly evolving landscape. Leveraging extensive research and data analysis, this report covers market structure, competitive dynamics, growth trends, and future projections, focusing on the period 2019-2033, with a base year of 2025. The report provides detailed segmentation by end-user (Hospitals and Clinics, Research Laboratories, Others), technology (Head Mounted Devices, Handheld Devices), and product (AR Displays, AR Sensors, AR Input Devices, AR Semiconductor Components, Others). The market is projected to reach xx Million by 2033, demonstrating significant growth potential.
Augmented and Virtual Reality in Healthcare Market Market Structure & Competitive Landscape
The AR/VR in Healthcare market exhibits a moderately concentrated structure, with several key players holding significant market share. However, the market is also characterized by a high level of innovation, driven by ongoing technological advancements and the increasing adoption of AR/VR solutions across various healthcare applications. Regulatory landscapes vary across different geographies, impacting market entry and growth. Product substitutes, such as traditional training methods or diagnostic tools, still present competition, but the unique advantages of AR/VR are driving market expansion.
Market Concentration: The Herfindahl-Hirschman Index (HHI) for the market is estimated at xx, indicating a moderately concentrated market.
Innovation Drivers: The continuous development of higher-resolution displays, improved processing power, and more intuitive interfaces are key drivers of innovation.
Regulatory Impacts: Stringent regulatory approvals for medical devices and data privacy regulations significantly influence market dynamics.
End-User Segmentation: Hospitals and clinics currently dominate the market, followed by research laboratories. The "Others" segment is expected to experience significant growth in the forecast period.
M&A Trends: The number of mergers and acquisitions in the AR/VR healthcare sector has increased by xx% in the last 5 years, demonstrating industry consolidation and strategic investments.
Augmented and Virtual Reality in Healthcare Market Market Trends & Opportunities
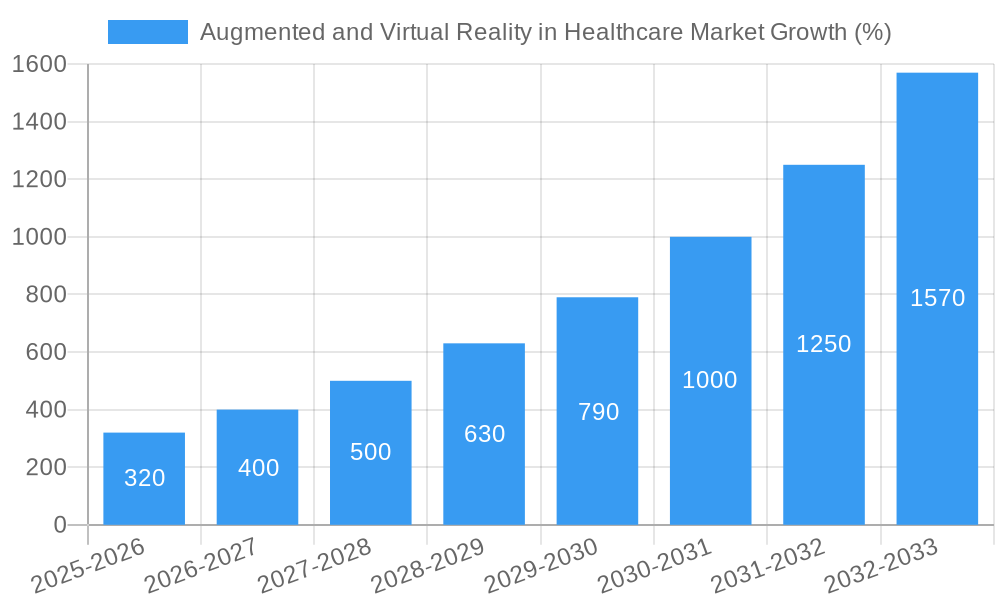
The global AR/VR in Healthcare market is experiencing robust growth, driven by several key factors. The market size is projected to reach xx Million in 2025 and further expand to xx Million by 2033, exhibiting a Compound Annual Growth Rate (CAGR) of xx% during the forecast period (2025-2033). Technological advancements, including miniaturization of devices, improved haptic feedback, and enhanced data analytics capabilities are driving market penetration rates. Consumer preferences are shifting towards minimally invasive procedures and personalized healthcare solutions, further fueling the demand for AR/VR technologies. Intense competition among established players and emerging startups is promoting innovation and driving down costs, making AR/VR solutions more accessible to a wider range of healthcare providers and patients.
Dominant Markets & Segments in Augmented and Virtual Reality in Healthcare Market
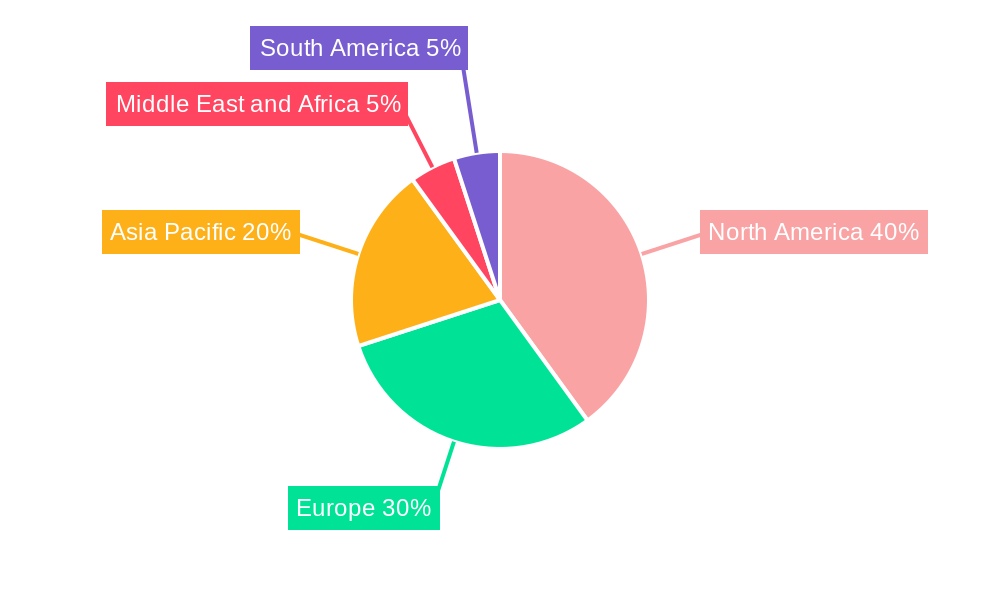
The North American region currently dominates the AR/VR in Healthcare market, driven by high technological advancements, substantial investments in healthcare infrastructure, and favorable regulatory environments. Within the segment breakdown:
- By End User: Hospitals and clinics constitute the largest segment due to the high adoption of AR/VR for surgical planning, training, and patient care.
- By Technology: Head-mounted displays currently hold the largest market share due to their immersive capabilities. However, handheld devices are witnessing rapid growth.
- By Product: AR displays are the dominant product category, followed by AR sensors.
Key Growth Drivers:
- Advanced Infrastructure: The presence of robust healthcare infrastructure in developed regions supports the adoption of AR/VR technologies.
- Favorable Government Policies: Supportive regulatory frameworks and funding initiatives are accelerating market growth.
- Rising Healthcare Expenditure: Increasing healthcare spending globally is creating a conducive environment for technological advancements.
Augmented and Virtual Reality in Healthcare Market Product Analysis
Product innovation in the AR/VR healthcare sector is focused on improving device ergonomics, enhancing image resolution and accuracy, and developing more sophisticated software applications. The market is witnessing the introduction of lightweight, wireless headsets, improved haptic feedback mechanisms, and AI-powered diagnostic tools. The competitive advantage lies in developing user-friendly, cost-effective, and highly accurate solutions tailored to specific clinical needs.
Key Drivers, Barriers & Challenges in Augmented and Virtual Reality in Healthcare Market
Key Drivers:
- Technological advancements in display technology, processing power, and haptic feedback.
- Growing demand for minimally invasive procedures and personalized healthcare.
- Increasing government funding and support for healthcare innovation.
Challenges:
- High initial investment costs for AR/VR equipment and software.
- Concerns regarding data security and patient privacy.
- Limited regulatory approvals for certain AR/VR medical devices in some regions, leading to market entry barriers. This restricts market penetration by an estimated xx Million.
Growth Drivers in the Augmented and Virtual Reality in Healthcare Market Market
The market is driven by technological advancements, increasing demand for minimally invasive procedures, and supportive government policies. Specifically, improvements in display resolution, processing power, and haptic feedback are enhancing user experience. The rising need for accurate medical imaging and training simulations is propelling demand.
Challenges Impacting Augmented and Virtual Reality in Healthcare Market Growth
High initial costs, regulatory hurdles, and concerns regarding data security and privacy pose significant challenges. The lack of standardization in AR/VR technologies also hinders widespread adoption.
Key Players Shaping the Augmented and Virtual Reality in Healthcare Market Market
- Microsoft
- Augmedix
- Orca Health Inc
- Intuitive Surgical
- EchoPixel
- Augmented Pixels Inc
- Siemens Healthineers
- Surgical Theater
- Koninklijke Philips N V
- Vuzix Corporation
- AccuVein Inc
- CAE Healthcare
Significant Augmented and Virtual Reality in Healthcare Market Industry Milestones
- 2020-Q4: Microsoft launched its HoloLens 2 headset, improved capabilities for surgical planning and training.
- 2021-Q1: Augmedix secured significant funding to expand its AI-powered scribe service.
- 2022-Q3: Several partnerships were formed between AR/VR companies and major healthcare providers, fostering widespread adoption.
Future Outlook for Augmented and Virtual Reality in Healthcare Market Market
The AR/VR in healthcare market is poised for sustained growth, driven by technological advancements, increasing demand for personalized medicine, and favorable regulatory changes. Strategic partnerships and collaborations between technology companies and healthcare providers will accelerate market expansion. The focus on developing cost-effective and user-friendly solutions will make AR/VR technologies accessible to a wider range of healthcare settings, unlocking significant market potential.
Augmented and Virtual Reality in Healthcare Market Segmentation
-
1. Technology
- 1.1. Head Mounted Devices
- 1.2. Handheld Devices
-
2. Product
- 2.1. AR Displays
- 2.2. AR Sensors
- 2.3. AR Input Devices
- 2.4. AR Semiconductor Components
- 2.5. Others
-
3. End User
- 3.1. Hospitals and Clinics
- 3.2. Research Laboratories
- 3.3. Others
Augmented and Virtual Reality in Healthcare Market Segmentation By Geography
-
1. North America
- 1.1. United States
- 1.2. Canada
- 1.3. Mexico
-
2. Europe
- 2.1. Germany
- 2.2. United Kingdom
- 2.3. France
- 2.4. Italy
- 2.5. Spain
- 2.6. Rest of Europe
-
3. Asia Pacific
- 3.1. China
- 3.2. Japan
- 3.3. India
- 3.4. Australia
- 3.5. South Korea
- 3.6. Rest of Asia Pacific
-
4. Middle East and Africa
- 4.1. GCC
- 4.2. South Africa
- 4.3. Rest of Middle East and Africa
-
5. South America
- 5.1. Brazil
- 5.2. Argentina
- 5.3. Rest of South America
Augmented and Virtual Reality in Healthcare Market REPORT HIGHLIGHTS
| Aspects | Details |
|---|---|
| Study Period | 2019-2033 |
| Base Year | 2024 |
| Estimated Year | 2025 |
| Forecast Period | 2025-2033 |
| Historical Period | 2019-2024 |
| Growth Rate | CAGR of 26.99% from 2019-2033 |
| Segmentation |
|
Table of Contents
- 1. Introduction
- 1.1. Research Scope
- 1.2. Market Segmentation
- 1.3. Research Methodology
- 1.4. Definitions and Assumptions
- 2. Executive Summary
- 2.1. Introduction
- 3. Market Dynamics
- 3.1. Introduction
- 3.2. Market Drivers
- 3.2.1. Rise in Adoption of Augmented Reality in Healthcare; Increase in Investments in Augmented Reality; Rise in Number of Start Up Companies in the Market
- 3.3. Market Restrains
- 3.3.1. High Cost of Augmented Reality Products; Data Security Concers
- 3.4. Market Trends
- 3.4.1. Head-Mounted Devices Segment is Expected to Hold a Significant Share in the Market Over the Forecast Period
- 4. Market Factor Analysis
- 4.1. Porters Five Forces
- 4.2. Supply/Value Chain
- 4.3. PESTEL analysis
- 4.4. Market Entropy
- 4.5. Patent/Trademark Analysis
- 5. Global Augmented and Virtual Reality in Healthcare Market Analysis, Insights and Forecast, 2019-2031
- 5.1. Market Analysis, Insights and Forecast - by Technology
- 5.1.1. Head Mounted Devices
- 5.1.2. Handheld Devices
- 5.2. Market Analysis, Insights and Forecast - by Product
- 5.2.1. AR Displays
- 5.2.2. AR Sensors
- 5.2.3. AR Input Devices
- 5.2.4. AR Semiconductor Components
- 5.2.5. Others
- 5.3. Market Analysis, Insights and Forecast - by End User
- 5.3.1. Hospitals and Clinics
- 5.3.2. Research Laboratories
- 5.3.3. Others
- 5.4. Market Analysis, Insights and Forecast - by Region
- 5.4.1. North America
- 5.4.2. Europe
- 5.4.3. Asia Pacific
- 5.4.4. Middle East and Africa
- 5.4.5. South America
- 5.1. Market Analysis, Insights and Forecast - by Technology
- 6. North America Augmented and Virtual Reality in Healthcare Market Analysis, Insights and Forecast, 2019-2031
- 6.1. Market Analysis, Insights and Forecast - by Technology
- 6.1.1. Head Mounted Devices
- 6.1.2. Handheld Devices
- 6.2. Market Analysis, Insights and Forecast - by Product
- 6.2.1. AR Displays
- 6.2.2. AR Sensors
- 6.2.3. AR Input Devices
- 6.2.4. AR Semiconductor Components
- 6.2.5. Others
- 6.3. Market Analysis, Insights and Forecast - by End User
- 6.3.1. Hospitals and Clinics
- 6.3.2. Research Laboratories
- 6.3.3. Others
- 6.1. Market Analysis, Insights and Forecast - by Technology
- 7. Europe Augmented and Virtual Reality in Healthcare Market Analysis, Insights and Forecast, 2019-2031
- 7.1. Market Analysis, Insights and Forecast - by Technology
- 7.1.1. Head Mounted Devices
- 7.1.2. Handheld Devices
- 7.2. Market Analysis, Insights and Forecast - by Product
- 7.2.1. AR Displays
- 7.2.2. AR Sensors
- 7.2.3. AR Input Devices
- 7.2.4. AR Semiconductor Components
- 7.2.5. Others
- 7.3. Market Analysis, Insights and Forecast - by End User
- 7.3.1. Hospitals and Clinics
- 7.3.2. Research Laboratories
- 7.3.3. Others
- 7.1. Market Analysis, Insights and Forecast - by Technology
- 8. Asia Pacific Augmented and Virtual Reality in Healthcare Market Analysis, Insights and Forecast, 2019-2031
- 8.1. Market Analysis, Insights and Forecast - by Technology
- 8.1.1. Head Mounted Devices
- 8.1.2. Handheld Devices
- 8.2. Market Analysis, Insights and Forecast - by Product
- 8.2.1. AR Displays
- 8.2.2. AR Sensors
- 8.2.3. AR Input Devices
- 8.2.4. AR Semiconductor Components
- 8.2.5. Others
- 8.3. Market Analysis, Insights and Forecast - by End User
- 8.3.1. Hospitals and Clinics
- 8.3.2. Research Laboratories
- 8.3.3. Others
- 8.1. Market Analysis, Insights and Forecast - by Technology
- 9. Middle East and Africa Augmented and Virtual Reality in Healthcare Market Analysis, Insights and Forecast, 2019-2031
- 9.1. Market Analysis, Insights and Forecast - by Technology
- 9.1.1. Head Mounted Devices
- 9.1.2. Handheld Devices
- 9.2. Market Analysis, Insights and Forecast - by Product
- 9.2.1. AR Displays
- 9.2.2. AR Sensors
- 9.2.3. AR Input Devices
- 9.2.4. AR Semiconductor Components
- 9.2.5. Others
- 9.3. Market Analysis, Insights and Forecast - by End User
- 9.3.1. Hospitals and Clinics
- 9.3.2. Research Laboratories
- 9.3.3. Others
- 9.1. Market Analysis, Insights and Forecast - by Technology
- 10. South America Augmented and Virtual Reality in Healthcare Market Analysis, Insights and Forecast, 2019-2031
- 10.1. Market Analysis, Insights and Forecast - by Technology
- 10.1.1. Head Mounted Devices
- 10.1.2. Handheld Devices
- 10.2. Market Analysis, Insights and Forecast - by Product
- 10.2.1. AR Displays
- 10.2.2. AR Sensors
- 10.2.3. AR Input Devices
- 10.2.4. AR Semiconductor Components
- 10.2.5. Others
- 10.3. Market Analysis, Insights and Forecast - by End User
- 10.3.1. Hospitals and Clinics
- 10.3.2. Research Laboratories
- 10.3.3. Others
- 10.1. Market Analysis, Insights and Forecast - by Technology
- 11. North America Augmented and Virtual Reality in Healthcare Market Analysis, Insights and Forecast, 2019-2031
- 11.1. Market Analysis, Insights and Forecast - By Country/Sub-region
- 11.1.1 United States
- 11.1.2 Canada
- 11.1.3 Mexico
- 12. Europe Augmented and Virtual Reality in Healthcare Market Analysis, Insights and Forecast, 2019-2031
- 12.1. Market Analysis, Insights and Forecast - By Country/Sub-region
- 12.1.1 Germany
- 12.1.2 United Kingdom
- 12.1.3 France
- 12.1.4 Italy
- 12.1.5 Spain
- 12.1.6 Rest of Europe
- 13. Asia Pacific Augmented and Virtual Reality in Healthcare Market Analysis, Insights and Forecast, 2019-2031
- 13.1. Market Analysis, Insights and Forecast - By Country/Sub-region
- 13.1.1 China
- 13.1.2 Japan
- 13.1.3 India
- 13.1.4 Australia
- 13.1.5 South Korea
- 13.1.6 Rest of Asia Pacific
- 14. Middle East and Africa Augmented and Virtual Reality in Healthcare Market Analysis, Insights and Forecast, 2019-2031
- 14.1. Market Analysis, Insights and Forecast - By Country/Sub-region
- 14.1.1 GCC
- 14.1.2 South Africa
- 14.1.3 Rest of Middle East and Africa
- 15. South America Augmented and Virtual Reality in Healthcare Market Analysis, Insights and Forecast, 2019-2031
- 15.1. Market Analysis, Insights and Forecast - By Country/Sub-region
- 15.1.1 Brazil
- 15.1.2 Argentina
- 15.1.3 Rest of South America
- 16. Competitive Analysis
- 16.1. Global Market Share Analysis 2024
- 16.2. Company Profiles
- 16.2.1 Microsoft
- 16.2.1.1. Overview
- 16.2.1.2. Products
- 16.2.1.3. SWOT Analysis
- 16.2.1.4. Recent Developments
- 16.2.1.5. Financials (Based on Availability)
- 16.2.2 Augmedix
- 16.2.2.1. Overview
- 16.2.2.2. Products
- 16.2.2.3. SWOT Analysis
- 16.2.2.4. Recent Developments
- 16.2.2.5. Financials (Based on Availability)
- 16.2.3 Orca Health Inc
- 16.2.3.1. Overview
- 16.2.3.2. Products
- 16.2.3.3. SWOT Analysis
- 16.2.3.4. Recent Developments
- 16.2.3.5. Financials (Based on Availability)
- 16.2.4 Intuitive Surgical
- 16.2.4.1. Overview
- 16.2.4.2. Products
- 16.2.4.3. SWOT Analysis
- 16.2.4.4. Recent Developments
- 16.2.4.5. Financials (Based on Availability)
- 16.2.5 EchoPixel
- 16.2.5.1. Overview
- 16.2.5.2. Products
- 16.2.5.3. SWOT Analysis
- 16.2.5.4. Recent Developments
- 16.2.5.5. Financials (Based on Availability)
- 16.2.6 Augmented Pixels Inc
- 16.2.6.1. Overview
- 16.2.6.2. Products
- 16.2.6.3. SWOT Analysis
- 16.2.6.4. Recent Developments
- 16.2.6.5. Financials (Based on Availability)
- 16.2.7 Siemens Healthineers
- 16.2.7.1. Overview
- 16.2.7.2. Products
- 16.2.7.3. SWOT Analysis
- 16.2.7.4. Recent Developments
- 16.2.7.5. Financials (Based on Availability)
- 16.2.8 Surgical Theater
- 16.2.8.1. Overview
- 16.2.8.2. Products
- 16.2.8.3. SWOT Analysis
- 16.2.8.4. Recent Developments
- 16.2.8.5. Financials (Based on Availability)
- 16.2.9 Koninklijke Philips N V
- 16.2.9.1. Overview
- 16.2.9.2. Products
- 16.2.9.3. SWOT Analysis
- 16.2.9.4. Recent Developments
- 16.2.9.5. Financials (Based on Availability)
- 16.2.10 Vuzix Corporation
- 16.2.10.1. Overview
- 16.2.10.2. Products
- 16.2.10.3. SWOT Analysis
- 16.2.10.4. Recent Developments
- 16.2.10.5. Financials (Based on Availability)
- 16.2.11 AccuVein Inc
- 16.2.11.1. Overview
- 16.2.11.2. Products
- 16.2.11.3. SWOT Analysis
- 16.2.11.4. Recent Developments
- 16.2.11.5. Financials (Based on Availability)
- 16.2.12 CAE Healthcare
- 16.2.12.1. Overview
- 16.2.12.2. Products
- 16.2.12.3. SWOT Analysis
- 16.2.12.4. Recent Developments
- 16.2.12.5. Financials (Based on Availability)
- 16.2.1 Microsoft
List of Figures
- Figure 1: Global Augmented and Virtual Reality in Healthcare Market Revenue Breakdown (Million, %) by Region 2024 & 2032
- Figure 2: Global Augmented and Virtual Reality in Healthcare Market Volume Breakdown (K Unit, %) by Region 2024 & 2032
- Figure 3: North America Augmented and Virtual Reality in Healthcare Market Revenue (Million), by Country 2024 & 2032
- Figure 4: North America Augmented and Virtual Reality in Healthcare Market Volume (K Unit), by Country 2024 & 2032
- Figure 5: North America Augmented and Virtual Reality in Healthcare Market Revenue Share (%), by Country 2024 & 2032
- Figure 6: North America Augmented and Virtual Reality in Healthcare Market Volume Share (%), by Country 2024 & 2032
- Figure 7: Europe Augmented and Virtual Reality in Healthcare Market Revenue (Million), by Country 2024 & 2032
- Figure 8: Europe Augmented and Virtual Reality in Healthcare Market Volume (K Unit), by Country 2024 & 2032
- Figure 9: Europe Augmented and Virtual Reality in Healthcare Market Revenue Share (%), by Country 2024 & 2032
- Figure 10: Europe Augmented and Virtual Reality in Healthcare Market Volume Share (%), by Country 2024 & 2032
- Figure 11: Asia Pacific Augmented and Virtual Reality in Healthcare Market Revenue (Million), by Country 2024 & 2032
- Figure 12: Asia Pacific Augmented and Virtual Reality in Healthcare Market Volume (K Unit), by Country 2024 & 2032
- Figure 13: Asia Pacific Augmented and Virtual Reality in Healthcare Market Revenue Share (%), by Country 2024 & 2032
- Figure 14: Asia Pacific Augmented and Virtual Reality in Healthcare Market Volume Share (%), by Country 2024 & 2032
- Figure 15: Middle East and Africa Augmented and Virtual Reality in Healthcare Market Revenue (Million), by Country 2024 & 2032
- Figure 16: Middle East and Africa Augmented and Virtual Reality in Healthcare Market Volume (K Unit), by Country 2024 & 2032
- Figure 17: Middle East and Africa Augmented and Virtual Reality in Healthcare Market Revenue Share (%), by Country 2024 & 2032
- Figure 18: Middle East and Africa Augmented and Virtual Reality in Healthcare Market Volume Share (%), by Country 2024 & 2032
- Figure 19: South America Augmented and Virtual Reality in Healthcare Market Revenue (Million), by Country 2024 & 2032
- Figure 20: South America Augmented and Virtual Reality in Healthcare Market Volume (K Unit), by Country 2024 & 2032
- Figure 21: South America Augmented and Virtual Reality in Healthcare Market Revenue Share (%), by Country 2024 & 2032
- Figure 22: South America Augmented and Virtual Reality in Healthcare Market Volume Share (%), by Country 2024 & 2032
- Figure 23: North America Augmented and Virtual Reality in Healthcare Market Revenue (Million), by Technology 2024 & 2032
- Figure 24: North America Augmented and Virtual Reality in Healthcare Market Volume (K Unit), by Technology 2024 & 2032
- Figure 25: North America Augmented and Virtual Reality in Healthcare Market Revenue Share (%), by Technology 2024 & 2032
- Figure 26: North America Augmented and Virtual Reality in Healthcare Market Volume Share (%), by Technology 2024 & 2032
- Figure 27: North America Augmented and Virtual Reality in Healthcare Market Revenue (Million), by Product 2024 & 2032
- Figure 28: North America Augmented and Virtual Reality in Healthcare Market Volume (K Unit), by Product 2024 & 2032
- Figure 29: North America Augmented and Virtual Reality in Healthcare Market Revenue Share (%), by Product 2024 & 2032
- Figure 30: North America Augmented and Virtual Reality in Healthcare Market Volume Share (%), by Product 2024 & 2032
- Figure 31: North America Augmented and Virtual Reality in Healthcare Market Revenue (Million), by End User 2024 & 2032
- Figure 32: North America Augmented and Virtual Reality in Healthcare Market Volume (K Unit), by End User 2024 & 2032
- Figure 33: North America Augmented and Virtual Reality in Healthcare Market Revenue Share (%), by End User 2024 & 2032
- Figure 34: North America Augmented and Virtual Reality in Healthcare Market Volume Share (%), by End User 2024 & 2032
- Figure 35: North America Augmented and Virtual Reality in Healthcare Market Revenue (Million), by Country 2024 & 2032
- Figure 36: North America Augmented and Virtual Reality in Healthcare Market Volume (K Unit), by Country 2024 & 2032
- Figure 37: North America Augmented and Virtual Reality in Healthcare Market Revenue Share (%), by Country 2024 & 2032
- Figure 38: North America Augmented and Virtual Reality in Healthcare Market Volume Share (%), by Country 2024 & 2032
- Figure 39: Europe Augmented and Virtual Reality in Healthcare Market Revenue (Million), by Technology 2024 & 2032
- Figure 40: Europe Augmented and Virtual Reality in Healthcare Market Volume (K Unit), by Technology 2024 & 2032
- Figure 41: Europe Augmented and Virtual Reality in Healthcare Market Revenue Share (%), by Technology 2024 & 2032
- Figure 42: Europe Augmented and Virtual Reality in Healthcare Market Volume Share (%), by Technology 2024 & 2032
- Figure 43: Europe Augmented and Virtual Reality in Healthcare Market Revenue (Million), by Product 2024 & 2032
- Figure 44: Europe Augmented and Virtual Reality in Healthcare Market Volume (K Unit), by Product 2024 & 2032
- Figure 45: Europe Augmented and Virtual Reality in Healthcare Market Revenue Share (%), by Product 2024 & 2032
- Figure 46: Europe Augmented and Virtual Reality in Healthcare Market Volume Share (%), by Product 2024 & 2032
- Figure 47: Europe Augmented and Virtual Reality in Healthcare Market Revenue (Million), by End User 2024 & 2032
- Figure 48: Europe Augmented and Virtual Reality in Healthcare Market Volume (K Unit), by End User 2024 & 2032
- Figure 49: Europe Augmented and Virtual Reality in Healthcare Market Revenue Share (%), by End User 2024 & 2032
- Figure 50: Europe Augmented and Virtual Reality in Healthcare Market Volume Share (%), by End User 2024 & 2032
- Figure 51: Europe Augmented and Virtual Reality in Healthcare Market Revenue (Million), by Country 2024 & 2032
- Figure 52: Europe Augmented and Virtual Reality in Healthcare Market Volume (K Unit), by Country 2024 & 2032
- Figure 53: Europe Augmented and Virtual Reality in Healthcare Market Revenue Share (%), by Country 2024 & 2032
- Figure 54: Europe Augmented and Virtual Reality in Healthcare Market Volume Share (%), by Country 2024 & 2032
- Figure 55: Asia Pacific Augmented and Virtual Reality in Healthcare Market Revenue (Million), by Technology 2024 & 2032
- Figure 56: Asia Pacific Augmented and Virtual Reality in Healthcare Market Volume (K Unit), by Technology 2024 & 2032
- Figure 57: Asia Pacific Augmented and Virtual Reality in Healthcare Market Revenue Share (%), by Technology 2024 & 2032
- Figure 58: Asia Pacific Augmented and Virtual Reality in Healthcare Market Volume Share (%), by Technology 2024 & 2032
- Figure 59: Asia Pacific Augmented and Virtual Reality in Healthcare Market Revenue (Million), by Product 2024 & 2032
- Figure 60: Asia Pacific Augmented and Virtual Reality in Healthcare Market Volume (K Unit), by Product 2024 & 2032
- Figure 61: Asia Pacific Augmented and Virtual Reality in Healthcare Market Revenue Share (%), by Product 2024 & 2032
- Figure 62: Asia Pacific Augmented and Virtual Reality in Healthcare Market Volume Share (%), by Product 2024 & 2032
- Figure 63: Asia Pacific Augmented and Virtual Reality in Healthcare Market Revenue (Million), by End User 2024 & 2032
- Figure 64: Asia Pacific Augmented and Virtual Reality in Healthcare Market Volume (K Unit), by End User 2024 & 2032
- Figure 65: Asia Pacific Augmented and Virtual Reality in Healthcare Market Revenue Share (%), by End User 2024 & 2032
- Figure 66: Asia Pacific Augmented and Virtual Reality in Healthcare Market Volume Share (%), by End User 2024 & 2032
- Figure 67: Asia Pacific Augmented and Virtual Reality in Healthcare Market Revenue (Million), by Country 2024 & 2032
- Figure 68: Asia Pacific Augmented and Virtual Reality in Healthcare Market Volume (K Unit), by Country 2024 & 2032
- Figure 69: Asia Pacific Augmented and Virtual Reality in Healthcare Market Revenue Share (%), by Country 2024 & 2032
- Figure 70: Asia Pacific Augmented and Virtual Reality in Healthcare Market Volume Share (%), by Country 2024 & 2032
- Figure 71: Middle East and Africa Augmented and Virtual Reality in Healthcare Market Revenue (Million), by Technology 2024 & 2032
- Figure 72: Middle East and Africa Augmented and Virtual Reality in Healthcare Market Volume (K Unit), by Technology 2024 & 2032
- Figure 73: Middle East and Africa Augmented and Virtual Reality in Healthcare Market Revenue Share (%), by Technology 2024 & 2032
- Figure 74: Middle East and Africa Augmented and Virtual Reality in Healthcare Market Volume Share (%), by Technology 2024 & 2032
- Figure 75: Middle East and Africa Augmented and Virtual Reality in Healthcare Market Revenue (Million), by Product 2024 & 2032
- Figure 76: Middle East and Africa Augmented and Virtual Reality in Healthcare Market Volume (K Unit), by Product 2024 & 2032
- Figure 77: Middle East and Africa Augmented and Virtual Reality in Healthcare Market Revenue Share (%), by Product 2024 & 2032
- Figure 78: Middle East and Africa Augmented and Virtual Reality in Healthcare Market Volume Share (%), by Product 2024 & 2032
- Figure 79: Middle East and Africa Augmented and Virtual Reality in Healthcare Market Revenue (Million), by End User 2024 & 2032
- Figure 80: Middle East and Africa Augmented and Virtual Reality in Healthcare Market Volume (K Unit), by End User 2024 & 2032
- Figure 81: Middle East and Africa Augmented and Virtual Reality in Healthcare Market Revenue Share (%), by End User 2024 & 2032
- Figure 82: Middle East and Africa Augmented and Virtual Reality in Healthcare Market Volume Share (%), by End User 2024 & 2032
- Figure 83: Middle East and Africa Augmented and Virtual Reality in Healthcare Market Revenue (Million), by Country 2024 & 2032
- Figure 84: Middle East and Africa Augmented and Virtual Reality in Healthcare Market Volume (K Unit), by Country 2024 & 2032
- Figure 85: Middle East and Africa Augmented and Virtual Reality in Healthcare Market Revenue Share (%), by Country 2024 & 2032
- Figure 86: Middle East and Africa Augmented and Virtual Reality in Healthcare Market Volume Share (%), by Country 2024 & 2032
- Figure 87: South America Augmented and Virtual Reality in Healthcare Market Revenue (Million), by Technology 2024 & 2032
- Figure 88: South America Augmented and Virtual Reality in Healthcare Market Volume (K Unit), by Technology 2024 & 2032
- Figure 89: South America Augmented and Virtual Reality in Healthcare Market Revenue Share (%), by Technology 2024 & 2032
- Figure 90: South America Augmented and Virtual Reality in Healthcare Market Volume Share (%), by Technology 2024 & 2032
- Figure 91: South America Augmented and Virtual Reality in Healthcare Market Revenue (Million), by Product 2024 & 2032
- Figure 92: South America Augmented and Virtual Reality in Healthcare Market Volume (K Unit), by Product 2024 & 2032
- Figure 93: South America Augmented and Virtual Reality in Healthcare Market Revenue Share (%), by Product 2024 & 2032
- Figure 94: South America Augmented and Virtual Reality in Healthcare Market Volume Share (%), by Product 2024 & 2032
- Figure 95: South America Augmented and Virtual Reality in Healthcare Market Revenue (Million), by End User 2024 & 2032
- Figure 96: South America Augmented and Virtual Reality in Healthcare Market Volume (K Unit), by End User 2024 & 2032
- Figure 97: South America Augmented and Virtual Reality in Healthcare Market Revenue Share (%), by End User 2024 & 2032
- Figure 98: South America Augmented and Virtual Reality in Healthcare Market Volume Share (%), by End User 2024 & 2032
- Figure 99: South America Augmented and Virtual Reality in Healthcare Market Revenue (Million), by Country 2024 & 2032
- Figure 100: South America Augmented and Virtual Reality in Healthcare Market Volume (K Unit), by Country 2024 & 2032
- Figure 101: South America Augmented and Virtual Reality in Healthcare Market Revenue Share (%), by Country 2024 & 2032
- Figure 102: South America Augmented and Virtual Reality in Healthcare Market Volume Share (%), by Country 2024 & 2032
List of Tables
- Table 1: Global Augmented and Virtual Reality in Healthcare Market Revenue Million Forecast, by Region 2019 & 2032
- Table 2: Global Augmented and Virtual Reality in Healthcare Market Volume K Unit Forecast, by Region 2019 & 2032
- Table 3: Global Augmented and Virtual Reality in Healthcare Market Revenue Million Forecast, by Technology 2019 & 2032
- Table 4: Global Augmented and Virtual Reality in Healthcare Market Volume K Unit Forecast, by Technology 2019 & 2032
- Table 5: Global Augmented and Virtual Reality in Healthcare Market Revenue Million Forecast, by Product 2019 & 2032
- Table 6: Global Augmented and Virtual Reality in Healthcare Market Volume K Unit Forecast, by Product 2019 & 2032
- Table 7: Global Augmented and Virtual Reality in Healthcare Market Revenue Million Forecast, by End User 2019 & 2032
- Table 8: Global Augmented and Virtual Reality in Healthcare Market Volume K Unit Forecast, by End User 2019 & 2032
- Table 9: Global Augmented and Virtual Reality in Healthcare Market Revenue Million Forecast, by Region 2019 & 2032
- Table 10: Global Augmented and Virtual Reality in Healthcare Market Volume K Unit Forecast, by Region 2019 & 2032
- Table 11: Global Augmented and Virtual Reality in Healthcare Market Revenue Million Forecast, by Country 2019 & 2032
- Table 12: Global Augmented and Virtual Reality in Healthcare Market Volume K Unit Forecast, by Country 2019 & 2032
- Table 13: United States Augmented and Virtual Reality in Healthcare Market Revenue (Million) Forecast, by Application 2019 & 2032
- Table 14: United States Augmented and Virtual Reality in Healthcare Market Volume (K Unit) Forecast, by Application 2019 & 2032
- Table 15: Canada Augmented and Virtual Reality in Healthcare Market Revenue (Million) Forecast, by Application 2019 & 2032
- Table 16: Canada Augmented and Virtual Reality in Healthcare Market Volume (K Unit) Forecast, by Application 2019 & 2032
- Table 17: Mexico Augmented and Virtual Reality in Healthcare Market Revenue (Million) Forecast, by Application 2019 & 2032
- Table 18: Mexico Augmented and Virtual Reality in Healthcare Market Volume (K Unit) Forecast, by Application 2019 & 2032
- Table 19: Global Augmented and Virtual Reality in Healthcare Market Revenue Million Forecast, by Country 2019 & 2032
- Table 20: Global Augmented and Virtual Reality in Healthcare Market Volume K Unit Forecast, by Country 2019 & 2032
- Table 21: Germany Augmented and Virtual Reality in Healthcare Market Revenue (Million) Forecast, by Application 2019 & 2032
- Table 22: Germany Augmented and Virtual Reality in Healthcare Market Volume (K Unit) Forecast, by Application 2019 & 2032
- Table 23: United Kingdom Augmented and Virtual Reality in Healthcare Market Revenue (Million) Forecast, by Application 2019 & 2032
- Table 24: United Kingdom Augmented and Virtual Reality in Healthcare Market Volume (K Unit) Forecast, by Application 2019 & 2032
- Table 25: France Augmented and Virtual Reality in Healthcare Market Revenue (Million) Forecast, by Application 2019 & 2032
- Table 26: France Augmented and Virtual Reality in Healthcare Market Volume (K Unit) Forecast, by Application 2019 & 2032
- Table 27: Italy Augmented and Virtual Reality in Healthcare Market Revenue (Million) Forecast, by Application 2019 & 2032
- Table 28: Italy Augmented and Virtual Reality in Healthcare Market Volume (K Unit) Forecast, by Application 2019 & 2032
- Table 29: Spain Augmented and Virtual Reality in Healthcare Market Revenue (Million) Forecast, by Application 2019 & 2032
- Table 30: Spain Augmented and Virtual Reality in Healthcare Market Volume (K Unit) Forecast, by Application 2019 & 2032
- Table 31: Rest of Europe Augmented and Virtual Reality in Healthcare Market Revenue (Million) Forecast, by Application 2019 & 2032
- Table 32: Rest of Europe Augmented and Virtual Reality in Healthcare Market Volume (K Unit) Forecast, by Application 2019 & 2032
- Table 33: Global Augmented and Virtual Reality in Healthcare Market Revenue Million Forecast, by Country 2019 & 2032
- Table 34: Global Augmented and Virtual Reality in Healthcare Market Volume K Unit Forecast, by Country 2019 & 2032
- Table 35: China Augmented and Virtual Reality in Healthcare Market Revenue (Million) Forecast, by Application 2019 & 2032
- Table 36: China Augmented and Virtual Reality in Healthcare Market Volume (K Unit) Forecast, by Application 2019 & 2032
- Table 37: Japan Augmented and Virtual Reality in Healthcare Market Revenue (Million) Forecast, by Application 2019 & 2032
- Table 38: Japan Augmented and Virtual Reality in Healthcare Market Volume (K Unit) Forecast, by Application 2019 & 2032
- Table 39: India Augmented and Virtual Reality in Healthcare Market Revenue (Million) Forecast, by Application 2019 & 2032
- Table 40: India Augmented and Virtual Reality in Healthcare Market Volume (K Unit) Forecast, by Application 2019 & 2032
- Table 41: Australia Augmented and Virtual Reality in Healthcare Market Revenue (Million) Forecast, by Application 2019 & 2032
- Table 42: Australia Augmented and Virtual Reality in Healthcare Market Volume (K Unit) Forecast, by Application 2019 & 2032
- Table 43: South Korea Augmented and Virtual Reality in Healthcare Market Revenue (Million) Forecast, by Application 2019 & 2032
- Table 44: South Korea Augmented and Virtual Reality in Healthcare Market Volume (K Unit) Forecast, by Application 2019 & 2032
- Table 45: Rest of Asia Pacific Augmented and Virtual Reality in Healthcare Market Revenue (Million) Forecast, by Application 2019 & 2032
- Table 46: Rest of Asia Pacific Augmented and Virtual Reality in Healthcare Market Volume (K Unit) Forecast, by Application 2019 & 2032
- Table 47: Global Augmented and Virtual Reality in Healthcare Market Revenue Million Forecast, by Country 2019 & 2032
- Table 48: Global Augmented and Virtual Reality in Healthcare Market Volume K Unit Forecast, by Country 2019 & 2032
- Table 49: GCC Augmented and Virtual Reality in Healthcare Market Revenue (Million) Forecast, by Application 2019 & 2032
- Table 50: GCC Augmented and Virtual Reality in Healthcare Market Volume (K Unit) Forecast, by Application 2019 & 2032
- Table 51: South Africa Augmented and Virtual Reality in Healthcare Market Revenue (Million) Forecast, by Application 2019 & 2032
- Table 52: South Africa Augmented and Virtual Reality in Healthcare Market Volume (K Unit) Forecast, by Application 2019 & 2032
- Table 53: Rest of Middle East and Africa Augmented and Virtual Reality in Healthcare Market Revenue (Million) Forecast, by Application 2019 & 2032
- Table 54: Rest of Middle East and Africa Augmented and Virtual Reality in Healthcare Market Volume (K Unit) Forecast, by Application 2019 & 2032
- Table 55: Global Augmented and Virtual Reality in Healthcare Market Revenue Million Forecast, by Country 2019 & 2032
- Table 56: Global Augmented and Virtual Reality in Healthcare Market Volume K Unit Forecast, by Country 2019 & 2032
- Table 57: Brazil Augmented and Virtual Reality in Healthcare Market Revenue (Million) Forecast, by Application 2019 & 2032
- Table 58: Brazil Augmented and Virtual Reality in Healthcare Market Volume (K Unit) Forecast, by Application 2019 & 2032
- Table 59: Argentina Augmented and Virtual Reality in Healthcare Market Revenue (Million) Forecast, by Application 2019 & 2032
- Table 60: Argentina Augmented and Virtual Reality in Healthcare Market Volume (K Unit) Forecast, by Application 2019 & 2032
- Table 61: Rest of South America Augmented and Virtual Reality in Healthcare Market Revenue (Million) Forecast, by Application 2019 & 2032
- Table 62: Rest of South America Augmented and Virtual Reality in Healthcare Market Volume (K Unit) Forecast, by Application 2019 & 2032
- Table 63: Global Augmented and Virtual Reality in Healthcare Market Revenue Million Forecast, by Technology 2019 & 2032
- Table 64: Global Augmented and Virtual Reality in Healthcare Market Volume K Unit Forecast, by Technology 2019 & 2032
- Table 65: Global Augmented and Virtual Reality in Healthcare Market Revenue Million Forecast, by Product 2019 & 2032
- Table 66: Global Augmented and Virtual Reality in Healthcare Market Volume K Unit Forecast, by Product 2019 & 2032
- Table 67: Global Augmented and Virtual Reality in Healthcare Market Revenue Million Forecast, by End User 2019 & 2032
- Table 68: Global Augmented and Virtual Reality in Healthcare Market Volume K Unit Forecast, by End User 2019 & 2032
- Table 69: Global Augmented and Virtual Reality in Healthcare Market Revenue Million Forecast, by Country 2019 & 2032
- Table 70: Global Augmented and Virtual Reality in Healthcare Market Volume K Unit Forecast, by Country 2019 & 2032
- Table 71: United States Augmented and Virtual Reality in Healthcare Market Revenue (Million) Forecast, by Application 2019 & 2032
- Table 72: United States Augmented and Virtual Reality in Healthcare Market Volume (K Unit) Forecast, by Application 2019 & 2032
- Table 73: Canada Augmented and Virtual Reality in Healthcare Market Revenue (Million) Forecast, by Application 2019 & 2032
- Table 74: Canada Augmented and Virtual Reality in Healthcare Market Volume (K Unit) Forecast, by Application 2019 & 2032
- Table 75: Mexico Augmented and Virtual Reality in Healthcare Market Revenue (Million) Forecast, by Application 2019 & 2032
- Table 76: Mexico Augmented and Virtual Reality in Healthcare Market Volume (K Unit) Forecast, by Application 2019 & 2032
- Table 77: Global Augmented and Virtual Reality in Healthcare Market Revenue Million Forecast, by Technology 2019 & 2032
- Table 78: Global Augmented and Virtual Reality in Healthcare Market Volume K Unit Forecast, by Technology 2019 & 2032
- Table 79: Global Augmented and Virtual Reality in Healthcare Market Revenue Million Forecast, by Product 2019 & 2032
- Table 80: Global Augmented and Virtual Reality in Healthcare Market Volume K Unit Forecast, by Product 2019 & 2032
- Table 81: Global Augmented and Virtual Reality in Healthcare Market Revenue Million Forecast, by End User 2019 & 2032
- Table 82: Global Augmented and Virtual Reality in Healthcare Market Volume K Unit Forecast, by End User 2019 & 2032
- Table 83: Global Augmented and Virtual Reality in Healthcare Market Revenue Million Forecast, by Country 2019 & 2032
- Table 84: Global Augmented and Virtual Reality in Healthcare Market Volume K Unit Forecast, by Country 2019 & 2032
- Table 85: Germany Augmented and Virtual Reality in Healthcare Market Revenue (Million) Forecast, by Application 2019 & 2032
- Table 86: Germany Augmented and Virtual Reality in Healthcare Market Volume (K Unit) Forecast, by Application 2019 & 2032
- Table 87: United Kingdom Augmented and Virtual Reality in Healthcare Market Revenue (Million) Forecast, by Application 2019 & 2032
- Table 88: United Kingdom Augmented and Virtual Reality in Healthcare Market Volume (K Unit) Forecast, by Application 2019 & 2032
- Table 89: France Augmented and Virtual Reality in Healthcare Market Revenue (Million) Forecast, by Application 2019 & 2032
- Table 90: France Augmented and Virtual Reality in Healthcare Market Volume (K Unit) Forecast, by Application 2019 & 2032
- Table 91: Italy Augmented and Virtual Reality in Healthcare Market Revenue (Million) Forecast, by Application 2019 & 2032
- Table 92: Italy Augmented and Virtual Reality in Healthcare Market Volume (K Unit) Forecast, by Application 2019 & 2032
- Table 93: Spain Augmented and Virtual Reality in Healthcare Market Revenue (Million) Forecast, by Application 2019 & 2032
- Table 94: Spain Augmented and Virtual Reality in Healthcare Market Volume (K Unit) Forecast, by Application 2019 & 2032
- Table 95: Rest of Europe Augmented and Virtual Reality in Healthcare Market Revenue (Million) Forecast, by Application 2019 & 2032
- Table 96: Rest of Europe Augmented and Virtual Reality in Healthcare Market Volume (K Unit) Forecast, by Application 2019 & 2032
- Table 97: Global Augmented and Virtual Reality in Healthcare Market Revenue Million Forecast, by Technology 2019 & 2032
- Table 98: Global Augmented and Virtual Reality in Healthcare Market Volume K Unit Forecast, by Technology 2019 & 2032
- Table 99: Global Augmented and Virtual Reality in Healthcare Market Revenue Million Forecast, by Product 2019 & 2032
- Table 100: Global Augmented and Virtual Reality in Healthcare Market Volume K Unit Forecast, by Product 2019 & 2032
- Table 101: Global Augmented and Virtual Reality in Healthcare Market Revenue Million Forecast, by End User 2019 & 2032
- Table 102: Global Augmented and Virtual Reality in Healthcare Market Volume K Unit Forecast, by End User 2019 & 2032
- Table 103: Global Augmented and Virtual Reality in Healthcare Market Revenue Million Forecast, by Country 2019 & 2032
- Table 104: Global Augmented and Virtual Reality in Healthcare Market Volume K Unit Forecast, by Country 2019 & 2032
- Table 105: China Augmented and Virtual Reality in Healthcare Market Revenue (Million) Forecast, by Application 2019 & 2032
- Table 106: China Augmented and Virtual Reality in Healthcare Market Volume (K Unit) Forecast, by Application 2019 & 2032
- Table 107: Japan Augmented and Virtual Reality in Healthcare Market Revenue (Million) Forecast, by Application 2019 & 2032
- Table 108: Japan Augmented and Virtual Reality in Healthcare Market Volume (K Unit) Forecast, by Application 2019 & 2032
- Table 109: India Augmented and Virtual Reality in Healthcare Market Revenue (Million) Forecast, by Application 2019 & 2032
- Table 110: India Augmented and Virtual Reality in Healthcare Market Volume (K Unit) Forecast, by Application 2019 & 2032
- Table 111: Australia Augmented and Virtual Reality in Healthcare Market Revenue (Million) Forecast, by Application 2019 & 2032
- Table 112: Australia Augmented and Virtual Reality in Healthcare Market Volume (K Unit) Forecast, by Application 2019 & 2032
- Table 113: South Korea Augmented and Virtual Reality in Healthcare Market Revenue (Million) Forecast, by Application 2019 & 2032
- Table 114: South Korea Augmented and Virtual Reality in Healthcare Market Volume (K Unit) Forecast, by Application 2019 & 2032
- Table 115: Rest of Asia Pacific Augmented and Virtual Reality in Healthcare Market Revenue (Million) Forecast, by Application 2019 & 2032
- Table 116: Rest of Asia Pacific Augmented and Virtual Reality in Healthcare Market Volume (K Unit) Forecast, by Application 2019 & 2032
- Table 117: Global Augmented and Virtual Reality in Healthcare Market Revenue Million Forecast, by Technology 2019 & 2032
- Table 118: Global Augmented and Virtual Reality in Healthcare Market Volume K Unit Forecast, by Technology 2019 & 2032
- Table 119: Global Augmented and Virtual Reality in Healthcare Market Revenue Million Forecast, by Product 2019 & 2032
- Table 120: Global Augmented and Virtual Reality in Healthcare Market Volume K Unit Forecast, by Product 2019 & 2032
- Table 121: Global Augmented and Virtual Reality in Healthcare Market Revenue Million Forecast, by End User 2019 & 2032
- Table 122: Global Augmented and Virtual Reality in Healthcare Market Volume K Unit Forecast, by End User 2019 & 2032
- Table 123: Global Augmented and Virtual Reality in Healthcare Market Revenue Million Forecast, by Country 2019 & 2032
- Table 124: Global Augmented and Virtual Reality in Healthcare Market Volume K Unit Forecast, by Country 2019 & 2032
- Table 125: GCC Augmented and Virtual Reality in Healthcare Market Revenue (Million) Forecast, by Application 2019 & 2032
- Table 126: GCC Augmented and Virtual Reality in Healthcare Market Volume (K Unit) Forecast, by Application 2019 & 2032
- Table 127: South Africa Augmented and Virtual Reality in Healthcare Market Revenue (Million) Forecast, by Application 2019 & 2032
- Table 128: South Africa Augmented and Virtual Reality in Healthcare Market Volume (K Unit) Forecast, by Application 2019 & 2032
- Table 129: Rest of Middle East and Africa Augmented and Virtual Reality in Healthcare Market Revenue (Million) Forecast, by Application 2019 & 2032
- Table 130: Rest of Middle East and Africa Augmented and Virtual Reality in Healthcare Market Volume (K Unit) Forecast, by Application 2019 & 2032
- Table 131: Global Augmented and Virtual Reality in Healthcare Market Revenue Million Forecast, by Technology 2019 & 2032
- Table 132: Global Augmented and Virtual Reality in Healthcare Market Volume K Unit Forecast, by Technology 2019 & 2032
- Table 133: Global Augmented and Virtual Reality in Healthcare Market Revenue Million Forecast, by Product 2019 & 2032
- Table 134: Global Augmented and Virtual Reality in Healthcare Market Volume K Unit Forecast, by Product 2019 & 2032
- Table 135: Global Augmented and Virtual Reality in Healthcare Market Revenue Million Forecast, by End User 2019 & 2032
- Table 136: Global Augmented and Virtual Reality in Healthcare Market Volume K Unit Forecast, by End User 2019 & 2032
- Table 137: Global Augmented and Virtual Reality in Healthcare Market Revenue Million Forecast, by Country 2019 & 2032
- Table 138: Global Augmented and Virtual Reality in Healthcare Market Volume K Unit Forecast, by Country 2019 & 2032
- Table 139: Brazil Augmented and Virtual Reality in Healthcare Market Revenue (Million) Forecast, by Application 2019 & 2032
- Table 140: Brazil Augmented and Virtual Reality in Healthcare Market Volume (K Unit) Forecast, by Application 2019 & 2032
- Table 141: Argentina Augmented and Virtual Reality in Healthcare Market Revenue (Million) Forecast, by Application 2019 & 2032
- Table 142: Argentina Augmented and Virtual Reality in Healthcare Market Volume (K Unit) Forecast, by Application 2019 & 2032
- Table 143: Rest of South America Augmented and Virtual Reality in Healthcare Market Revenue (Million) Forecast, by Application 2019 & 2032
- Table 144: Rest of South America Augmented and Virtual Reality in Healthcare Market Volume (K Unit) Forecast, by Application 2019 & 2032
Frequently Asked Questions
1. What is the projected Compound Annual Growth Rate (CAGR) of the Augmented and Virtual Reality in Healthcare Market?
The projected CAGR is approximately 26.99%.
2. Which companies are prominent players in the Augmented and Virtual Reality in Healthcare Market?
Key companies in the market include Microsoft, Augmedix, Orca Health Inc, Intuitive Surgical, EchoPixel, Augmented Pixels Inc, Siemens Healthineers, Surgical Theater, Koninklijke Philips N V, Vuzix Corporation, AccuVein Inc, CAE Healthcare.
3. What are the main segments of the Augmented and Virtual Reality in Healthcare Market?
The market segments include Technology, Product, End User.
4. Can you provide details about the market size?
The market size is estimated to be USD 1.19 Million as of 2022.
5. What are some drivers contributing to market growth?
Rise in Adoption of Augmented Reality in Healthcare; Increase in Investments in Augmented Reality; Rise in Number of Start Up Companies in the Market.
6. What are the notable trends driving market growth?
Head-Mounted Devices Segment is Expected to Hold a Significant Share in the Market Over the Forecast Period.
7. Are there any restraints impacting market growth?
High Cost of Augmented Reality Products; Data Security Concers.
8. Can you provide examples of recent developments in the market?
N/A
9. What pricing options are available for accessing the report?
Pricing options include single-user, multi-user, and enterprise licenses priced at USD 4750, USD 5250, and USD 8750 respectively.
10. Is the market size provided in terms of value or volume?
The market size is provided in terms of value, measured in Million and volume, measured in K Unit.
11. Are there any specific market keywords associated with the report?
Yes, the market keyword associated with the report is "Augmented and Virtual Reality in Healthcare Market," which aids in identifying and referencing the specific market segment covered.
12. How do I determine which pricing option suits my needs best?
The pricing options vary based on user requirements and access needs. Individual users may opt for single-user licenses, while businesses requiring broader access may choose multi-user or enterprise licenses for cost-effective access to the report.
13. Are there any additional resources or data provided in the Augmented and Virtual Reality in Healthcare Market report?
While the report offers comprehensive insights, it's advisable to review the specific contents or supplementary materials provided to ascertain if additional resources or data are available.
14. How can I stay updated on further developments or reports in the Augmented and Virtual Reality in Healthcare Market?
To stay informed about further developments, trends, and reports in the Augmented and Virtual Reality in Healthcare Market, consider subscribing to industry newsletters, following relevant companies and organizations, or regularly checking reputable industry news sources and publications.
Methodology
Step 1 - Identification of Relevant Samples Size from Population Database


Step 2 - Approaches for Defining Global Market Size (Value, Volume* & Price*)

Note*: In applicable scenarios
Step 3 - Data Sources
Primary Research
- Web Analytics
- Survey Reports
- Research Institute
- Latest Research Reports
- Opinion Leaders
Secondary Research
- Annual Reports
- White Paper
- Latest Press Release
- Industry Association
- Paid Database
- Investor Presentations

Step 4 - Data Triangulation
Involves using different sources of information in order to increase the validity of a study
These sources are likely to be stakeholders in a program - participants, other researchers, program staff, other community members, and so on.
Then we put all data in single framework & apply various statistical tools to find out the dynamic on the market.
During the analysis stage, feedback from the stakeholder groups would be compared to determine areas of agreement as well as areas of divergence
