

Key Insights
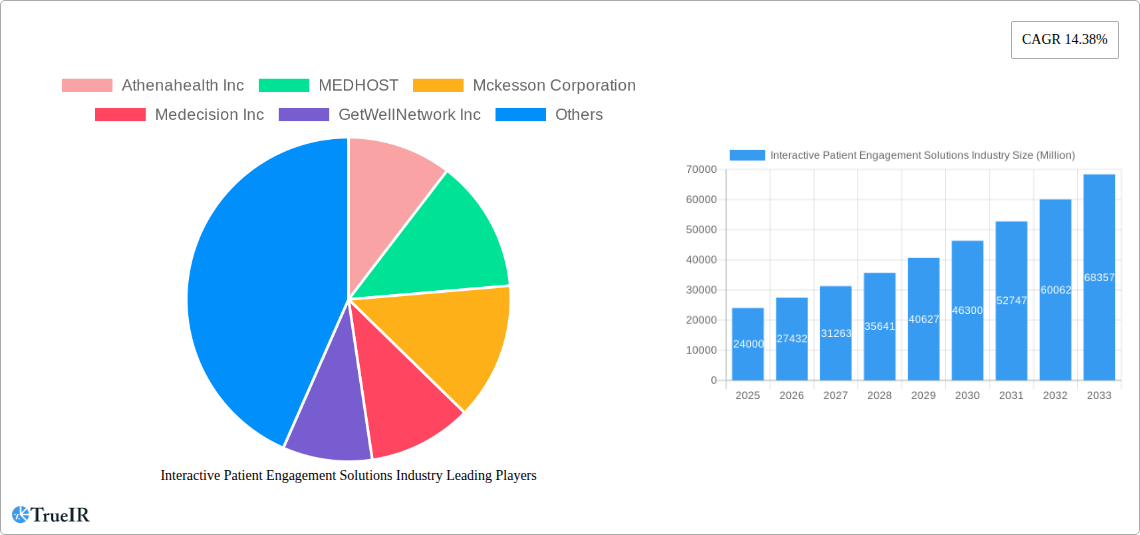
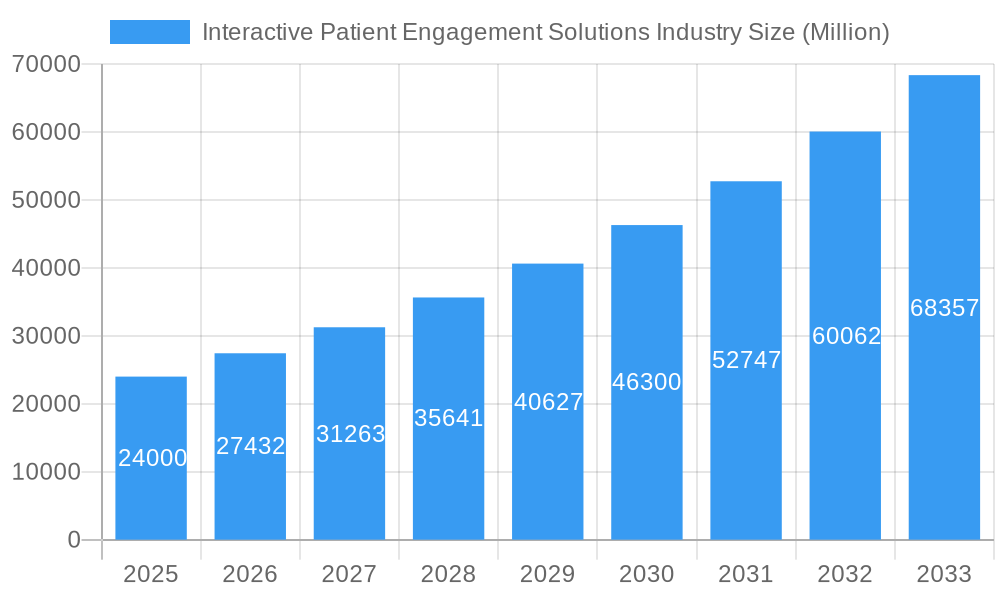
The Interactive Patient Engagement Solutions (IPES) market is experiencing robust growth, projected to reach $24 billion in 2025 and exhibiting a Compound Annual Growth Rate (CAGR) of 14.38% from 2025 to 2033. This expansion is fueled by several key factors. The increasing prevalence of chronic diseases necessitates proactive patient management, driving demand for remote monitoring and personalized care solutions. Technological advancements, such as the proliferation of mobile health (mHealth) apps and telehealth platforms, are significantly enhancing patient engagement and improving health outcomes. Furthermore, a growing emphasis on value-based care models incentivizes providers to improve patient satisfaction and reduce readmission rates, further bolstering the adoption of IPES. The market's segmentation across hardware, software, and services reflects its diverse offerings, with cloud-based and web-based delivery modes gaining significant traction due to their scalability and accessibility. Major applications include social management, fitness and health management, home healthcare management, and financial management, catering to a broad spectrum of healthcare needs. Key players like Athenahealth, McKesson, and Cerner are actively shaping the market landscape through innovation and strategic partnerships. North America currently dominates the market, driven by high healthcare expenditure and advanced technological infrastructure, but Asia-Pacific is poised for significant growth due to increasing healthcare awareness and digitalization initiatives.
Interactive Patient Engagement Solutions Industry Market Size (In Billion)
The sustained growth of the IPES market is anticipated to continue throughout the forecast period, driven by increasing patient demand for personalized and convenient healthcare. Government initiatives promoting telehealth and digital health are expected to further propel market expansion. However, challenges such as data security and privacy concerns, along with the need for robust interoperability standards, need addressing to ensure widespread adoption and prevent potential market restraints. The competitive landscape is characterized by both established players and emerging technology companies, leading to continuous innovation and improvement in the offerings available to patients and providers. The future of the IPES market hinges on the ability of stakeholders to effectively address these challenges and capitalize on the opportunities presented by technological advancements and evolving healthcare delivery models. This will lead to further improvements in patient outcomes and contribute to the overall efficiency and effectiveness of the healthcare system.
Interactive Patient Engagement Solutions Industry Company Market Share
Interactive Patient Engagement Solutions Industry Market Report: 2019-2033
This comprehensive report provides a detailed analysis of the Interactive Patient Engagement Solutions industry, covering market size, growth projections, key players, and future trends. The study period spans from 2019 to 2033, with a base year of 2025 and a forecast period of 2025-2033. The report incorporates data from the historical period of 2019-2024, revealing a market valued at $XX Million in 2024, projected to reach $XX Million by 2033, exhibiting a CAGR of XX%. This report is invaluable for investors, healthcare providers, technology companies, and anyone seeking a deep understanding of this rapidly evolving market.
Interactive Patient Engagement Solutions Industry Market Structure & Competitive Landscape
The Interactive Patient Engagement Solutions market exhibits a moderately consolidated structure, with a few major players holding significant market share. However, the presence of numerous smaller niche players contributes to a dynamic competitive landscape. The Herfindahl-Hirschman Index (HHI) for the market is estimated at XX, indicating a moderately concentrated market. Innovation is a key driver, with companies continuously developing new features and functionalities to enhance patient engagement and improve healthcare outcomes. Regulatory changes, particularly around data privacy and security (HIPAA, GDPR), significantly impact market operations and necessitate compliance investments. While there are no direct substitutes for comprehensive patient engagement solutions, alternative approaches, such as traditional communication methods, remain present, though increasingly less effective.
End-user segmentation plays a crucial role, with Providers (hospitals, clinics), Payers (insurance companies), and Patients themselves representing the primary user groups. The market is witnessing a surge in mergers and acquisitions (M&A) activity, with an estimated XX M&A deals completed in the past 5 years. This consolidates market share and facilitates technology integration.
- Key Market Dynamics:
- Moderately Consolidated Market Structure (HHI: XX)
- Strong Innovation Driver
- Significant Regulatory Impact (HIPAA, GDPR)
- Limited Direct Substitutes
- Diverse End-User Segmentation (Provider, Payer, Patient)
- Active M&A Activity (XX deals in past 5 years)
Interactive Patient Engagement Solutions Industry Market Trends & Opportunities
The Interactive Patient Engagement Solutions market is experiencing robust growth, fueled by increasing adoption of digital health technologies, a rising demand for personalized healthcare, and the growing importance of patient-centric care models. The market is witnessing a shift towards cloud-based and web-based solutions, driven by their scalability, accessibility, and cost-effectiveness. Consumer preferences are gravitating toward user-friendly, integrated platforms that offer seamless access to healthcare information and services. Competitive dynamics are intensifying, with established players facing challenges from agile startups and technology giants entering the market.
The market size growth is projected to be substantial, with a notable increase in market penetration rates, particularly in developed economies. Technological shifts, such as the increasing integration of Artificial Intelligence (AI) and machine learning, are reshaping the competitive landscape. The market is also witnessing increasing adoption of telehealth and remote patient monitoring solutions, creating significant growth opportunities.
- Key Trends:
- Shift towards Cloud-based and Web-based solutions
- Growing demand for personalized healthcare
- Increasing adoption of telehealth and remote patient monitoring
- Intensifying competitive dynamics
- Integration of AI and machine learning
Dominant Markets & Segments in Interactive Patient Engagement Solutions Industry
The North American region currently dominates the Interactive Patient Engagement Solutions market, driven by factors such as robust healthcare infrastructure, advanced technology adoption, and favorable regulatory environment. Within North America, the United States holds the largest market share. The Software segment commands the largest revenue share, followed by the Service segment. Cloud-based solutions are witnessing faster adoption compared to on-premise solutions.
Key Growth Drivers:
- North America: Advanced healthcare infrastructure, high technology adoption, favorable regulatory environment
- Software Segment: Increasing demand for sophisticated patient engagement platforms
- Cloud-based Solutions: Scalability, accessibility, and cost-effectiveness
- Patient End-User: Growing consumer demand for digital healthcare services
Dominant Segments:
- Region: North America (United States)
- Component: Software
- Delivery Mode: Cloud-based
- Application: Fitness and Health Management
Interactive Patient Engagement Solutions Industry Product Analysis
Product innovations are centered around improving user experience, enhancing data security and interoperability, and integrating advanced technologies like AI and machine learning for personalized interventions. Applications span across social management, fitness tracking, remote patient monitoring, and financial management tools. Competitive advantages stem from superior user interfaces, robust security protocols, data analytics capabilities, and the ability to integrate with existing healthcare systems. The market is witnessing a growing trend of integrated platforms offering a comprehensive suite of patient engagement functionalities.
Key Drivers, Barriers & Challenges in Interactive Patient Engagement Solutions Industry
Key Drivers: The increasing adoption of digital health technologies, growing demand for patient-centric care, and the rising prevalence of chronic diseases are major drivers. Government initiatives promoting telehealth and digital health are further fueling market growth. Technological advancements, such as AI and machine learning, provide opportunities for personalized interventions and improved healthcare outcomes.
Key Challenges: Data security and privacy concerns, high implementation costs, and the need for interoperability between different healthcare systems are major challenges. Regulatory hurdles and compliance requirements, particularly around data privacy (HIPAA, GDPR), present significant obstacles. The competitive landscape is also intense, with both established players and new entrants vying for market share.
Growth Drivers in the Interactive Patient Engagement Solutions Industry Market
The market is propelled by the increasing adoption of telehealth and remote patient monitoring solutions, the growing demand for personalized and proactive healthcare, and the continuous advancements in technology. Government initiatives and regulations supporting digital health are also boosting growth. Improved integration with existing EHR systems and a focus on user experience further enhance market expansion.
Challenges Impacting Interactive Patient Engagement Solutions Industry Growth
Data security and interoperability remain significant challenges, alongside the high initial investment costs for implementation and integration. Regulatory complexities and the potential for fragmented adoption across different healthcare providers pose further hurdles. Competition from existing and new market players adds pressure, requiring continuous innovation and value-added services.
Key Players Shaping the Interactive Patient Engagement Solutions Industry Market
- Athenahealth Inc
- MEDHOST
- Mckesson Corporation
- Medecision Inc
- GetWellNetwork Inc
- Orion Health Ltd
- Cerner Corporation
- Welvu
- Lincor Solutions
- Yourcareuniverse Inc
- Allscripts Healthcare Solutions Inc
- IBM
Significant Interactive Patient Engagement Solutions Industry Industry Milestones
- March 2022: DeliverHealth launched its partner program, aimed at expanding its reach and improving healthcare outcomes.
- March 2022: Epic launched "Cheers," a CRM technology designed to improve patient connection and address challenges faced during the COVID-19 pandemic.
Future Outlook for Interactive Patient Engagement Solutions Industry Market
The future of the Interactive Patient Engagement Solutions market is bright, with continued growth driven by technological advancements, increasing adoption of digital health technologies, and a greater emphasis on patient-centric care. Strategic opportunities exist in developing innovative solutions that address the challenges of data security, interoperability, and personalized healthcare. The market is poised for significant expansion, fueled by both organic growth and strategic acquisitions.
Interactive Patient Engagement Solutions Industry Segmentation
-
1. Component
- 1.1. Hardware
- 1.2. Software
- 1.3. Service
-
2. Delivery Mode
- 2.1. Web-based and Cloud-based
- 2.2. On-Premise
-
3. Application
- 3.1. Social Management
- 3.2. Fitness and Health Management
- 3.3. Home Healthcare Management
- 3.4. Financial Management
-
4. End User
- 4.1. Provider
- 4.2. Payer
- 4.3. Patient
- 4.4. Other End Users
Interactive Patient Engagement Solutions Industry Segmentation By Geography
-
1. North America
- 1.1. United States
- 1.2. Canada
- 1.3. Mexico
-
2. Europe
- 2.1. Germany
- 2.2. United Kingdom
- 2.3. France
- 2.4. Italy
- 2.5. Spain
- 2.6. Rest of Europe
-
3. Asia Pacific
- 3.1. China
- 3.2. Japan
- 3.3. India
- 3.4. Australia
- 3.5. South Korea
- 3.6. Rest of Asia Pacific
-
4. Middle East and Africa
- 4.1. GCC
- 4.2. South Africa
- 4.3. Rest of Middle East and Africa
-
5. South America
- 5.1. Brazil
- 5.2. Argentina
- 5.3. Rest of South America
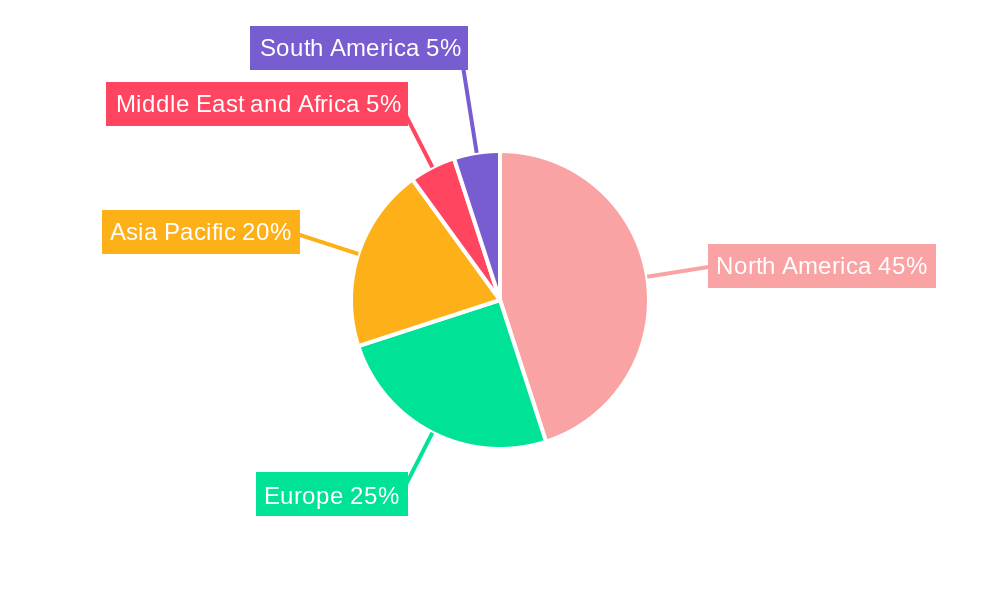
Interactive Patient Engagement Solutions Industry Regional Market Share
Geographic Coverage of Interactive Patient Engagement Solutions Industry
Interactive Patient Engagement Solutions Industry REPORT HIGHLIGHTS
| Aspects | Details |
|---|---|
| Study Period | 2020-2034 |
| Base Year | 2025 |
| Estimated Year | 2026 |
| Forecast Period | 2026-2034 |
| Historical Period | 2020-2025 |
| Growth Rate | CAGR of 14.38% from 2020-2034 |
| Segmentation |
|
Table of Contents
- 1. Introduction
- 1.1. Research Scope
- 1.2. Market Segmentation
- 1.3. Research Methodology
- 1.4. Definitions and Assumptions
- 2. Executive Summary
- 2.1. Introduction
- 3. Market Dynamics
- 3.1. Introduction
- 3.2. Market Drivers
- 3.2.1. Rising Trend of Mobile Health Applications; Growing Popularity of Patient Engagement Solutions Among the Aging Population; Rising Investments and Technological advancements
- 3.3. Market Restrains
- 3.3.1. Protection of Patient Information; Lack of Skilled IT Professionals in the Healthcare Industry
- 3.4. Market Trends
- 3.4.1. Web-based and Cloud-based Services Segment is Expected to Witness Growth Over the Forecast Period
- 4. Market Factor Analysis
- 4.1. Porters Five Forces
- 4.2. Supply/Value Chain
- 4.3. PESTEL analysis
- 4.4. Market Entropy
- 4.5. Patent/Trademark Analysis
- 5. Global Interactive Patient Engagement Solutions Industry Analysis, Insights and Forecast, 2020-2032
- 5.1. Market Analysis, Insights and Forecast - by Component
- 5.1.1. Hardware
- 5.1.2. Software
- 5.1.3. Service
- 5.2. Market Analysis, Insights and Forecast - by Delivery Mode
- 5.2.1. Web-based and Cloud-based
- 5.2.2. On-Premise
- 5.3. Market Analysis, Insights and Forecast - by Application
- 5.3.1. Social Management
- 5.3.2. Fitness and Health Management
- 5.3.3. Home Healthcare Management
- 5.3.4. Financial Management
- 5.4. Market Analysis, Insights and Forecast - by End User
- 5.4.1. Provider
- 5.4.2. Payer
- 5.4.3. Patient
- 5.4.4. Other End Users
- 5.5. Market Analysis, Insights and Forecast - by Region
- 5.5.1. North America
- 5.5.2. Europe
- 5.5.3. Asia Pacific
- 5.5.4. Middle East and Africa
- 5.5.5. South America
- 5.1. Market Analysis, Insights and Forecast - by Component
- 6. North America Interactive Patient Engagement Solutions Industry Analysis, Insights and Forecast, 2020-2032
- 6.1. Market Analysis, Insights and Forecast - by Component
- 6.1.1. Hardware
- 6.1.2. Software
- 6.1.3. Service
- 6.2. Market Analysis, Insights and Forecast - by Delivery Mode
- 6.2.1. Web-based and Cloud-based
- 6.2.2. On-Premise
- 6.3. Market Analysis, Insights and Forecast - by Application
- 6.3.1. Social Management
- 6.3.2. Fitness and Health Management
- 6.3.3. Home Healthcare Management
- 6.3.4. Financial Management
- 6.4. Market Analysis, Insights and Forecast - by End User
- 6.4.1. Provider
- 6.4.2. Payer
- 6.4.3. Patient
- 6.4.4. Other End Users
- 6.1. Market Analysis, Insights and Forecast - by Component
- 7. Europe Interactive Patient Engagement Solutions Industry Analysis, Insights and Forecast, 2020-2032
- 7.1. Market Analysis, Insights and Forecast - by Component
- 7.1.1. Hardware
- 7.1.2. Software
- 7.1.3. Service
- 7.2. Market Analysis, Insights and Forecast - by Delivery Mode
- 7.2.1. Web-based and Cloud-based
- 7.2.2. On-Premise
- 7.3. Market Analysis, Insights and Forecast - by Application
- 7.3.1. Social Management
- 7.3.2. Fitness and Health Management
- 7.3.3. Home Healthcare Management
- 7.3.4. Financial Management
- 7.4. Market Analysis, Insights and Forecast - by End User
- 7.4.1. Provider
- 7.4.2. Payer
- 7.4.3. Patient
- 7.4.4. Other End Users
- 7.1. Market Analysis, Insights and Forecast - by Component
- 8. Asia Pacific Interactive Patient Engagement Solutions Industry Analysis, Insights and Forecast, 2020-2032
- 8.1. Market Analysis, Insights and Forecast - by Component
- 8.1.1. Hardware
- 8.1.2. Software
- 8.1.3. Service
- 8.2. Market Analysis, Insights and Forecast - by Delivery Mode
- 8.2.1. Web-based and Cloud-based
- 8.2.2. On-Premise
- 8.3. Market Analysis, Insights and Forecast - by Application
- 8.3.1. Social Management
- 8.3.2. Fitness and Health Management
- 8.3.3. Home Healthcare Management
- 8.3.4. Financial Management
- 8.4. Market Analysis, Insights and Forecast - by End User
- 8.4.1. Provider
- 8.4.2. Payer
- 8.4.3. Patient
- 8.4.4. Other End Users
- 8.1. Market Analysis, Insights and Forecast - by Component
- 9. Middle East and Africa Interactive Patient Engagement Solutions Industry Analysis, Insights and Forecast, 2020-2032
- 9.1. Market Analysis, Insights and Forecast - by Component
- 9.1.1. Hardware
- 9.1.2. Software
- 9.1.3. Service
- 9.2. Market Analysis, Insights and Forecast - by Delivery Mode
- 9.2.1. Web-based and Cloud-based
- 9.2.2. On-Premise
- 9.3. Market Analysis, Insights and Forecast - by Application
- 9.3.1. Social Management
- 9.3.2. Fitness and Health Management
- 9.3.3. Home Healthcare Management
- 9.3.4. Financial Management
- 9.4. Market Analysis, Insights and Forecast - by End User
- 9.4.1. Provider
- 9.4.2. Payer
- 9.4.3. Patient
- 9.4.4. Other End Users
- 9.1. Market Analysis, Insights and Forecast - by Component
- 10. South America Interactive Patient Engagement Solutions Industry Analysis, Insights and Forecast, 2020-2032
- 10.1. Market Analysis, Insights and Forecast - by Component
- 10.1.1. Hardware
- 10.1.2. Software
- 10.1.3. Service
- 10.2. Market Analysis, Insights and Forecast - by Delivery Mode
- 10.2.1. Web-based and Cloud-based
- 10.2.2. On-Premise
- 10.3. Market Analysis, Insights and Forecast - by Application
- 10.3.1. Social Management
- 10.3.2. Fitness and Health Management
- 10.3.3. Home Healthcare Management
- 10.3.4. Financial Management
- 10.4. Market Analysis, Insights and Forecast - by End User
- 10.4.1. Provider
- 10.4.2. Payer
- 10.4.3. Patient
- 10.4.4. Other End Users
- 10.1. Market Analysis, Insights and Forecast - by Component
- 11. Competitive Analysis
- 11.1. Global Market Share Analysis 2025
- 11.2. Company Profiles
- 11.2.1 Athenahealth Inc
- 11.2.1.1. Overview
- 11.2.1.2. Products
- 11.2.1.3. SWOT Analysis
- 11.2.1.4. Recent Developments
- 11.2.1.5. Financials (Based on Availability)
- 11.2.2 MEDHOST
- 11.2.2.1. Overview
- 11.2.2.2. Products
- 11.2.2.3. SWOT Analysis
- 11.2.2.4. Recent Developments
- 11.2.2.5. Financials (Based on Availability)
- 11.2.3 Mckesson Corporation
- 11.2.3.1. Overview
- 11.2.3.2. Products
- 11.2.3.3. SWOT Analysis
- 11.2.3.4. Recent Developments
- 11.2.3.5. Financials (Based on Availability)
- 11.2.4 Medecision Inc
- 11.2.4.1. Overview
- 11.2.4.2. Products
- 11.2.4.3. SWOT Analysis
- 11.2.4.4. Recent Developments
- 11.2.4.5. Financials (Based on Availability)
- 11.2.5 GetWellNetwork Inc
- 11.2.5.1. Overview
- 11.2.5.2. Products
- 11.2.5.3. SWOT Analysis
- 11.2.5.4. Recent Developments
- 11.2.5.5. Financials (Based on Availability)
- 11.2.6 Orion Health Ltd
- 11.2.6.1. Overview
- 11.2.6.2. Products
- 11.2.6.3. SWOT Analysis
- 11.2.6.4. Recent Developments
- 11.2.6.5. Financials (Based on Availability)
- 11.2.7 Cerner Corporation
- 11.2.7.1. Overview
- 11.2.7.2. Products
- 11.2.7.3. SWOT Analysis
- 11.2.7.4. Recent Developments
- 11.2.7.5. Financials (Based on Availability)
- 11.2.8 Welvu
- 11.2.8.1. Overview
- 11.2.8.2. Products
- 11.2.8.3. SWOT Analysis
- 11.2.8.4. Recent Developments
- 11.2.8.5. Financials (Based on Availability)
- 11.2.9 Lincor Solutions
- 11.2.9.1. Overview
- 11.2.9.2. Products
- 11.2.9.3. SWOT Analysis
- 11.2.9.4. Recent Developments
- 11.2.9.5. Financials (Based on Availability)
- 11.2.10 Yourcareuniverse Inc
- 11.2.10.1. Overview
- 11.2.10.2. Products
- 11.2.10.3. SWOT Analysis
- 11.2.10.4. Recent Developments
- 11.2.10.5. Financials (Based on Availability)
- 11.2.11 Allscripts Healthcare Solutions Inc
- 11.2.11.1. Overview
- 11.2.11.2. Products
- 11.2.11.3. SWOT Analysis
- 11.2.11.4. Recent Developments
- 11.2.11.5. Financials (Based on Availability)
- 11.2.12 IBM
- 11.2.12.1. Overview
- 11.2.12.2. Products
- 11.2.12.3. SWOT Analysis
- 11.2.12.4. Recent Developments
- 11.2.12.5. Financials (Based on Availability)
- 11.2.1 Athenahealth Inc
List of Figures
- Figure 1: Global Interactive Patient Engagement Solutions Industry Revenue Breakdown (Million, %) by Region 2025 & 2033
- Figure 2: Global Interactive Patient Engagement Solutions Industry Volume Breakdown (K Unit, %) by Region 2025 & 2033
- Figure 3: North America Interactive Patient Engagement Solutions Industry Revenue (Million), by Component 2025 & 2033
- Figure 4: North America Interactive Patient Engagement Solutions Industry Volume (K Unit), by Component 2025 & 2033
- Figure 5: North America Interactive Patient Engagement Solutions Industry Revenue Share (%), by Component 2025 & 2033
- Figure 6: North America Interactive Patient Engagement Solutions Industry Volume Share (%), by Component 2025 & 2033
- Figure 7: North America Interactive Patient Engagement Solutions Industry Revenue (Million), by Delivery Mode 2025 & 2033
- Figure 8: North America Interactive Patient Engagement Solutions Industry Volume (K Unit), by Delivery Mode 2025 & 2033
- Figure 9: North America Interactive Patient Engagement Solutions Industry Revenue Share (%), by Delivery Mode 2025 & 2033
- Figure 10: North America Interactive Patient Engagement Solutions Industry Volume Share (%), by Delivery Mode 2025 & 2033
- Figure 11: North America Interactive Patient Engagement Solutions Industry Revenue (Million), by Application 2025 & 2033
- Figure 12: North America Interactive Patient Engagement Solutions Industry Volume (K Unit), by Application 2025 & 2033
- Figure 13: North America Interactive Patient Engagement Solutions Industry Revenue Share (%), by Application 2025 & 2033
- Figure 14: North America Interactive Patient Engagement Solutions Industry Volume Share (%), by Application 2025 & 2033
- Figure 15: North America Interactive Patient Engagement Solutions Industry Revenue (Million), by End User 2025 & 2033
- Figure 16: North America Interactive Patient Engagement Solutions Industry Volume (K Unit), by End User 2025 & 2033
- Figure 17: North America Interactive Patient Engagement Solutions Industry Revenue Share (%), by End User 2025 & 2033
- Figure 18: North America Interactive Patient Engagement Solutions Industry Volume Share (%), by End User 2025 & 2033
- Figure 19: North America Interactive Patient Engagement Solutions Industry Revenue (Million), by Country 2025 & 2033
- Figure 20: North America Interactive Patient Engagement Solutions Industry Volume (K Unit), by Country 2025 & 2033
- Figure 21: North America Interactive Patient Engagement Solutions Industry Revenue Share (%), by Country 2025 & 2033
- Figure 22: North America Interactive Patient Engagement Solutions Industry Volume Share (%), by Country 2025 & 2033
- Figure 23: Europe Interactive Patient Engagement Solutions Industry Revenue (Million), by Component 2025 & 2033
- Figure 24: Europe Interactive Patient Engagement Solutions Industry Volume (K Unit), by Component 2025 & 2033
- Figure 25: Europe Interactive Patient Engagement Solutions Industry Revenue Share (%), by Component 2025 & 2033
- Figure 26: Europe Interactive Patient Engagement Solutions Industry Volume Share (%), by Component 2025 & 2033
- Figure 27: Europe Interactive Patient Engagement Solutions Industry Revenue (Million), by Delivery Mode 2025 & 2033
- Figure 28: Europe Interactive Patient Engagement Solutions Industry Volume (K Unit), by Delivery Mode 2025 & 2033
- Figure 29: Europe Interactive Patient Engagement Solutions Industry Revenue Share (%), by Delivery Mode 2025 & 2033
- Figure 30: Europe Interactive Patient Engagement Solutions Industry Volume Share (%), by Delivery Mode 2025 & 2033
- Figure 31: Europe Interactive Patient Engagement Solutions Industry Revenue (Million), by Application 2025 & 2033
- Figure 32: Europe Interactive Patient Engagement Solutions Industry Volume (K Unit), by Application 2025 & 2033
- Figure 33: Europe Interactive Patient Engagement Solutions Industry Revenue Share (%), by Application 2025 & 2033
- Figure 34: Europe Interactive Patient Engagement Solutions Industry Volume Share (%), by Application 2025 & 2033
- Figure 35: Europe Interactive Patient Engagement Solutions Industry Revenue (Million), by End User 2025 & 2033
- Figure 36: Europe Interactive Patient Engagement Solutions Industry Volume (K Unit), by End User 2025 & 2033
- Figure 37: Europe Interactive Patient Engagement Solutions Industry Revenue Share (%), by End User 2025 & 2033
- Figure 38: Europe Interactive Patient Engagement Solutions Industry Volume Share (%), by End User 2025 & 2033
- Figure 39: Europe Interactive Patient Engagement Solutions Industry Revenue (Million), by Country 2025 & 2033
- Figure 40: Europe Interactive Patient Engagement Solutions Industry Volume (K Unit), by Country 2025 & 2033
- Figure 41: Europe Interactive Patient Engagement Solutions Industry Revenue Share (%), by Country 2025 & 2033
- Figure 42: Europe Interactive Patient Engagement Solutions Industry Volume Share (%), by Country 2025 & 2033
- Figure 43: Asia Pacific Interactive Patient Engagement Solutions Industry Revenue (Million), by Component 2025 & 2033
- Figure 44: Asia Pacific Interactive Patient Engagement Solutions Industry Volume (K Unit), by Component 2025 & 2033
- Figure 45: Asia Pacific Interactive Patient Engagement Solutions Industry Revenue Share (%), by Component 2025 & 2033
- Figure 46: Asia Pacific Interactive Patient Engagement Solutions Industry Volume Share (%), by Component 2025 & 2033
- Figure 47: Asia Pacific Interactive Patient Engagement Solutions Industry Revenue (Million), by Delivery Mode 2025 & 2033
- Figure 48: Asia Pacific Interactive Patient Engagement Solutions Industry Volume (K Unit), by Delivery Mode 2025 & 2033
- Figure 49: Asia Pacific Interactive Patient Engagement Solutions Industry Revenue Share (%), by Delivery Mode 2025 & 2033
- Figure 50: Asia Pacific Interactive Patient Engagement Solutions Industry Volume Share (%), by Delivery Mode 2025 & 2033
- Figure 51: Asia Pacific Interactive Patient Engagement Solutions Industry Revenue (Million), by Application 2025 & 2033
- Figure 52: Asia Pacific Interactive Patient Engagement Solutions Industry Volume (K Unit), by Application 2025 & 2033
- Figure 53: Asia Pacific Interactive Patient Engagement Solutions Industry Revenue Share (%), by Application 2025 & 2033
- Figure 54: Asia Pacific Interactive Patient Engagement Solutions Industry Volume Share (%), by Application 2025 & 2033
- Figure 55: Asia Pacific Interactive Patient Engagement Solutions Industry Revenue (Million), by End User 2025 & 2033
- Figure 56: Asia Pacific Interactive Patient Engagement Solutions Industry Volume (K Unit), by End User 2025 & 2033
- Figure 57: Asia Pacific Interactive Patient Engagement Solutions Industry Revenue Share (%), by End User 2025 & 2033
- Figure 58: Asia Pacific Interactive Patient Engagement Solutions Industry Volume Share (%), by End User 2025 & 2033
- Figure 59: Asia Pacific Interactive Patient Engagement Solutions Industry Revenue (Million), by Country 2025 & 2033
- Figure 60: Asia Pacific Interactive Patient Engagement Solutions Industry Volume (K Unit), by Country 2025 & 2033
- Figure 61: Asia Pacific Interactive Patient Engagement Solutions Industry Revenue Share (%), by Country 2025 & 2033
- Figure 62: Asia Pacific Interactive Patient Engagement Solutions Industry Volume Share (%), by Country 2025 & 2033
- Figure 63: Middle East and Africa Interactive Patient Engagement Solutions Industry Revenue (Million), by Component 2025 & 2033
- Figure 64: Middle East and Africa Interactive Patient Engagement Solutions Industry Volume (K Unit), by Component 2025 & 2033
- Figure 65: Middle East and Africa Interactive Patient Engagement Solutions Industry Revenue Share (%), by Component 2025 & 2033
- Figure 66: Middle East and Africa Interactive Patient Engagement Solutions Industry Volume Share (%), by Component 2025 & 2033
- Figure 67: Middle East and Africa Interactive Patient Engagement Solutions Industry Revenue (Million), by Delivery Mode 2025 & 2033
- Figure 68: Middle East and Africa Interactive Patient Engagement Solutions Industry Volume (K Unit), by Delivery Mode 2025 & 2033
- Figure 69: Middle East and Africa Interactive Patient Engagement Solutions Industry Revenue Share (%), by Delivery Mode 2025 & 2033
- Figure 70: Middle East and Africa Interactive Patient Engagement Solutions Industry Volume Share (%), by Delivery Mode 2025 & 2033
- Figure 71: Middle East and Africa Interactive Patient Engagement Solutions Industry Revenue (Million), by Application 2025 & 2033
- Figure 72: Middle East and Africa Interactive Patient Engagement Solutions Industry Volume (K Unit), by Application 2025 & 2033
- Figure 73: Middle East and Africa Interactive Patient Engagement Solutions Industry Revenue Share (%), by Application 2025 & 2033
- Figure 74: Middle East and Africa Interactive Patient Engagement Solutions Industry Volume Share (%), by Application 2025 & 2033
- Figure 75: Middle East and Africa Interactive Patient Engagement Solutions Industry Revenue (Million), by End User 2025 & 2033
- Figure 76: Middle East and Africa Interactive Patient Engagement Solutions Industry Volume (K Unit), by End User 2025 & 2033
- Figure 77: Middle East and Africa Interactive Patient Engagement Solutions Industry Revenue Share (%), by End User 2025 & 2033
- Figure 78: Middle East and Africa Interactive Patient Engagement Solutions Industry Volume Share (%), by End User 2025 & 2033
- Figure 79: Middle East and Africa Interactive Patient Engagement Solutions Industry Revenue (Million), by Country 2025 & 2033
- Figure 80: Middle East and Africa Interactive Patient Engagement Solutions Industry Volume (K Unit), by Country 2025 & 2033
- Figure 81: Middle East and Africa Interactive Patient Engagement Solutions Industry Revenue Share (%), by Country 2025 & 2033
- Figure 82: Middle East and Africa Interactive Patient Engagement Solutions Industry Volume Share (%), by Country 2025 & 2033
- Figure 83: South America Interactive Patient Engagement Solutions Industry Revenue (Million), by Component 2025 & 2033
- Figure 84: South America Interactive Patient Engagement Solutions Industry Volume (K Unit), by Component 2025 & 2033
- Figure 85: South America Interactive Patient Engagement Solutions Industry Revenue Share (%), by Component 2025 & 2033
- Figure 86: South America Interactive Patient Engagement Solutions Industry Volume Share (%), by Component 2025 & 2033
- Figure 87: South America Interactive Patient Engagement Solutions Industry Revenue (Million), by Delivery Mode 2025 & 2033
- Figure 88: South America Interactive Patient Engagement Solutions Industry Volume (K Unit), by Delivery Mode 2025 & 2033
- Figure 89: South America Interactive Patient Engagement Solutions Industry Revenue Share (%), by Delivery Mode 2025 & 2033
- Figure 90: South America Interactive Patient Engagement Solutions Industry Volume Share (%), by Delivery Mode 2025 & 2033
- Figure 91: South America Interactive Patient Engagement Solutions Industry Revenue (Million), by Application 2025 & 2033
- Figure 92: South America Interactive Patient Engagement Solutions Industry Volume (K Unit), by Application 2025 & 2033
- Figure 93: South America Interactive Patient Engagement Solutions Industry Revenue Share (%), by Application 2025 & 2033
- Figure 94: South America Interactive Patient Engagement Solutions Industry Volume Share (%), by Application 2025 & 2033
- Figure 95: South America Interactive Patient Engagement Solutions Industry Revenue (Million), by End User 2025 & 2033
- Figure 96: South America Interactive Patient Engagement Solutions Industry Volume (K Unit), by End User 2025 & 2033
- Figure 97: South America Interactive Patient Engagement Solutions Industry Revenue Share (%), by End User 2025 & 2033
- Figure 98: South America Interactive Patient Engagement Solutions Industry Volume Share (%), by End User 2025 & 2033
- Figure 99: South America Interactive Patient Engagement Solutions Industry Revenue (Million), by Country 2025 & 2033
- Figure 100: South America Interactive Patient Engagement Solutions Industry Volume (K Unit), by Country 2025 & 2033
- Figure 101: South America Interactive Patient Engagement Solutions Industry Revenue Share (%), by Country 2025 & 2033
- Figure 102: South America Interactive Patient Engagement Solutions Industry Volume Share (%), by Country 2025 & 2033
List of Tables
- Table 1: Global Interactive Patient Engagement Solutions Industry Revenue Million Forecast, by Component 2020 & 2033
- Table 2: Global Interactive Patient Engagement Solutions Industry Volume K Unit Forecast, by Component 2020 & 2033
- Table 3: Global Interactive Patient Engagement Solutions Industry Revenue Million Forecast, by Delivery Mode 2020 & 2033
- Table 4: Global Interactive Patient Engagement Solutions Industry Volume K Unit Forecast, by Delivery Mode 2020 & 2033
- Table 5: Global Interactive Patient Engagement Solutions Industry Revenue Million Forecast, by Application 2020 & 2033
- Table 6: Global Interactive Patient Engagement Solutions Industry Volume K Unit Forecast, by Application 2020 & 2033
- Table 7: Global Interactive Patient Engagement Solutions Industry Revenue Million Forecast, by End User 2020 & 2033
- Table 8: Global Interactive Patient Engagement Solutions Industry Volume K Unit Forecast, by End User 2020 & 2033
- Table 9: Global Interactive Patient Engagement Solutions Industry Revenue Million Forecast, by Region 2020 & 2033
- Table 10: Global Interactive Patient Engagement Solutions Industry Volume K Unit Forecast, by Region 2020 & 2033
- Table 11: Global Interactive Patient Engagement Solutions Industry Revenue Million Forecast, by Component 2020 & 2033
- Table 12: Global Interactive Patient Engagement Solutions Industry Volume K Unit Forecast, by Component 2020 & 2033
- Table 13: Global Interactive Patient Engagement Solutions Industry Revenue Million Forecast, by Delivery Mode 2020 & 2033
- Table 14: Global Interactive Patient Engagement Solutions Industry Volume K Unit Forecast, by Delivery Mode 2020 & 2033
- Table 15: Global Interactive Patient Engagement Solutions Industry Revenue Million Forecast, by Application 2020 & 2033
- Table 16: Global Interactive Patient Engagement Solutions Industry Volume K Unit Forecast, by Application 2020 & 2033
- Table 17: Global Interactive Patient Engagement Solutions Industry Revenue Million Forecast, by End User 2020 & 2033
- Table 18: Global Interactive Patient Engagement Solutions Industry Volume K Unit Forecast, by End User 2020 & 2033
- Table 19: Global Interactive Patient Engagement Solutions Industry Revenue Million Forecast, by Country 2020 & 2033
- Table 20: Global Interactive Patient Engagement Solutions Industry Volume K Unit Forecast, by Country 2020 & 2033
- Table 21: United States Interactive Patient Engagement Solutions Industry Revenue (Million) Forecast, by Application 2020 & 2033
- Table 22: United States Interactive Patient Engagement Solutions Industry Volume (K Unit) Forecast, by Application 2020 & 2033
- Table 23: Canada Interactive Patient Engagement Solutions Industry Revenue (Million) Forecast, by Application 2020 & 2033
- Table 24: Canada Interactive Patient Engagement Solutions Industry Volume (K Unit) Forecast, by Application 2020 & 2033
- Table 25: Mexico Interactive Patient Engagement Solutions Industry Revenue (Million) Forecast, by Application 2020 & 2033
- Table 26: Mexico Interactive Patient Engagement Solutions Industry Volume (K Unit) Forecast, by Application 2020 & 2033
- Table 27: Global Interactive Patient Engagement Solutions Industry Revenue Million Forecast, by Component 2020 & 2033
- Table 28: Global Interactive Patient Engagement Solutions Industry Volume K Unit Forecast, by Component 2020 & 2033
- Table 29: Global Interactive Patient Engagement Solutions Industry Revenue Million Forecast, by Delivery Mode 2020 & 2033
- Table 30: Global Interactive Patient Engagement Solutions Industry Volume K Unit Forecast, by Delivery Mode 2020 & 2033
- Table 31: Global Interactive Patient Engagement Solutions Industry Revenue Million Forecast, by Application 2020 & 2033
- Table 32: Global Interactive Patient Engagement Solutions Industry Volume K Unit Forecast, by Application 2020 & 2033
- Table 33: Global Interactive Patient Engagement Solutions Industry Revenue Million Forecast, by End User 2020 & 2033
- Table 34: Global Interactive Patient Engagement Solutions Industry Volume K Unit Forecast, by End User 2020 & 2033
- Table 35: Global Interactive Patient Engagement Solutions Industry Revenue Million Forecast, by Country 2020 & 2033
- Table 36: Global Interactive Patient Engagement Solutions Industry Volume K Unit Forecast, by Country 2020 & 2033
- Table 37: Germany Interactive Patient Engagement Solutions Industry Revenue (Million) Forecast, by Application 2020 & 2033
- Table 38: Germany Interactive Patient Engagement Solutions Industry Volume (K Unit) Forecast, by Application 2020 & 2033
- Table 39: United Kingdom Interactive Patient Engagement Solutions Industry Revenue (Million) Forecast, by Application 2020 & 2033
- Table 40: United Kingdom Interactive Patient Engagement Solutions Industry Volume (K Unit) Forecast, by Application 2020 & 2033
- Table 41: France Interactive Patient Engagement Solutions Industry Revenue (Million) Forecast, by Application 2020 & 2033
- Table 42: France Interactive Patient Engagement Solutions Industry Volume (K Unit) Forecast, by Application 2020 & 2033
- Table 43: Italy Interactive Patient Engagement Solutions Industry Revenue (Million) Forecast, by Application 2020 & 2033
- Table 44: Italy Interactive Patient Engagement Solutions Industry Volume (K Unit) Forecast, by Application 2020 & 2033
- Table 45: Spain Interactive Patient Engagement Solutions Industry Revenue (Million) Forecast, by Application 2020 & 2033
- Table 46: Spain Interactive Patient Engagement Solutions Industry Volume (K Unit) Forecast, by Application 2020 & 2033
- Table 47: Rest of Europe Interactive Patient Engagement Solutions Industry Revenue (Million) Forecast, by Application 2020 & 2033
- Table 48: Rest of Europe Interactive Patient Engagement Solutions Industry Volume (K Unit) Forecast, by Application 2020 & 2033
- Table 49: Global Interactive Patient Engagement Solutions Industry Revenue Million Forecast, by Component 2020 & 2033
- Table 50: Global Interactive Patient Engagement Solutions Industry Volume K Unit Forecast, by Component 2020 & 2033
- Table 51: Global Interactive Patient Engagement Solutions Industry Revenue Million Forecast, by Delivery Mode 2020 & 2033
- Table 52: Global Interactive Patient Engagement Solutions Industry Volume K Unit Forecast, by Delivery Mode 2020 & 2033
- Table 53: Global Interactive Patient Engagement Solutions Industry Revenue Million Forecast, by Application 2020 & 2033
- Table 54: Global Interactive Patient Engagement Solutions Industry Volume K Unit Forecast, by Application 2020 & 2033
- Table 55: Global Interactive Patient Engagement Solutions Industry Revenue Million Forecast, by End User 2020 & 2033
- Table 56: Global Interactive Patient Engagement Solutions Industry Volume K Unit Forecast, by End User 2020 & 2033
- Table 57: Global Interactive Patient Engagement Solutions Industry Revenue Million Forecast, by Country 2020 & 2033
- Table 58: Global Interactive Patient Engagement Solutions Industry Volume K Unit Forecast, by Country 2020 & 2033
- Table 59: China Interactive Patient Engagement Solutions Industry Revenue (Million) Forecast, by Application 2020 & 2033
- Table 60: China Interactive Patient Engagement Solutions Industry Volume (K Unit) Forecast, by Application 2020 & 2033
- Table 61: Japan Interactive Patient Engagement Solutions Industry Revenue (Million) Forecast, by Application 2020 & 2033
- Table 62: Japan Interactive Patient Engagement Solutions Industry Volume (K Unit) Forecast, by Application 2020 & 2033
- Table 63: India Interactive Patient Engagement Solutions Industry Revenue (Million) Forecast, by Application 2020 & 2033
- Table 64: India Interactive Patient Engagement Solutions Industry Volume (K Unit) Forecast, by Application 2020 & 2033
- Table 65: Australia Interactive Patient Engagement Solutions Industry Revenue (Million) Forecast, by Application 2020 & 2033
- Table 66: Australia Interactive Patient Engagement Solutions Industry Volume (K Unit) Forecast, by Application 2020 & 2033
- Table 67: South Korea Interactive Patient Engagement Solutions Industry Revenue (Million) Forecast, by Application 2020 & 2033
- Table 68: South Korea Interactive Patient Engagement Solutions Industry Volume (K Unit) Forecast, by Application 2020 & 2033
- Table 69: Rest of Asia Pacific Interactive Patient Engagement Solutions Industry Revenue (Million) Forecast, by Application 2020 & 2033
- Table 70: Rest of Asia Pacific Interactive Patient Engagement Solutions Industry Volume (K Unit) Forecast, by Application 2020 & 2033
- Table 71: Global Interactive Patient Engagement Solutions Industry Revenue Million Forecast, by Component 2020 & 2033
- Table 72: Global Interactive Patient Engagement Solutions Industry Volume K Unit Forecast, by Component 2020 & 2033
- Table 73: Global Interactive Patient Engagement Solutions Industry Revenue Million Forecast, by Delivery Mode 2020 & 2033
- Table 74: Global Interactive Patient Engagement Solutions Industry Volume K Unit Forecast, by Delivery Mode 2020 & 2033
- Table 75: Global Interactive Patient Engagement Solutions Industry Revenue Million Forecast, by Application 2020 & 2033
- Table 76: Global Interactive Patient Engagement Solutions Industry Volume K Unit Forecast, by Application 2020 & 2033
- Table 77: Global Interactive Patient Engagement Solutions Industry Revenue Million Forecast, by End User 2020 & 2033
- Table 78: Global Interactive Patient Engagement Solutions Industry Volume K Unit Forecast, by End User 2020 & 2033
- Table 79: Global Interactive Patient Engagement Solutions Industry Revenue Million Forecast, by Country 2020 & 2033
- Table 80: Global Interactive Patient Engagement Solutions Industry Volume K Unit Forecast, by Country 2020 & 2033
- Table 81: GCC Interactive Patient Engagement Solutions Industry Revenue (Million) Forecast, by Application 2020 & 2033
- Table 82: GCC Interactive Patient Engagement Solutions Industry Volume (K Unit) Forecast, by Application 2020 & 2033
- Table 83: South Africa Interactive Patient Engagement Solutions Industry Revenue (Million) Forecast, by Application 2020 & 2033
- Table 84: South Africa Interactive Patient Engagement Solutions Industry Volume (K Unit) Forecast, by Application 2020 & 2033
- Table 85: Rest of Middle East and Africa Interactive Patient Engagement Solutions Industry Revenue (Million) Forecast, by Application 2020 & 2033
- Table 86: Rest of Middle East and Africa Interactive Patient Engagement Solutions Industry Volume (K Unit) Forecast, by Application 2020 & 2033
- Table 87: Global Interactive Patient Engagement Solutions Industry Revenue Million Forecast, by Component 2020 & 2033
- Table 88: Global Interactive Patient Engagement Solutions Industry Volume K Unit Forecast, by Component 2020 & 2033
- Table 89: Global Interactive Patient Engagement Solutions Industry Revenue Million Forecast, by Delivery Mode 2020 & 2033
- Table 90: Global Interactive Patient Engagement Solutions Industry Volume K Unit Forecast, by Delivery Mode 2020 & 2033
- Table 91: Global Interactive Patient Engagement Solutions Industry Revenue Million Forecast, by Application 2020 & 2033
- Table 92: Global Interactive Patient Engagement Solutions Industry Volume K Unit Forecast, by Application 2020 & 2033
- Table 93: Global Interactive Patient Engagement Solutions Industry Revenue Million Forecast, by End User 2020 & 2033
- Table 94: Global Interactive Patient Engagement Solutions Industry Volume K Unit Forecast, by End User 2020 & 2033
- Table 95: Global Interactive Patient Engagement Solutions Industry Revenue Million Forecast, by Country 2020 & 2033
- Table 96: Global Interactive Patient Engagement Solutions Industry Volume K Unit Forecast, by Country 2020 & 2033
- Table 97: Brazil Interactive Patient Engagement Solutions Industry Revenue (Million) Forecast, by Application 2020 & 2033
- Table 98: Brazil Interactive Patient Engagement Solutions Industry Volume (K Unit) Forecast, by Application 2020 & 2033
- Table 99: Argentina Interactive Patient Engagement Solutions Industry Revenue (Million) Forecast, by Application 2020 & 2033
- Table 100: Argentina Interactive Patient Engagement Solutions Industry Volume (K Unit) Forecast, by Application 2020 & 2033
- Table 101: Rest of South America Interactive Patient Engagement Solutions Industry Revenue (Million) Forecast, by Application 2020 & 2033
- Table 102: Rest of South America Interactive Patient Engagement Solutions Industry Volume (K Unit) Forecast, by Application 2020 & 2033
Frequently Asked Questions
1. What is the projected Compound Annual Growth Rate (CAGR) of the Interactive Patient Engagement Solutions Industry?
The projected CAGR is approximately 14.38%.
2. Which companies are prominent players in the Interactive Patient Engagement Solutions Industry?
Key companies in the market include Athenahealth Inc, MEDHOST, Mckesson Corporation, Medecision Inc, GetWellNetwork Inc, Orion Health Ltd, Cerner Corporation, Welvu, Lincor Solutions, Yourcareuniverse Inc , Allscripts Healthcare Solutions Inc, IBM.
3. What are the main segments of the Interactive Patient Engagement Solutions Industry?
The market segments include Component, Delivery Mode, Application, End User.
4. Can you provide details about the market size?
The market size is estimated to be USD 24.00 Million as of 2022.
5. What are some drivers contributing to market growth?
Rising Trend of Mobile Health Applications; Growing Popularity of Patient Engagement Solutions Among the Aging Population; Rising Investments and Technological advancements.
6. What are the notable trends driving market growth?
Web-based and Cloud-based Services Segment is Expected to Witness Growth Over the Forecast Period.
7. Are there any restraints impacting market growth?
Protection of Patient Information; Lack of Skilled IT Professionals in the Healthcare Industry.
8. Can you provide examples of recent developments in the market?
In March 2022, DeliverHealth launched its partner program. DeliverHealth program supports strategic partners within the eco-system, growing sales domestically and internationally while enabling healthcare organizations to simplify the daily complexities of healthcare, improve patient outcomes and reduce overall costs.
9. What pricing options are available for accessing the report?
Pricing options include single-user, multi-user, and enterprise licenses priced at USD 4750, USD 5250, and USD 8750 respectively.
10. Is the market size provided in terms of value or volume?
The market size is provided in terms of value, measured in Million and volume, measured in K Unit.
11. Are there any specific market keywords associated with the report?
Yes, the market keyword associated with the report is "Interactive Patient Engagement Solutions Industry," which aids in identifying and referencing the specific market segment covered.
12. How do I determine which pricing option suits my needs best?
The pricing options vary based on user requirements and access needs. Individual users may opt for single-user licenses, while businesses requiring broader access may choose multi-user or enterprise licenses for cost-effective access to the report.
13. Are there any additional resources or data provided in the Interactive Patient Engagement Solutions Industry report?
While the report offers comprehensive insights, it's advisable to review the specific contents or supplementary materials provided to ascertain if additional resources or data are available.
14. How can I stay updated on further developments or reports in the Interactive Patient Engagement Solutions Industry?
To stay informed about further developments, trends, and reports in the Interactive Patient Engagement Solutions Industry, consider subscribing to industry newsletters, following relevant companies and organizations, or regularly checking reputable industry news sources and publications.
Methodology
Step 1 - Identification of Relevant Samples Size from Population Database


Step 2 - Approaches for Defining Global Market Size (Value, Volume* & Price*)

Note*: In applicable scenarios
Step 3 - Data Sources
Primary Research
- Web Analytics
- Survey Reports
- Research Institute
- Latest Research Reports
- Opinion Leaders
Secondary Research
- Annual Reports
- White Paper
- Latest Press Release
- Industry Association
- Paid Database
- Investor Presentations

Step 4 - Data Triangulation
Involves using different sources of information in order to increase the validity of a study
These sources are likely to be stakeholders in a program - participants, other researchers, program staff, other community members, and so on.
Then we put all data in single framework & apply various statistical tools to find out the dynamic on the market.
During the analysis stage, feedback from the stakeholder groups would be compared to determine areas of agreement as well as areas of divergence