

Key Insights
The global pegylated drugs market, valued at approximately $16.01 billion in 2025, is projected for substantial growth, anticipating a compound annual growth rate (CAGR) of 5.48% from 2025 to 2033. This expansion is primarily attributed to the escalating prevalence of chronic conditions, including cancer and autoimmune disorders, which necessitates advanced therapeutic solutions. Pegylation, a critical process for enhancing drug efficacy and prolonging therapeutic action, directly addresses these growing healthcare demands. Furthermore, continuous innovation in research and development is yielding novel pegylated formulations and broadening their therapeutic applications, thereby stimulating market advancement. The bifunctional PEGs segment, particularly those utilized in colony-stimulating factors and interferon therapies, is expected to witness significant expansion due to their demonstrably superior efficacy over conventional drug delivery methods. Pharmaceutical and biotechnology firms are key end-users, driving considerable investment in the research, development, and commercialization of pegylated therapeutics.
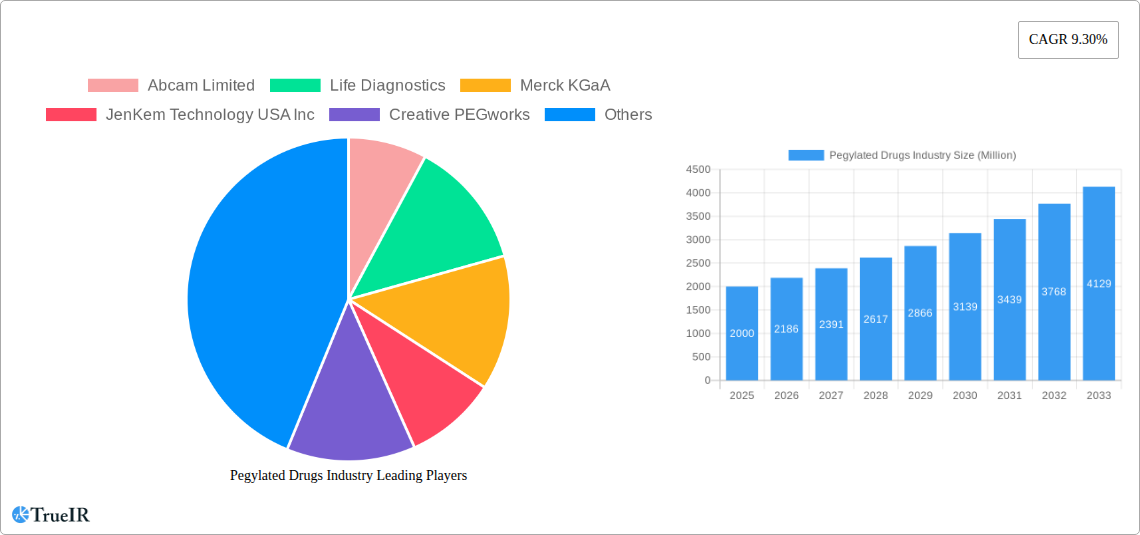
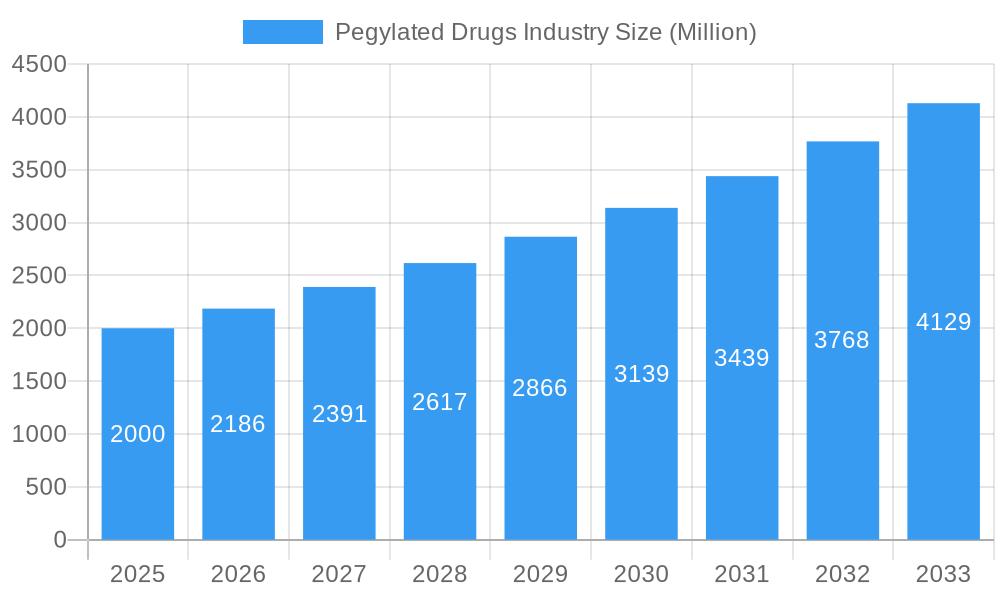
Pegylated Drugs Industry Market Size (In Billion)
Market expansion is further bolstered by the increased adoption of pegylation kits and reagents, which optimize development processes and reduce associated costs. While regulatory complexities and potential adverse effects of certain pegylated drugs present challenges, the overall market trajectory remains optimistic. Geographical expansion, especially in emerging economies with rising incidences of target diseases, coupled with ongoing innovation in targeted pegylated therapeutics, is anticipated to mitigate these restraints and ensure sustained market growth. North America, supported by robust pharmaceutical R&D investment and sophisticated healthcare infrastructure, is forecast to retain a dominant market position. Concurrently, the Asia-Pacific region, driven by its expanding healthcare sector and increasing disposable incomes, is poised for significant growth in the forthcoming years. The competitive environment features a dynamic interplay between established pharmaceutical leaders and specialized biotechnology enterprises, all actively pursuing the development and market introduction of groundbreaking pegylated drug products.
Pegylated Drugs Industry Company Market Share
Pegylated Drugs Industry Market Report: 2019-2033
This comprehensive report provides a detailed analysis of the Pegylated Drugs industry, covering market size, growth trends, competitive landscape, and future outlook from 2019 to 2033. The study period spans 2019-2033, with 2025 as the base and estimated year. The forecast period is 2025-2033, and the historical period covers 2019-2024. This report is essential for businesses, investors, and researchers seeking a deep understanding of this dynamic market.
Pegylated Drugs Industry Market Structure & Competitive Landscape
The Pegylated Drugs market exhibits a moderately concentrated structure, with several key players holding significant market share. The market concentration ratio (CR4) is estimated at xx%, indicating the influence of the top four companies. Innovation is a key driver, with continuous development of new PEGylated drugs and improved delivery systems. Regulatory approvals significantly impact market entry and growth, while stringent regulations and lengthy approval processes pose challenges. Product substitutes, including alternative drug delivery methods, exert competitive pressure.
The end-user segment is dominated by Pharmaceutical and Biotechnology Companies, accounting for approximately xx% of market revenue. Contract Research Organizations (CROs) and Academic Research Institutes contribute significantly as well, driving research and development activities. Mergers and acquisitions (M&A) are a prominent trend, with an estimated xx Million USD worth of deals recorded between 2019 and 2024. Key examples include Merck KGaA’s acquisition of Exelead in 2022, which strengthened their position in PEGylated product manufacturing.
- Market Concentration: CR4 estimated at xx%
- Innovation Drivers: New PEGylated drug development, improved delivery systems.
- Regulatory Impacts: Stringent regulations, lengthy approval processes.
- Product Substitutes: Alternative drug delivery methods.
- End-User Segmentation: Pharmaceutical & Biotechnology Companies (xx%), CROs, Academic Research Institutes.
- M&A Trends: xx Million USD in deals (2019-2024), e.g., Merck KGaA’s acquisition of Exelead.
Pegylated Drugs Industry Market Trends & Opportunities
The global Pegylated Drugs market is projected to witness significant growth, with a Compound Annual Growth Rate (CAGR) of xx% during the forecast period (2025-2033). This growth is fueled by increasing prevalence of chronic diseases requiring long-term treatment, rising demand for targeted drug delivery systems, and advancements in PEGylation technology. Technological advancements, such as the development of novel PEG derivatives and improved conjugation methods, are expanding the therapeutic applications of PEGylated drugs. Consumer preference for less invasive treatments and improved efficacy drives market expansion. Competitive dynamics are characterized by both collaboration and competition among key players, with strategic alliances and partnerships becoming increasingly important. Market penetration rates vary across different regions and therapeutic areas, with higher penetration observed in developed economies and in oncology and immunology applications. The market size is projected to reach xx Million USD by 2033.
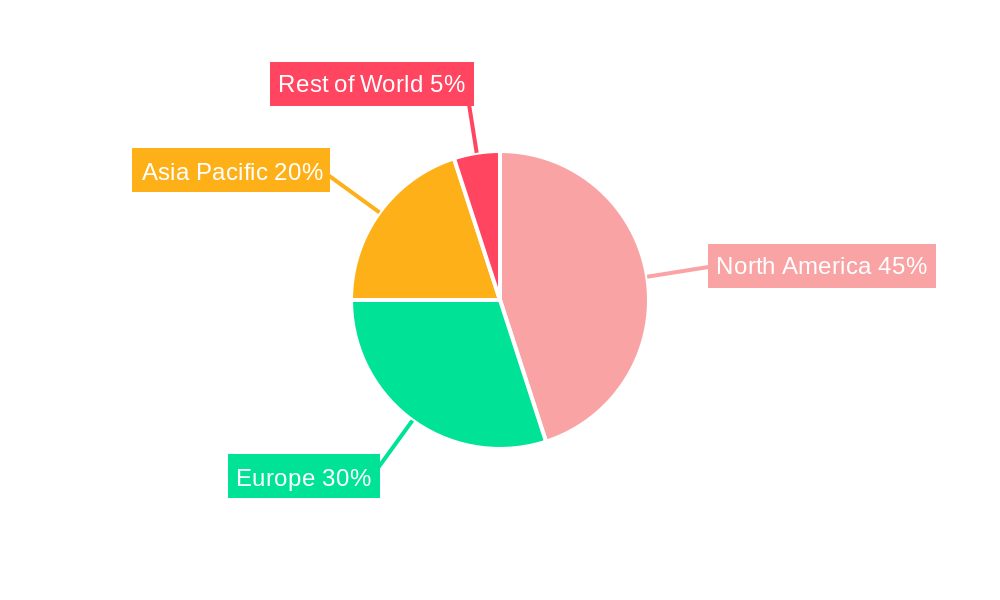
Dominant Markets & Segments in Pegylated Drugs Industry
The North American region currently dominates the Pegylated Drugs market, followed by Europe and Asia Pacific. Within segments:
- By Product Type: PEGylation Kits and Reagents segment holds the largest market share due to its high demand in research and development activities.
- By Protein Type: Interferons and Colony-stimulating Factors are the leading protein types used in PEGylated drugs, driven by their efficacy in treating various diseases.
- By End User: Pharmaceutical and Biotechnology Companies are the largest consumers of PEGylated drugs, owing to their extensive involvement in drug development and commercialization.
Key Growth Drivers:
- Technological advancements: Development of novel PEG derivatives and improved conjugation methods.
- Strong research and development pipeline: Continuous innovation in PEGylated drug development.
- Favorable regulatory environment: Approvals for new PEGylated drugs.
- Increased prevalence of chronic diseases: High demand for effective long-term treatments.
The dominance of North America stems from factors including robust pharmaceutical industries, high research spending, and early adoption of new technologies.
Pegylated Drugs Industry Product Analysis
Technological advancements in PEGylation, including the development of branched PEGs and site-specific conjugation techniques, are enhancing the efficacy and safety of PEGylated drugs. These improvements are reflected in a wider range of applications, including cancer treatment, autoimmune diseases, and infectious diseases. The competitive advantage stems from factors such as superior drug delivery efficiency, reduced immunogenicity, and extended drug circulation times. This allows for improved therapeutic outcomes and reduced treatment burden for patients.
Key Drivers, Barriers & Challenges in Pegylated Drugs Industry
Key Drivers:
- Technological advancements leading to improved efficacy and safety of PEGylated drugs.
- Growing prevalence of chronic diseases necessitating long-term treatment.
- Increased investment in research and development.
Challenges and Restraints:
- High cost of production and regulatory hurdles can hinder market entry and growth.
- Potential for immunogenicity and toxicity issues remains a significant concern.
- Competition from alternative drug delivery systems poses a threat. This translates to approximately xx% reduction in market growth in the past three years.
Growth Drivers in the Pegylated Drugs Industry Market
Technological innovations in PEGylation, like branched PEG and site-specific conjugation, improve drug efficacy and safety. The expanding prevalence of chronic diseases creates higher demand for effective, long-term therapies. Increased R&D investments drive the development of new PEGylated drugs.
Challenges Impacting Pegylated Drugs Industry Growth
High production costs and regulatory hurdles create barriers to entry. Potential immunogenicity and toxicity issues cause concern. Competition from alternative drug delivery systems impacts market growth.
Key Players Shaping the Pegylated Drugs Industry Market
- Abcam Limited
- Life Diagnostics
- Merck KGaA
- JenKem Technology USA Inc
- Creative PEGworks
- Laysan Bio Inc
- Thermo Fisher Scientific Inc
- Iris Biotech GmbH
- Quanta BioDesign Ltd
- Celares GmbH
- Alpha Diagnostic Intl Inc
- NOF America Corporation
Significant Pegylated Drugs Industry Milestones
- November 2022: Nektar Therapeutics presented preclinical data for NKTR-288, a PEGylated interferon-gamma conjugate, at the SITC Annual Meeting. This signifies progress in the development of novel PEGylated immunotherapies.
- July 2022: EMA recommended approval of Celdoxome pegylated liposomal doxorubicin for various cancers. This expands treatment options and market potential.
- February 2022: Merck KGaA acquired Exelead, boosting its capacity in PEGylated product manufacturing. This strengthens their market position.
Future Outlook for Pegylated Drugs Industry Market
The Pegylated Drugs industry is poised for continued growth, driven by technological advancements, expanding therapeutic applications, and increasing demand for effective, long-term treatments. Strategic partnerships and collaborations are expected to accelerate innovation and market penetration. The market presents significant opportunities for companies engaged in the development and manufacturing of PEGylated drugs, with substantial growth potential in both developed and emerging markets.
Pegylated Drugs Industry Segmentation
-
1. Product Type
- 1.1. PEGylation Kits and Reagents
- 1.2. Services
- 1.3. Other Product Types
-
2. Protein Type
- 2.1. Colony-stimulating Factors
- 2.2. Interferons
- 2.3. Erythropoietin
- 2.4. Other Protein Types
-
3. End User
- 3.1. Pharmaceutical and Biotechnology Companies
- 3.2. Contract Research Organizations
- 3.3. Academic Research Institutes
Pegylated Drugs Industry Segmentation By Geography
-
1. North America
- 1.1. United States
- 1.2. Canada
- 1.3. Mexico
-
2. Europe
- 2.1. Germany
- 2.2. United Kingdom
- 2.3. France
- 2.4. Italy
- 2.5. Spain
- 2.6. Rest of Europe
-
3. Asia Pacific
- 3.1. China
- 3.2. Japan
- 3.3. India
- 3.4. Australia
- 3.5. South Korea
- 3.6. Rest of Asia Pacific
-
4. Middle East and Africa
- 4.1. GCC
- 4.2. South Africa
- 4.3. Rest of Middle East and Africa
-
5. South America
- 5.1. Brazil
- 5.2. Argentina
- 5.3. Rest of South America
Pegylated Drugs Industry Regional Market Share
Geographic Coverage of Pegylated Drugs Industry
Pegylated Drugs Industry REPORT HIGHLIGHTS
| Aspects | Details |
|---|---|
| Study Period | 2020-2034 |
| Base Year | 2025 |
| Estimated Year | 2026 |
| Forecast Period | 2026-2034 |
| Historical Period | 2020-2025 |
| Growth Rate | CAGR of 5.48% from 2020-2034 |
| Segmentation |
|
Table of Contents
- 1. Introduction
- 1.1. Research Scope
- 1.2. Market Segmentation
- 1.3. Research Objective
- 1.4. Definitions and Assumptions
- 2. Executive Summary
- 2.1. Market Snapshot
- 3. Market Dynamics
- 3.1. Market Drivers
- 3.2. Market Restrains
- 3.3. Market Trends
- 3.4. Market Opportunities
- 4. Market Factor Analysis
- 4.1. Porters Five Forces
- 4.1.1. Bargaining Power of Suppliers
- 4.1.2. Bargaining Power of Buyers
- 4.1.3. Threat of New Entrants
- 4.1.4. Threat of Substitutes
- 4.1.5. Competitive Rivalry
- 4.2. PESTEL analysis
- 4.3. BCG Analysis
- 4.3.1. Stars (High Growth, High Market Share)
- 4.3.2. Cash Cows (Low Growth, High Market Share)
- 4.3.3. Question Mark (High Growth, Low Market Share)
- 4.3.4. Dogs (Low Growth, Low Market Share)
- 4.4. Ansoff Matrix Analysis
- 4.5. Supply Chain Analysis
- 4.6. Regulatory Landscape
- 4.7. Current Market Potential and Opportunity Assessment (TAM–SAM–SOM Framework)
- 4.8. TIR Analyst Note
- 4.1. Porters Five Forces
- 5. Market Analysis, Insights and Forecast 2021-2033
- 5.1. Market Analysis, Insights and Forecast - by Product Type
- 5.1.1. PEGylation Kits and Reagents
- 5.1.2. Services
- 5.1.3. Other Product Types
- 5.2. Market Analysis, Insights and Forecast - by Protein Type
- 5.2.1. Colony-stimulating Factors
- 5.2.2. Interferons
- 5.2.3. Erythropoietin
- 5.2.4. Other Protein Types
- 5.3. Market Analysis, Insights and Forecast - by End User
- 5.3.1. Pharmaceutical and Biotechnology Companies
- 5.3.2. Contract Research Organizations
- 5.3.3. Academic Research Institutes
- 5.4. Market Analysis, Insights and Forecast - by Region
- 5.4.1. North America
- 5.4.2. Europe
- 5.4.3. Asia Pacific
- 5.4.4. Middle East and Africa
- 5.4.5. South America
- 5.1. Market Analysis, Insights and Forecast - by Product Type
- 6. Global Pegylated Drugs Industry Analysis, Insights and Forecast, 2021-2033
- 6.1. Market Analysis, Insights and Forecast - by Product Type
- 6.1.1. PEGylation Kits and Reagents
- 6.1.2. Services
- 6.1.3. Other Product Types
- 6.2. Market Analysis, Insights and Forecast - by Protein Type
- 6.2.1. Colony-stimulating Factors
- 6.2.2. Interferons
- 6.2.3. Erythropoietin
- 6.2.4. Other Protein Types
- 6.3. Market Analysis, Insights and Forecast - by End User
- 6.3.1. Pharmaceutical and Biotechnology Companies
- 6.3.2. Contract Research Organizations
- 6.3.3. Academic Research Institutes
- 6.1. Market Analysis, Insights and Forecast - by Product Type
- 7. North America Pegylated Drugs Industry Analysis, Insights and Forecast, 2020-2032
- 7.1. Market Analysis, Insights and Forecast - by Product Type
- 7.1.1. PEGylation Kits and Reagents
- 7.1.2. Services
- 7.1.3. Other Product Types
- 7.2. Market Analysis, Insights and Forecast - by Protein Type
- 7.2.1. Colony-stimulating Factors
- 7.2.2. Interferons
- 7.2.3. Erythropoietin
- 7.2.4. Other Protein Types
- 7.3. Market Analysis, Insights and Forecast - by End User
- 7.3.1. Pharmaceutical and Biotechnology Companies
- 7.3.2. Contract Research Organizations
- 7.3.3. Academic Research Institutes
- 7.1. Market Analysis, Insights and Forecast - by Product Type
- 8. Europe Pegylated Drugs Industry Analysis, Insights and Forecast, 2020-2032
- 8.1. Market Analysis, Insights and Forecast - by Product Type
- 8.1.1. PEGylation Kits and Reagents
- 8.1.2. Services
- 8.1.3. Other Product Types
- 8.2. Market Analysis, Insights and Forecast - by Protein Type
- 8.2.1. Colony-stimulating Factors
- 8.2.2. Interferons
- 8.2.3. Erythropoietin
- 8.2.4. Other Protein Types
- 8.3. Market Analysis, Insights and Forecast - by End User
- 8.3.1. Pharmaceutical and Biotechnology Companies
- 8.3.2. Contract Research Organizations
- 8.3.3. Academic Research Institutes
- 8.1. Market Analysis, Insights and Forecast - by Product Type
- 9. Asia Pacific Pegylated Drugs Industry Analysis, Insights and Forecast, 2020-2032
- 9.1. Market Analysis, Insights and Forecast - by Product Type
- 9.1.1. PEGylation Kits and Reagents
- 9.1.2. Services
- 9.1.3. Other Product Types
- 9.2. Market Analysis, Insights and Forecast - by Protein Type
- 9.2.1. Colony-stimulating Factors
- 9.2.2. Interferons
- 9.2.3. Erythropoietin
- 9.2.4. Other Protein Types
- 9.3. Market Analysis, Insights and Forecast - by End User
- 9.3.1. Pharmaceutical and Biotechnology Companies
- 9.3.2. Contract Research Organizations
- 9.3.3. Academic Research Institutes
- 9.1. Market Analysis, Insights and Forecast - by Product Type
- 10. Middle East and Africa Pegylated Drugs Industry Analysis, Insights and Forecast, 2020-2032
- 10.1. Market Analysis, Insights and Forecast - by Product Type
- 10.1.1. PEGylation Kits and Reagents
- 10.1.2. Services
- 10.1.3. Other Product Types
- 10.2. Market Analysis, Insights and Forecast - by Protein Type
- 10.2.1. Colony-stimulating Factors
- 10.2.2. Interferons
- 10.2.3. Erythropoietin
- 10.2.4. Other Protein Types
- 10.3. Market Analysis, Insights and Forecast - by End User
- 10.3.1. Pharmaceutical and Biotechnology Companies
- 10.3.2. Contract Research Organizations
- 10.3.3. Academic Research Institutes
- 10.1. Market Analysis, Insights and Forecast - by Product Type
- 11. South America Pegylated Drugs Industry Analysis, Insights and Forecast, 2020-2032
- 11.1. Market Analysis, Insights and Forecast - by Product Type
- 11.1.1. PEGylation Kits and Reagents
- 11.1.2. Services
- 11.1.3. Other Product Types
- 11.2. Market Analysis, Insights and Forecast - by Protein Type
- 11.2.1. Colony-stimulating Factors
- 11.2.2. Interferons
- 11.2.3. Erythropoietin
- 11.2.4. Other Protein Types
- 11.3. Market Analysis, Insights and Forecast - by End User
- 11.3.1. Pharmaceutical and Biotechnology Companies
- 11.3.2. Contract Research Organizations
- 11.3.3. Academic Research Institutes
- 11.1. Market Analysis, Insights and Forecast - by Product Type
- 12. Competitive Analysis
- 12.1. Company Profiles
- 12.1.1 Abcam Limited
- 12.1.1.1. Company Overview
- 12.1.1.2. Products
- 12.1.1.3. Company Financials
- 12.1.1.4. SWOT Analysis
- 12.1.2 Life Diagnostics
- 12.1.2.1. Company Overview
- 12.1.2.2. Products
- 12.1.2.3. Company Financials
- 12.1.2.4. SWOT Analysis
- 12.1.3 Merck KGaA
- 12.1.3.1. Company Overview
- 12.1.3.2. Products
- 12.1.3.3. Company Financials
- 12.1.3.4. SWOT Analysis
- 12.1.4 JenKem Technology USA Inc
- 12.1.4.1. Company Overview
- 12.1.4.2. Products
- 12.1.4.3. Company Financials
- 12.1.4.4. SWOT Analysis
- 12.1.5 Creative PEGworks
- 12.1.5.1. Company Overview
- 12.1.5.2. Products
- 12.1.5.3. Company Financials
- 12.1.5.4. SWOT Analysis
- 12.1.6 Laysan Bio Inc
- 12.1.6.1. Company Overview
- 12.1.6.2. Products
- 12.1.6.3. Company Financials
- 12.1.6.4. SWOT Analysis
- 12.1.7 Thermo Fisher Scientific Inc
- 12.1.7.1. Company Overview
- 12.1.7.2. Products
- 12.1.7.3. Company Financials
- 12.1.7.4. SWOT Analysis
- 12.1.8 Iris Biotech GmbH
- 12.1.8.1. Company Overview
- 12.1.8.2. Products
- 12.1.8.3. Company Financials
- 12.1.8.4. SWOT Analysis
- 12.1.9 Quanta BioDesign Ltd
- 12.1.9.1. Company Overview
- 12.1.9.2. Products
- 12.1.9.3. Company Financials
- 12.1.9.4. SWOT Analysis
- 12.1.10 Celares GmbH
- 12.1.10.1. Company Overview
- 12.1.10.2. Products
- 12.1.10.3. Company Financials
- 12.1.10.4. SWOT Analysis
- 12.1.11 Alpha Diagnostic Intl Inc
- 12.1.11.1. Company Overview
- 12.1.11.2. Products
- 12.1.11.3. Company Financials
- 12.1.11.4. SWOT Analysis
- 12.1.12 NOF America Corporation
- 12.1.12.1. Company Overview
- 12.1.12.2. Products
- 12.1.12.3. Company Financials
- 12.1.12.4. SWOT Analysis
- 12.1.1 Abcam Limited
- 12.2. Market Entropy
- 12.2.1 Company's Key Areas Served
- 12.2.2 Recent Developments
- 12.3. Company Market Share Analysis 2025
- 12.3.1 Top 5 Companies Market Share Analysis
- 12.3.2 Top 3 Companies Market Share Analysis
- 12.4. List of Potential Customers
- 13. Research Methodology
List of Figures
- Figure 1: Global Pegylated Drugs Industry Revenue Breakdown (billion, %) by Region 2025 & 2033
- Figure 2: Global Pegylated Drugs Industry Volume Breakdown (K Unit, %) by Region 2025 & 2033
- Figure 3: North America Pegylated Drugs Industry Revenue (billion), by Product Type 2025 & 2033
- Figure 4: North America Pegylated Drugs Industry Volume (K Unit), by Product Type 2025 & 2033
- Figure 5: North America Pegylated Drugs Industry Revenue Share (%), by Product Type 2025 & 2033
- Figure 6: North America Pegylated Drugs Industry Volume Share (%), by Product Type 2025 & 2033
- Figure 7: North America Pegylated Drugs Industry Revenue (billion), by Protein Type 2025 & 2033
- Figure 8: North America Pegylated Drugs Industry Volume (K Unit), by Protein Type 2025 & 2033
- Figure 9: North America Pegylated Drugs Industry Revenue Share (%), by Protein Type 2025 & 2033
- Figure 10: North America Pegylated Drugs Industry Volume Share (%), by Protein Type 2025 & 2033
- Figure 11: North America Pegylated Drugs Industry Revenue (billion), by End User 2025 & 2033
- Figure 12: North America Pegylated Drugs Industry Volume (K Unit), by End User 2025 & 2033
- Figure 13: North America Pegylated Drugs Industry Revenue Share (%), by End User 2025 & 2033
- Figure 14: North America Pegylated Drugs Industry Volume Share (%), by End User 2025 & 2033
- Figure 15: North America Pegylated Drugs Industry Revenue (billion), by Country 2025 & 2033
- Figure 16: North America Pegylated Drugs Industry Volume (K Unit), by Country 2025 & 2033
- Figure 17: North America Pegylated Drugs Industry Revenue Share (%), by Country 2025 & 2033
- Figure 18: North America Pegylated Drugs Industry Volume Share (%), by Country 2025 & 2033
- Figure 19: Europe Pegylated Drugs Industry Revenue (billion), by Product Type 2025 & 2033
- Figure 20: Europe Pegylated Drugs Industry Volume (K Unit), by Product Type 2025 & 2033
- Figure 21: Europe Pegylated Drugs Industry Revenue Share (%), by Product Type 2025 & 2033
- Figure 22: Europe Pegylated Drugs Industry Volume Share (%), by Product Type 2025 & 2033
- Figure 23: Europe Pegylated Drugs Industry Revenue (billion), by Protein Type 2025 & 2033
- Figure 24: Europe Pegylated Drugs Industry Volume (K Unit), by Protein Type 2025 & 2033
- Figure 25: Europe Pegylated Drugs Industry Revenue Share (%), by Protein Type 2025 & 2033
- Figure 26: Europe Pegylated Drugs Industry Volume Share (%), by Protein Type 2025 & 2033
- Figure 27: Europe Pegylated Drugs Industry Revenue (billion), by End User 2025 & 2033
- Figure 28: Europe Pegylated Drugs Industry Volume (K Unit), by End User 2025 & 2033
- Figure 29: Europe Pegylated Drugs Industry Revenue Share (%), by End User 2025 & 2033
- Figure 30: Europe Pegylated Drugs Industry Volume Share (%), by End User 2025 & 2033
- Figure 31: Europe Pegylated Drugs Industry Revenue (billion), by Country 2025 & 2033
- Figure 32: Europe Pegylated Drugs Industry Volume (K Unit), by Country 2025 & 2033
- Figure 33: Europe Pegylated Drugs Industry Revenue Share (%), by Country 2025 & 2033
- Figure 34: Europe Pegylated Drugs Industry Volume Share (%), by Country 2025 & 2033
- Figure 35: Asia Pacific Pegylated Drugs Industry Revenue (billion), by Product Type 2025 & 2033
- Figure 36: Asia Pacific Pegylated Drugs Industry Volume (K Unit), by Product Type 2025 & 2033
- Figure 37: Asia Pacific Pegylated Drugs Industry Revenue Share (%), by Product Type 2025 & 2033
- Figure 38: Asia Pacific Pegylated Drugs Industry Volume Share (%), by Product Type 2025 & 2033
- Figure 39: Asia Pacific Pegylated Drugs Industry Revenue (billion), by Protein Type 2025 & 2033
- Figure 40: Asia Pacific Pegylated Drugs Industry Volume (K Unit), by Protein Type 2025 & 2033
- Figure 41: Asia Pacific Pegylated Drugs Industry Revenue Share (%), by Protein Type 2025 & 2033
- Figure 42: Asia Pacific Pegylated Drugs Industry Volume Share (%), by Protein Type 2025 & 2033
- Figure 43: Asia Pacific Pegylated Drugs Industry Revenue (billion), by End User 2025 & 2033
- Figure 44: Asia Pacific Pegylated Drugs Industry Volume (K Unit), by End User 2025 & 2033
- Figure 45: Asia Pacific Pegylated Drugs Industry Revenue Share (%), by End User 2025 & 2033
- Figure 46: Asia Pacific Pegylated Drugs Industry Volume Share (%), by End User 2025 & 2033
- Figure 47: Asia Pacific Pegylated Drugs Industry Revenue (billion), by Country 2025 & 2033
- Figure 48: Asia Pacific Pegylated Drugs Industry Volume (K Unit), by Country 2025 & 2033
- Figure 49: Asia Pacific Pegylated Drugs Industry Revenue Share (%), by Country 2025 & 2033
- Figure 50: Asia Pacific Pegylated Drugs Industry Volume Share (%), by Country 2025 & 2033
- Figure 51: Middle East and Africa Pegylated Drugs Industry Revenue (billion), by Product Type 2025 & 2033
- Figure 52: Middle East and Africa Pegylated Drugs Industry Volume (K Unit), by Product Type 2025 & 2033
- Figure 53: Middle East and Africa Pegylated Drugs Industry Revenue Share (%), by Product Type 2025 & 2033
- Figure 54: Middle East and Africa Pegylated Drugs Industry Volume Share (%), by Product Type 2025 & 2033
- Figure 55: Middle East and Africa Pegylated Drugs Industry Revenue (billion), by Protein Type 2025 & 2033
- Figure 56: Middle East and Africa Pegylated Drugs Industry Volume (K Unit), by Protein Type 2025 & 2033
- Figure 57: Middle East and Africa Pegylated Drugs Industry Revenue Share (%), by Protein Type 2025 & 2033
- Figure 58: Middle East and Africa Pegylated Drugs Industry Volume Share (%), by Protein Type 2025 & 2033
- Figure 59: Middle East and Africa Pegylated Drugs Industry Revenue (billion), by End User 2025 & 2033
- Figure 60: Middle East and Africa Pegylated Drugs Industry Volume (K Unit), by End User 2025 & 2033
- Figure 61: Middle East and Africa Pegylated Drugs Industry Revenue Share (%), by End User 2025 & 2033
- Figure 62: Middle East and Africa Pegylated Drugs Industry Volume Share (%), by End User 2025 & 2033
- Figure 63: Middle East and Africa Pegylated Drugs Industry Revenue (billion), by Country 2025 & 2033
- Figure 64: Middle East and Africa Pegylated Drugs Industry Volume (K Unit), by Country 2025 & 2033
- Figure 65: Middle East and Africa Pegylated Drugs Industry Revenue Share (%), by Country 2025 & 2033
- Figure 66: Middle East and Africa Pegylated Drugs Industry Volume Share (%), by Country 2025 & 2033
- Figure 67: South America Pegylated Drugs Industry Revenue (billion), by Product Type 2025 & 2033
- Figure 68: South America Pegylated Drugs Industry Volume (K Unit), by Product Type 2025 & 2033
- Figure 69: South America Pegylated Drugs Industry Revenue Share (%), by Product Type 2025 & 2033
- Figure 70: South America Pegylated Drugs Industry Volume Share (%), by Product Type 2025 & 2033
- Figure 71: South America Pegylated Drugs Industry Revenue (billion), by Protein Type 2025 & 2033
- Figure 72: South America Pegylated Drugs Industry Volume (K Unit), by Protein Type 2025 & 2033
- Figure 73: South America Pegylated Drugs Industry Revenue Share (%), by Protein Type 2025 & 2033
- Figure 74: South America Pegylated Drugs Industry Volume Share (%), by Protein Type 2025 & 2033
- Figure 75: South America Pegylated Drugs Industry Revenue (billion), by End User 2025 & 2033
- Figure 76: South America Pegylated Drugs Industry Volume (K Unit), by End User 2025 & 2033
- Figure 77: South America Pegylated Drugs Industry Revenue Share (%), by End User 2025 & 2033
- Figure 78: South America Pegylated Drugs Industry Volume Share (%), by End User 2025 & 2033
- Figure 79: South America Pegylated Drugs Industry Revenue (billion), by Country 2025 & 2033
- Figure 80: South America Pegylated Drugs Industry Volume (K Unit), by Country 2025 & 2033
- Figure 81: South America Pegylated Drugs Industry Revenue Share (%), by Country 2025 & 2033
- Figure 82: South America Pegylated Drugs Industry Volume Share (%), by Country 2025 & 2033
List of Tables
- Table 1: Global Pegylated Drugs Industry Revenue billion Forecast, by Product Type 2020 & 2033
- Table 2: Global Pegylated Drugs Industry Volume K Unit Forecast, by Product Type 2020 & 2033
- Table 3: Global Pegylated Drugs Industry Revenue billion Forecast, by Protein Type 2020 & 2033
- Table 4: Global Pegylated Drugs Industry Volume K Unit Forecast, by Protein Type 2020 & 2033
- Table 5: Global Pegylated Drugs Industry Revenue billion Forecast, by End User 2020 & 2033
- Table 6: Global Pegylated Drugs Industry Volume K Unit Forecast, by End User 2020 & 2033
- Table 7: Global Pegylated Drugs Industry Revenue billion Forecast, by Region 2020 & 2033
- Table 8: Global Pegylated Drugs Industry Volume K Unit Forecast, by Region 2020 & 2033
- Table 9: Global Pegylated Drugs Industry Revenue billion Forecast, by Product Type 2020 & 2033
- Table 10: Global Pegylated Drugs Industry Volume K Unit Forecast, by Product Type 2020 & 2033
- Table 11: Global Pegylated Drugs Industry Revenue billion Forecast, by Protein Type 2020 & 2033
- Table 12: Global Pegylated Drugs Industry Volume K Unit Forecast, by Protein Type 2020 & 2033
- Table 13: Global Pegylated Drugs Industry Revenue billion Forecast, by End User 2020 & 2033
- Table 14: Global Pegylated Drugs Industry Volume K Unit Forecast, by End User 2020 & 2033
- Table 15: Global Pegylated Drugs Industry Revenue billion Forecast, by Country 2020 & 2033
- Table 16: Global Pegylated Drugs Industry Volume K Unit Forecast, by Country 2020 & 2033
- Table 17: United States Pegylated Drugs Industry Revenue (billion) Forecast, by Application 2020 & 2033
- Table 18: United States Pegylated Drugs Industry Volume (K Unit) Forecast, by Application 2020 & 2033
- Table 19: Canada Pegylated Drugs Industry Revenue (billion) Forecast, by Application 2020 & 2033
- Table 20: Canada Pegylated Drugs Industry Volume (K Unit) Forecast, by Application 2020 & 2033
- Table 21: Mexico Pegylated Drugs Industry Revenue (billion) Forecast, by Application 2020 & 2033
- Table 22: Mexico Pegylated Drugs Industry Volume (K Unit) Forecast, by Application 2020 & 2033
- Table 23: Global Pegylated Drugs Industry Revenue billion Forecast, by Product Type 2020 & 2033
- Table 24: Global Pegylated Drugs Industry Volume K Unit Forecast, by Product Type 2020 & 2033
- Table 25: Global Pegylated Drugs Industry Revenue billion Forecast, by Protein Type 2020 & 2033
- Table 26: Global Pegylated Drugs Industry Volume K Unit Forecast, by Protein Type 2020 & 2033
- Table 27: Global Pegylated Drugs Industry Revenue billion Forecast, by End User 2020 & 2033
- Table 28: Global Pegylated Drugs Industry Volume K Unit Forecast, by End User 2020 & 2033
- Table 29: Global Pegylated Drugs Industry Revenue billion Forecast, by Country 2020 & 2033
- Table 30: Global Pegylated Drugs Industry Volume K Unit Forecast, by Country 2020 & 2033
- Table 31: Germany Pegylated Drugs Industry Revenue (billion) Forecast, by Application 2020 & 2033
- Table 32: Germany Pegylated Drugs Industry Volume (K Unit) Forecast, by Application 2020 & 2033
- Table 33: United Kingdom Pegylated Drugs Industry Revenue (billion) Forecast, by Application 2020 & 2033
- Table 34: United Kingdom Pegylated Drugs Industry Volume (K Unit) Forecast, by Application 2020 & 2033
- Table 35: France Pegylated Drugs Industry Revenue (billion) Forecast, by Application 2020 & 2033
- Table 36: France Pegylated Drugs Industry Volume (K Unit) Forecast, by Application 2020 & 2033
- Table 37: Italy Pegylated Drugs Industry Revenue (billion) Forecast, by Application 2020 & 2033
- Table 38: Italy Pegylated Drugs Industry Volume (K Unit) Forecast, by Application 2020 & 2033
- Table 39: Spain Pegylated Drugs Industry Revenue (billion) Forecast, by Application 2020 & 2033
- Table 40: Spain Pegylated Drugs Industry Volume (K Unit) Forecast, by Application 2020 & 2033
- Table 41: Rest of Europe Pegylated Drugs Industry Revenue (billion) Forecast, by Application 2020 & 2033
- Table 42: Rest of Europe Pegylated Drugs Industry Volume (K Unit) Forecast, by Application 2020 & 2033
- Table 43: Global Pegylated Drugs Industry Revenue billion Forecast, by Product Type 2020 & 2033
- Table 44: Global Pegylated Drugs Industry Volume K Unit Forecast, by Product Type 2020 & 2033
- Table 45: Global Pegylated Drugs Industry Revenue billion Forecast, by Protein Type 2020 & 2033
- Table 46: Global Pegylated Drugs Industry Volume K Unit Forecast, by Protein Type 2020 & 2033
- Table 47: Global Pegylated Drugs Industry Revenue billion Forecast, by End User 2020 & 2033
- Table 48: Global Pegylated Drugs Industry Volume K Unit Forecast, by End User 2020 & 2033
- Table 49: Global Pegylated Drugs Industry Revenue billion Forecast, by Country 2020 & 2033
- Table 50: Global Pegylated Drugs Industry Volume K Unit Forecast, by Country 2020 & 2033
- Table 51: China Pegylated Drugs Industry Revenue (billion) Forecast, by Application 2020 & 2033
- Table 52: China Pegylated Drugs Industry Volume (K Unit) Forecast, by Application 2020 & 2033
- Table 53: Japan Pegylated Drugs Industry Revenue (billion) Forecast, by Application 2020 & 2033
- Table 54: Japan Pegylated Drugs Industry Volume (K Unit) Forecast, by Application 2020 & 2033
- Table 55: India Pegylated Drugs Industry Revenue (billion) Forecast, by Application 2020 & 2033
- Table 56: India Pegylated Drugs Industry Volume (K Unit) Forecast, by Application 2020 & 2033
- Table 57: Australia Pegylated Drugs Industry Revenue (billion) Forecast, by Application 2020 & 2033
- Table 58: Australia Pegylated Drugs Industry Volume (K Unit) Forecast, by Application 2020 & 2033
- Table 59: South Korea Pegylated Drugs Industry Revenue (billion) Forecast, by Application 2020 & 2033
- Table 60: South Korea Pegylated Drugs Industry Volume (K Unit) Forecast, by Application 2020 & 2033
- Table 61: Rest of Asia Pacific Pegylated Drugs Industry Revenue (billion) Forecast, by Application 2020 & 2033
- Table 62: Rest of Asia Pacific Pegylated Drugs Industry Volume (K Unit) Forecast, by Application 2020 & 2033
- Table 63: Global Pegylated Drugs Industry Revenue billion Forecast, by Product Type 2020 & 2033
- Table 64: Global Pegylated Drugs Industry Volume K Unit Forecast, by Product Type 2020 & 2033
- Table 65: Global Pegylated Drugs Industry Revenue billion Forecast, by Protein Type 2020 & 2033
- Table 66: Global Pegylated Drugs Industry Volume K Unit Forecast, by Protein Type 2020 & 2033
- Table 67: Global Pegylated Drugs Industry Revenue billion Forecast, by End User 2020 & 2033
- Table 68: Global Pegylated Drugs Industry Volume K Unit Forecast, by End User 2020 & 2033
- Table 69: Global Pegylated Drugs Industry Revenue billion Forecast, by Country 2020 & 2033
- Table 70: Global Pegylated Drugs Industry Volume K Unit Forecast, by Country 2020 & 2033
- Table 71: GCC Pegylated Drugs Industry Revenue (billion) Forecast, by Application 2020 & 2033
- Table 72: GCC Pegylated Drugs Industry Volume (K Unit) Forecast, by Application 2020 & 2033
- Table 73: South Africa Pegylated Drugs Industry Revenue (billion) Forecast, by Application 2020 & 2033
- Table 74: South Africa Pegylated Drugs Industry Volume (K Unit) Forecast, by Application 2020 & 2033
- Table 75: Rest of Middle East and Africa Pegylated Drugs Industry Revenue (billion) Forecast, by Application 2020 & 2033
- Table 76: Rest of Middle East and Africa Pegylated Drugs Industry Volume (K Unit) Forecast, by Application 2020 & 2033
- Table 77: Global Pegylated Drugs Industry Revenue billion Forecast, by Product Type 2020 & 2033
- Table 78: Global Pegylated Drugs Industry Volume K Unit Forecast, by Product Type 2020 & 2033
- Table 79: Global Pegylated Drugs Industry Revenue billion Forecast, by Protein Type 2020 & 2033
- Table 80: Global Pegylated Drugs Industry Volume K Unit Forecast, by Protein Type 2020 & 2033
- Table 81: Global Pegylated Drugs Industry Revenue billion Forecast, by End User 2020 & 2033
- Table 82: Global Pegylated Drugs Industry Volume K Unit Forecast, by End User 2020 & 2033
- Table 83: Global Pegylated Drugs Industry Revenue billion Forecast, by Country 2020 & 2033
- Table 84: Global Pegylated Drugs Industry Volume K Unit Forecast, by Country 2020 & 2033
- Table 85: Brazil Pegylated Drugs Industry Revenue (billion) Forecast, by Application 2020 & 2033
- Table 86: Brazil Pegylated Drugs Industry Volume (K Unit) Forecast, by Application 2020 & 2033
- Table 87: Argentina Pegylated Drugs Industry Revenue (billion) Forecast, by Application 2020 & 2033
- Table 88: Argentina Pegylated Drugs Industry Volume (K Unit) Forecast, by Application 2020 & 2033
- Table 89: Rest of South America Pegylated Drugs Industry Revenue (billion) Forecast, by Application 2020 & 2033
- Table 90: Rest of South America Pegylated Drugs Industry Volume (K Unit) Forecast, by Application 2020 & 2033
Frequently Asked Questions
1. What is the projected Compound Annual Growth Rate (CAGR) of the Pegylated Drugs Industry?
The projected CAGR is approximately 5.48%.
2. Which companies are prominent players in the Pegylated Drugs Industry?
Key companies in the market include Abcam Limited, Life Diagnostics, Merck KGaA, JenKem Technology USA Inc, Creative PEGworks, Laysan Bio Inc, Thermo Fisher Scientific Inc, Iris Biotech GmbH, Quanta BioDesign Ltd, Celares GmbH, Alpha Diagnostic Intl Inc, NOF America Corporation.
3. What are the main segments of the Pegylated Drugs Industry?
The market segments include Product Type, Protein Type, End User.
4. Can you provide details about the market size?
The market size is estimated to be USD 16.01 billion as of 2022.
5. What are some drivers contributing to market growth?
High Prevalence of Chronic Diseases; Increasing Adoption of Protein Treatments; Rise in Research and Development Funding by Key Players.
6. What are the notable trends driving market growth?
The Colony-stimulating Factors Segment is Expected to Grow at a Significant Rate Over the Forecast Period.
7. Are there any restraints impacting market growth?
Drug Failures and Drug Recalls.
8. Can you provide examples of recent developments in the market?
In November 2022, Nektar Therapeutics announced the first presentation of preclinical data for NKTR-288 at the 2022 Society for Immunotherapy of Cancer (SITC) Annual Meeting. NKTR-288 is a novel polyethylene glycol (PEG)-the conjugate of interferon-gamma (IFN-γ); it is designed to modify the binding of IFN-γ to its substrates and optimize the duration of IFN-γ signaling. IFN-γ is a cytokine that induces cellular antigen presentation and enhances tumor antigen-specific cytotoxic T-cell response and may have applications in several therapeutic areas, including oncology and infectious diseases.
9. What pricing options are available for accessing the report?
Pricing options include single-user, multi-user, and enterprise licenses priced at USD 4750, USD 5250, and USD 8750 respectively.
10. Is the market size provided in terms of value or volume?
The market size is provided in terms of value, measured in billion and volume, measured in K Unit.
11. Are there any specific market keywords associated with the report?
Yes, the market keyword associated with the report is "Pegylated Drugs Industry," which aids in identifying and referencing the specific market segment covered.
12. How do I determine which pricing option suits my needs best?
The pricing options vary based on user requirements and access needs. Individual users may opt for single-user licenses, while businesses requiring broader access may choose multi-user or enterprise licenses for cost-effective access to the report.
13. Are there any additional resources or data provided in the Pegylated Drugs Industry report?
While the report offers comprehensive insights, it's advisable to review the specific contents or supplementary materials provided to ascertain if additional resources or data are available.
14. How can I stay updated on further developments or reports in the Pegylated Drugs Industry?
To stay informed about further developments, trends, and reports in the Pegylated Drugs Industry, consider subscribing to industry newsletters, following relevant companies and organizations, or regularly checking reputable industry news sources and publications.
Methodology
Step 1 - Identification of Relevant Samples Size from Population Database


Step 2 - Approaches for Defining Global Market Size (Value, Volume* & Price*)

Note*: In applicable scenarios
Step 3 - Data Sources
Primary Research
- Web Analytics
- Survey Reports
- Research Institute
- Latest Research Reports
- Opinion Leaders
Secondary Research
- Annual Reports
- White Paper
- Latest Press Release
- Industry Association
- Paid Database
- Investor Presentations

Step 4 - Data Triangulation
Involves using different sources of information in order to increase the validity of a study
These sources are likely to be stakeholders in a program - participants, other researchers, program staff, other community members, and so on.
Then we put all data in single framework & apply various statistical tools to find out the dynamic on the market.
During the analysis stage, feedback from the stakeholder groups would be compared to determine areas of agreement as well as areas of divergence