

Key Insights
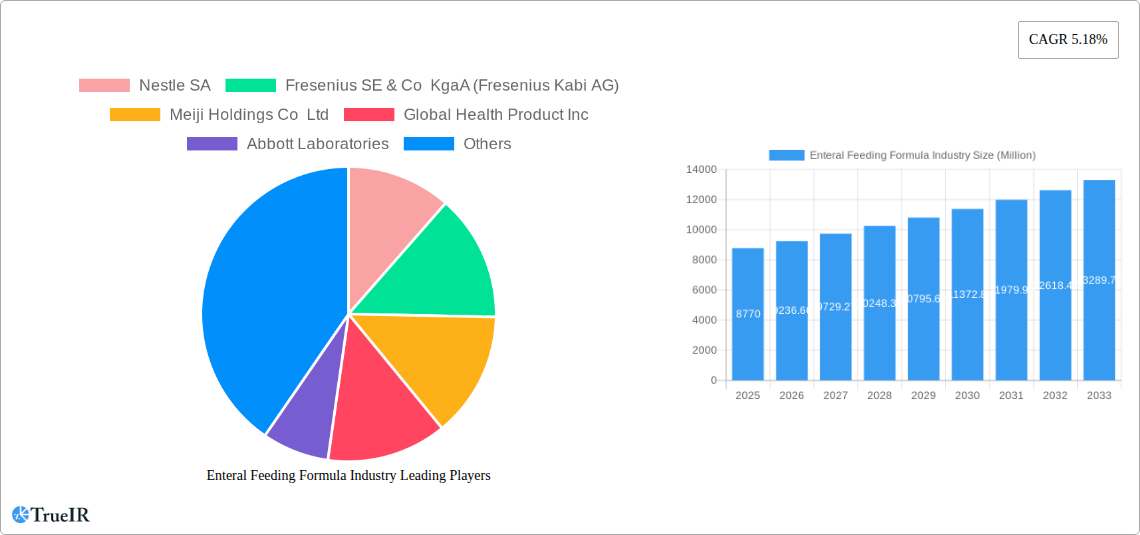
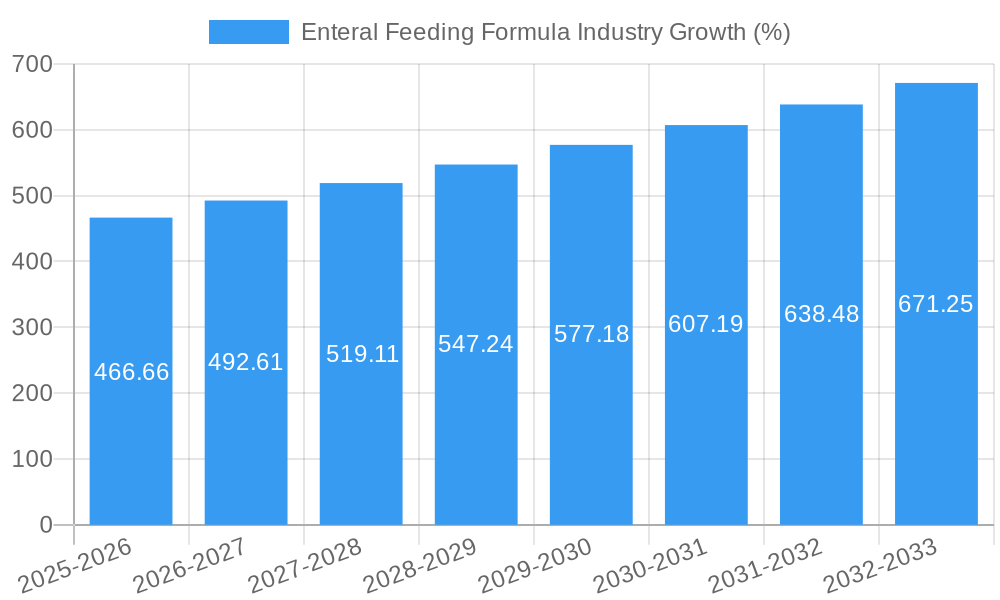
The enteral feeding formula market, valued at $8.77 billion in 2025, is projected to experience robust growth, exhibiting a compound annual growth rate (CAGR) of 5.18% from 2025 to 2033. This expansion is fueled by several key drivers. The aging global population, leading to an increase in chronic diseases requiring specialized nutritional support, is a significant factor. Advances in formula technology, offering more tailored solutions for specific conditions like oncology, neurology, and diabetes, are further stimulating market growth. The rising prevalence of chronic illnesses such as cancer, stroke, and Alzheimer's disease necessitates enteral nutrition, significantly contributing to market demand. Increased awareness among healthcare professionals and patients regarding the benefits of enteral nutrition compared to parenteral nutrition also contributes to market expansion. Growth is further supported by the increasing number of home healthcare settings, enabling convenient and cost-effective enteral feeding.
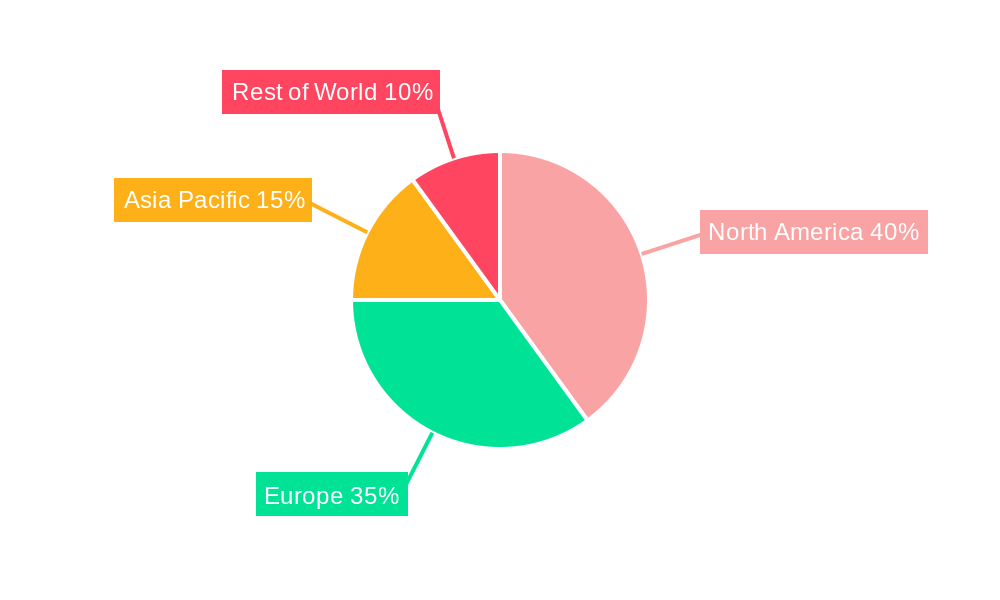
However, the market faces certain restraints. High costs associated with specialized formulas and the need for skilled healthcare professionals for administration can limit accessibility, particularly in developing regions. Furthermore, potential side effects associated with enteral nutrition, such as diarrhea and aspiration, may hinder market growth. Despite these challenges, the market is segmented by product (standard and disease-specific formulas), application (oncology, neurology, critical care, etc.), end-user (hospitals, home care agencies), and distribution channel (hospitals, retail pharmacies, online pharmacies). This segmentation offers diverse growth opportunities for companies like Nestlé, Fresenius Kabi, Abbott Laboratories, and Danone, among others. Regional variations exist, with North America and Europe currently dominating the market, but Asia-Pacific is expected to witness significant growth due to rising healthcare expenditure and increasing prevalence of chronic diseases. The competitive landscape is characterized by established players and emerging companies, fostering innovation and expansion within the market.
Enteral Feeding Formula Industry Report: 2019-2033
This comprehensive report provides a detailed analysis of the global enteral feeding formula market, offering invaluable insights for stakeholders across the industry value chain. Covering the period 2019-2033, with a focus on 2025, this report projects a dynamic market landscape shaped by technological advancements, evolving consumer preferences, and intense competitive activity. The report leverages extensive data analysis to forecast market size, growth rates (CAGR), and market penetration across diverse segments.
Enteral Feeding Formula Industry Market Structure & Competitive Landscape
The enteral feeding formula market exhibits a moderately consolidated structure, with several multinational corporations holding significant market share. The Herfindahl-Hirschman Index (HHI) is estimated at xx in 2025, indicating a moderately competitive landscape. Key players, including Nestle SA, Fresenius SE & Co KgaA (Fresenius Kabi AG), Abbott Laboratories, and Danone SA (Nutricia), drive innovation through R&D investments, focusing on specialized formulas catering to diverse clinical needs. Regulatory approvals, particularly in developed markets, significantly impact market entry and growth. The industry faces increasing pressure from generic and private-label products.
Key Aspects:
- Market Concentration: Moderate, with an estimated HHI of xx in 2025.
- Innovation Drivers: Growing demand for specialized formulas, technological advancements in formula composition and delivery systems.
- Regulatory Impacts: Stringent regulations regarding product safety and efficacy influence market access and pricing.
- Product Substitutes: Limited direct substitutes, but competition exists from alternative nutritional support methods.
- End-User Segmentation: Hospitals, home care agencies, and long-term care facilities constitute major end-users.
- M&A Trends: The market has witnessed xx M&A deals valued at xx Million USD in the historical period (2019-2024), driven by consolidation and expansion strategies.
Enteral Feeding Formula Industry Market Trends & Opportunities
The global enteral feeding formula market is experiencing robust growth, projected at a CAGR of xx% during 2025-2033, driven by factors such as an aging population, rising prevalence of chronic diseases (e.g., diabetes, oncology), and increasing healthcare expenditure. Technological advancements are enabling the development of advanced formulas with enhanced nutritional profiles and improved palatability. Consumer preference is shifting towards convenient, ready-to-use formulas, while the demand for specialized, disease-specific formulas is rapidly increasing. Competitive dynamics are characterized by intense innovation, product differentiation, and strategic partnerships. Market penetration rates vary significantly across regions and segments, with developed markets exhibiting higher penetration compared to emerging economies.
Dominant Markets & Segments in Enteral Feeding Formula Industry
The North American market currently holds the largest share of the global enteral feeding formula market, followed by Europe and Asia-Pacific. Within segments, the demand for disease-specific formulas is experiencing particularly robust growth, driven by the rising prevalence of chronic illnesses requiring specialized nutritional support. The hospital segment is a significant revenue contributor, reflecting the high volume of patients requiring enteral feeding in hospital settings.
Key Growth Drivers:
- North America: Strong healthcare infrastructure, high healthcare expenditure, aging population.
- Europe: Developed healthcare systems, high prevalence of chronic diseases.
- Asia-Pacific: Rapidly growing economies, increasing healthcare awareness, rising prevalence of chronic diseases.
- Disease-specific formulas: High demand driven by rising prevalence of chronic diseases such as oncology and neurology.
- Hospital segment: High volume of patients requiring enteral nutrition in hospitals.
Dominant segments: Disease-Specific Formulas by Product; Oncology and Neurology by Application; Hospitals by End User; Hospitals by Distribution Channel.
Enteral Feeding Formula Industry Product Analysis
Product innovation focuses on developing advanced formulas tailored to specific clinical conditions, improving palatability, and enhancing ease of use. This includes the development of ready-to-use formulas, specialized formulas for specific diseases, and formulas with improved taste and texture. These innovations enhance the overall patient experience and improve treatment compliance. Key competitive advantages arise from superior product efficacy, improved patient outcomes, and a strong brand reputation.
Key Drivers, Barriers & Challenges in Enteral Feeding Formula Industry
Key Drivers:
- Rising prevalence of chronic diseases.
- Aging global population.
- Technological advancements leading to improved formulas.
- Increasing healthcare expenditure.
Key Challenges:
- Stringent regulatory approvals impacting time to market.
- High R&D costs for developing specialized formulas.
- Supply chain disruptions impacting product availability.
- Competition from generic and private-label products, potentially reducing margins. This could lead to an estimated xx Million USD loss in revenue by 2033.
Growth Drivers in the Enteral Feeding Formula Industry Market
Growth is fueled by the increasing prevalence of chronic diseases requiring specialized nutritional support, an aging population, and technological advancements leading to improved formula efficacy and convenience. Expanding healthcare infrastructure in emerging economies and increasing healthcare expenditure are also significant contributors.
Challenges Impacting Enteral Feeding Formula Industry Growth
Regulatory hurdles, supply chain complexities, intense competition, and fluctuating raw material prices represent significant challenges. These factors can lead to delays in product launches, increased costs, and reduced profitability.
Key Players Shaping the Enteral Feeding Formula Industry Market
- Nestle SA
- Fresenius SE & Co KgaA (Fresenius Kabi AG)
- Meiji Holdings Co Ltd
- Global Health Product Inc
- Abbott Laboratories
- Danone SA (Nutricia)
- Functional Formularies
- Hormel Foods Corporation
- B Braun Melsungen AG
- Victus Inc
- Reckitt Benckiser Group plc (Mead Johnson)
- Kate Farms
Significant Enteral Feeding Formula Industry Industry Milestones
- September 2022: Kate Farms secured USD 75 Million in Series C funding, boosting plant-based research and product innovation.
- September 2022: Kate Farms launched Adult Standard 1.4, a high-calorie formula, expanding its product portfolio and market reach.
Future Outlook for Enteral Feeding Formula Industry Market
The enteral feeding formula market is poised for continued growth, driven by long-term trends such as an aging population and the rising prevalence of chronic diseases. Strategic opportunities lie in developing innovative, specialized formulas, expanding into emerging markets, and leveraging digital technologies to improve patient care and engagement. The market's future success will hinge on adapting to evolving regulatory landscapes and meeting the diverse needs of a growing and aging population.
Enteral Feeding Formula Industry Segmentation
-
1. Product
- 1.1. Standard Formulas
- 1.2. Disease-specific Formulas
-
2. Application
- 2.1. Oncology
- 2.2. Neurology
- 2.3. Critical Care
- 2.4. Diabetes
- 2.5. Gastroenterology
- 2.6. Other Applications
-
3. End User
- 3.1. Hospital
- 3.2. Home Care Agencies and Hospices
- 3.3. Other End Users
-
4. Distributuion Channel
- 4.1. Hospitals
- 4.2. Retail Pharmacies
- 4.3. Online Pharmacies
Enteral Feeding Formula Industry Segmentation By Geography
-
1. North America
- 1.1. United States
- 1.2. Canada
- 1.3. Mexico
-
2. Europe
- 2.1. Germany
- 2.2. United Kingdom
- 2.3. France
- 2.4. Italy
- 2.5. Spain
- 2.6. Rest of Europe
-
3. Asia Pacific
- 3.1. China
- 3.2. Japan
- 3.3. India
- 3.4. Australia
- 3.5. South Korea
- 3.6. Rest of Asia Pacific
-
4. Middle East and Africa
- 4.1. GCC
- 4.2. South Africa
- 4.3. Rest of Middle East and Africa
-
5. South America
- 5.1. Brazil
- 5.2. Argentina
- 5.3. Rest of South America
Enteral Feeding Formula Industry REPORT HIGHLIGHTS
| Aspects | Details |
|---|---|
| Study Period | 2019-2033 |
| Base Year | 2024 |
| Estimated Year | 2025 |
| Forecast Period | 2025-2033 |
| Historical Period | 2019-2024 |
| Growth Rate | CAGR of 5.18% from 2019-2033 |
| Segmentation |
|
Table of Contents
- 1. Introduction
- 1.1. Research Scope
- 1.2. Market Segmentation
- 1.3. Research Methodology
- 1.4. Definitions and Assumptions
- 2. Executive Summary
- 2.1. Introduction
- 3. Market Dynamics
- 3.1. Introduction
- 3.2. Market Drivers
- 3.2.1. Increasing Prevalence of Metabolic and Chronic Diseases; Increasing Spending on Patient Care; Growing Geriatric Population
- 3.3. Market Restrains
- 3.3.1. Complications Associated with Enteral Nutrition; High Cost and Low Adherence Rates in Developing Countries
- 3.4. Market Trends
- 3.4.1. Oncology Segment is Expected to Hold a Significant Market Share in the Enteral Feeding Formulas Market
- 4. Market Factor Analysis
- 4.1. Porters Five Forces
- 4.2. Supply/Value Chain
- 4.3. PESTEL analysis
- 4.4. Market Entropy
- 4.5. Patent/Trademark Analysis
- 5. Global Enteral Feeding Formula Industry Analysis, Insights and Forecast, 2019-2031
- 5.1. Market Analysis, Insights and Forecast - by Product
- 5.1.1. Standard Formulas
- 5.1.2. Disease-specific Formulas
- 5.2. Market Analysis, Insights and Forecast - by Application
- 5.2.1. Oncology
- 5.2.2. Neurology
- 5.2.3. Critical Care
- 5.2.4. Diabetes
- 5.2.5. Gastroenterology
- 5.2.6. Other Applications
- 5.3. Market Analysis, Insights and Forecast - by End User
- 5.3.1. Hospital
- 5.3.2. Home Care Agencies and Hospices
- 5.3.3. Other End Users
- 5.4. Market Analysis, Insights and Forecast - by Distributuion Channel
- 5.4.1. Hospitals
- 5.4.2. Retail Pharmacies
- 5.4.3. Online Pharmacies
- 5.5. Market Analysis, Insights and Forecast - by Region
- 5.5.1. North America
- 5.5.2. Europe
- 5.5.3. Asia Pacific
- 5.5.4. Middle East and Africa
- 5.5.5. South America
- 5.1. Market Analysis, Insights and Forecast - by Product
- 6. North America Enteral Feeding Formula Industry Analysis, Insights and Forecast, 2019-2031
- 6.1. Market Analysis, Insights and Forecast - by Product
- 6.1.1. Standard Formulas
- 6.1.2. Disease-specific Formulas
- 6.2. Market Analysis, Insights and Forecast - by Application
- 6.2.1. Oncology
- 6.2.2. Neurology
- 6.2.3. Critical Care
- 6.2.4. Diabetes
- 6.2.5. Gastroenterology
- 6.2.6. Other Applications
- 6.3. Market Analysis, Insights and Forecast - by End User
- 6.3.1. Hospital
- 6.3.2. Home Care Agencies and Hospices
- 6.3.3. Other End Users
- 6.4. Market Analysis, Insights and Forecast - by Distributuion Channel
- 6.4.1. Hospitals
- 6.4.2. Retail Pharmacies
- 6.4.3. Online Pharmacies
- 6.1. Market Analysis, Insights and Forecast - by Product
- 7. Europe Enteral Feeding Formula Industry Analysis, Insights and Forecast, 2019-2031
- 7.1. Market Analysis, Insights and Forecast - by Product
- 7.1.1. Standard Formulas
- 7.1.2. Disease-specific Formulas
- 7.2. Market Analysis, Insights and Forecast - by Application
- 7.2.1. Oncology
- 7.2.2. Neurology
- 7.2.3. Critical Care
- 7.2.4. Diabetes
- 7.2.5. Gastroenterology
- 7.2.6. Other Applications
- 7.3. Market Analysis, Insights and Forecast - by End User
- 7.3.1. Hospital
- 7.3.2. Home Care Agencies and Hospices
- 7.3.3. Other End Users
- 7.4. Market Analysis, Insights and Forecast - by Distributuion Channel
- 7.4.1. Hospitals
- 7.4.2. Retail Pharmacies
- 7.4.3. Online Pharmacies
- 7.1. Market Analysis, Insights and Forecast - by Product
- 8. Asia Pacific Enteral Feeding Formula Industry Analysis, Insights and Forecast, 2019-2031
- 8.1. Market Analysis, Insights and Forecast - by Product
- 8.1.1. Standard Formulas
- 8.1.2. Disease-specific Formulas
- 8.2. Market Analysis, Insights and Forecast - by Application
- 8.2.1. Oncology
- 8.2.2. Neurology
- 8.2.3. Critical Care
- 8.2.4. Diabetes
- 8.2.5. Gastroenterology
- 8.2.6. Other Applications
- 8.3. Market Analysis, Insights and Forecast - by End User
- 8.3.1. Hospital
- 8.3.2. Home Care Agencies and Hospices
- 8.3.3. Other End Users
- 8.4. Market Analysis, Insights and Forecast - by Distributuion Channel
- 8.4.1. Hospitals
- 8.4.2. Retail Pharmacies
- 8.4.3. Online Pharmacies
- 8.1. Market Analysis, Insights and Forecast - by Product
- 9. Middle East and Africa Enteral Feeding Formula Industry Analysis, Insights and Forecast, 2019-2031
- 9.1. Market Analysis, Insights and Forecast - by Product
- 9.1.1. Standard Formulas
- 9.1.2. Disease-specific Formulas
- 9.2. Market Analysis, Insights and Forecast - by Application
- 9.2.1. Oncology
- 9.2.2. Neurology
- 9.2.3. Critical Care
- 9.2.4. Diabetes
- 9.2.5. Gastroenterology
- 9.2.6. Other Applications
- 9.3. Market Analysis, Insights and Forecast - by End User
- 9.3.1. Hospital
- 9.3.2. Home Care Agencies and Hospices
- 9.3.3. Other End Users
- 9.4. Market Analysis, Insights and Forecast - by Distributuion Channel
- 9.4.1. Hospitals
- 9.4.2. Retail Pharmacies
- 9.4.3. Online Pharmacies
- 9.1. Market Analysis, Insights and Forecast - by Product
- 10. South America Enteral Feeding Formula Industry Analysis, Insights and Forecast, 2019-2031
- 10.1. Market Analysis, Insights and Forecast - by Product
- 10.1.1. Standard Formulas
- 10.1.2. Disease-specific Formulas
- 10.2. Market Analysis, Insights and Forecast - by Application
- 10.2.1. Oncology
- 10.2.2. Neurology
- 10.2.3. Critical Care
- 10.2.4. Diabetes
- 10.2.5. Gastroenterology
- 10.2.6. Other Applications
- 10.3. Market Analysis, Insights and Forecast - by End User
- 10.3.1. Hospital
- 10.3.2. Home Care Agencies and Hospices
- 10.3.3. Other End Users
- 10.4. Market Analysis, Insights and Forecast - by Distributuion Channel
- 10.4.1. Hospitals
- 10.4.2. Retail Pharmacies
- 10.4.3. Online Pharmacies
- 10.1. Market Analysis, Insights and Forecast - by Product
- 11. North America Enteral Feeding Formula Industry Analysis, Insights and Forecast, 2019-2031
- 11.1. Market Analysis, Insights and Forecast - By Country/Sub-region
- 11.1.1 United States
- 11.1.2 Canada
- 11.1.3 Mexico
- 12. South America Enteral Feeding Formula Industry Analysis, Insights and Forecast, 2019-2031
- 12.1. Market Analysis, Insights and Forecast - By Country/Sub-region
- 12.1.1 Brazil
- 12.1.2 Mexico
- 12.1.3 Rest of South America
- 13. Europe Enteral Feeding Formula Industry Analysis, Insights and Forecast, 2019-2031
- 13.1. Market Analysis, Insights and Forecast - By Country/Sub-region
- 13.1.1 United Kingdom
- 13.1.2 Germany
- 13.1.3 France
- 13.1.4 Italy
- 13.1.5 Spain
- 13.1.6 Russia
- 13.1.7 Rest of Europe
- 14. Asia Pacific Enteral Feeding Formula Industry Analysis, Insights and Forecast, 2019-2031
- 14.1. Market Analysis, Insights and Forecast - By Country/Sub-region
- 14.1.1 China
- 14.1.2 Japan
- 14.1.3 India
- 14.1.4 South Korea
- 14.1.5 Taiwan
- 14.1.6 Australia
- 14.1.7 Rest of Asia-Pacific
- 15. MEA Enteral Feeding Formula Industry Analysis, Insights and Forecast, 2019-2031
- 15.1. Market Analysis, Insights and Forecast - By Country/Sub-region
- 15.1.1 Middle East
- 15.1.2 Africa
- 16. Competitive Analysis
- 16.1. Global Market Share Analysis 2024
- 16.2. Company Profiles
- 16.2.1 Nestle SA
- 16.2.1.1. Overview
- 16.2.1.2. Products
- 16.2.1.3. SWOT Analysis
- 16.2.1.4. Recent Developments
- 16.2.1.5. Financials (Based on Availability)
- 16.2.2 Fresenius SE & Co KgaA (Fresenius Kabi AG)
- 16.2.2.1. Overview
- 16.2.2.2. Products
- 16.2.2.3. SWOT Analysis
- 16.2.2.4. Recent Developments
- 16.2.2.5. Financials (Based on Availability)
- 16.2.3 Meiji Holdings Co Ltd
- 16.2.3.1. Overview
- 16.2.3.2. Products
- 16.2.3.3. SWOT Analysis
- 16.2.3.4. Recent Developments
- 16.2.3.5. Financials (Based on Availability)
- 16.2.4 Global Health Product Inc
- 16.2.4.1. Overview
- 16.2.4.2. Products
- 16.2.4.3. SWOT Analysis
- 16.2.4.4. Recent Developments
- 16.2.4.5. Financials (Based on Availability)
- 16.2.5 Abbott Laboratories
- 16.2.5.1. Overview
- 16.2.5.2. Products
- 16.2.5.3. SWOT Analysis
- 16.2.5.4. Recent Developments
- 16.2.5.5. Financials (Based on Availability)
- 16.2.6 Danone SA (Nutricia)
- 16.2.6.1. Overview
- 16.2.6.2. Products
- 16.2.6.3. SWOT Analysis
- 16.2.6.4. Recent Developments
- 16.2.6.5. Financials (Based on Availability)
- 16.2.7 Functional Formularies*List Not Exhaustive
- 16.2.7.1. Overview
- 16.2.7.2. Products
- 16.2.7.3. SWOT Analysis
- 16.2.7.4. Recent Developments
- 16.2.7.5. Financials (Based on Availability)
- 16.2.8 Hormel Foods Corporation
- 16.2.8.1. Overview
- 16.2.8.2. Products
- 16.2.8.3. SWOT Analysis
- 16.2.8.4. Recent Developments
- 16.2.8.5. Financials (Based on Availability)
- 16.2.9 B Braun Melsungen AG
- 16.2.9.1. Overview
- 16.2.9.2. Products
- 16.2.9.3. SWOT Analysis
- 16.2.9.4. Recent Developments
- 16.2.9.5. Financials (Based on Availability)
- 16.2.10 Victus Inc
- 16.2.10.1. Overview
- 16.2.10.2. Products
- 16.2.10.3. SWOT Analysis
- 16.2.10.4. Recent Developments
- 16.2.10.5. Financials (Based on Availability)
- 16.2.11 Reckitt Benckiser Group plc (Mead Johnson)
- 16.2.11.1. Overview
- 16.2.11.2. Products
- 16.2.11.3. SWOT Analysis
- 16.2.11.4. Recent Developments
- 16.2.11.5. Financials (Based on Availability)
- 16.2.12 Kate Farms
- 16.2.12.1. Overview
- 16.2.12.2. Products
- 16.2.12.3. SWOT Analysis
- 16.2.12.4. Recent Developments
- 16.2.12.5. Financials (Based on Availability)
- 16.2.1 Nestle SA
List of Figures
- Figure 1: Global Enteral Feeding Formula Industry Revenue Breakdown (Million, %) by Region 2024 & 2032
- Figure 2: North America Enteral Feeding Formula Industry Revenue (Million), by Country 2024 & 2032
- Figure 3: North America Enteral Feeding Formula Industry Revenue Share (%), by Country 2024 & 2032
- Figure 4: South America Enteral Feeding Formula Industry Revenue (Million), by Country 2024 & 2032
- Figure 5: South America Enteral Feeding Formula Industry Revenue Share (%), by Country 2024 & 2032
- Figure 6: Europe Enteral Feeding Formula Industry Revenue (Million), by Country 2024 & 2032
- Figure 7: Europe Enteral Feeding Formula Industry Revenue Share (%), by Country 2024 & 2032
- Figure 8: Asia Pacific Enteral Feeding Formula Industry Revenue (Million), by Country 2024 & 2032
- Figure 9: Asia Pacific Enteral Feeding Formula Industry Revenue Share (%), by Country 2024 & 2032
- Figure 10: MEA Enteral Feeding Formula Industry Revenue (Million), by Country 2024 & 2032
- Figure 11: MEA Enteral Feeding Formula Industry Revenue Share (%), by Country 2024 & 2032
- Figure 12: North America Enteral Feeding Formula Industry Revenue (Million), by Product 2024 & 2032
- Figure 13: North America Enteral Feeding Formula Industry Revenue Share (%), by Product 2024 & 2032
- Figure 14: North America Enteral Feeding Formula Industry Revenue (Million), by Application 2024 & 2032
- Figure 15: North America Enteral Feeding Formula Industry Revenue Share (%), by Application 2024 & 2032
- Figure 16: North America Enteral Feeding Formula Industry Revenue (Million), by End User 2024 & 2032
- Figure 17: North America Enteral Feeding Formula Industry Revenue Share (%), by End User 2024 & 2032
- Figure 18: North America Enteral Feeding Formula Industry Revenue (Million), by Distributuion Channel 2024 & 2032
- Figure 19: North America Enteral Feeding Formula Industry Revenue Share (%), by Distributuion Channel 2024 & 2032
- Figure 20: North America Enteral Feeding Formula Industry Revenue (Million), by Country 2024 & 2032
- Figure 21: North America Enteral Feeding Formula Industry Revenue Share (%), by Country 2024 & 2032
- Figure 22: Europe Enteral Feeding Formula Industry Revenue (Million), by Product 2024 & 2032
- Figure 23: Europe Enteral Feeding Formula Industry Revenue Share (%), by Product 2024 & 2032
- Figure 24: Europe Enteral Feeding Formula Industry Revenue (Million), by Application 2024 & 2032
- Figure 25: Europe Enteral Feeding Formula Industry Revenue Share (%), by Application 2024 & 2032
- Figure 26: Europe Enteral Feeding Formula Industry Revenue (Million), by End User 2024 & 2032
- Figure 27: Europe Enteral Feeding Formula Industry Revenue Share (%), by End User 2024 & 2032
- Figure 28: Europe Enteral Feeding Formula Industry Revenue (Million), by Distributuion Channel 2024 & 2032
- Figure 29: Europe Enteral Feeding Formula Industry Revenue Share (%), by Distributuion Channel 2024 & 2032
- Figure 30: Europe Enteral Feeding Formula Industry Revenue (Million), by Country 2024 & 2032
- Figure 31: Europe Enteral Feeding Formula Industry Revenue Share (%), by Country 2024 & 2032
- Figure 32: Asia Pacific Enteral Feeding Formula Industry Revenue (Million), by Product 2024 & 2032
- Figure 33: Asia Pacific Enteral Feeding Formula Industry Revenue Share (%), by Product 2024 & 2032
- Figure 34: Asia Pacific Enteral Feeding Formula Industry Revenue (Million), by Application 2024 & 2032
- Figure 35: Asia Pacific Enteral Feeding Formula Industry Revenue Share (%), by Application 2024 & 2032
- Figure 36: Asia Pacific Enteral Feeding Formula Industry Revenue (Million), by End User 2024 & 2032
- Figure 37: Asia Pacific Enteral Feeding Formula Industry Revenue Share (%), by End User 2024 & 2032
- Figure 38: Asia Pacific Enteral Feeding Formula Industry Revenue (Million), by Distributuion Channel 2024 & 2032
- Figure 39: Asia Pacific Enteral Feeding Formula Industry Revenue Share (%), by Distributuion Channel 2024 & 2032
- Figure 40: Asia Pacific Enteral Feeding Formula Industry Revenue (Million), by Country 2024 & 2032
- Figure 41: Asia Pacific Enteral Feeding Formula Industry Revenue Share (%), by Country 2024 & 2032
- Figure 42: Middle East and Africa Enteral Feeding Formula Industry Revenue (Million), by Product 2024 & 2032
- Figure 43: Middle East and Africa Enteral Feeding Formula Industry Revenue Share (%), by Product 2024 & 2032
- Figure 44: Middle East and Africa Enteral Feeding Formula Industry Revenue (Million), by Application 2024 & 2032
- Figure 45: Middle East and Africa Enteral Feeding Formula Industry Revenue Share (%), by Application 2024 & 2032
- Figure 46: Middle East and Africa Enteral Feeding Formula Industry Revenue (Million), by End User 2024 & 2032
- Figure 47: Middle East and Africa Enteral Feeding Formula Industry Revenue Share (%), by End User 2024 & 2032
- Figure 48: Middle East and Africa Enteral Feeding Formula Industry Revenue (Million), by Distributuion Channel 2024 & 2032
- Figure 49: Middle East and Africa Enteral Feeding Formula Industry Revenue Share (%), by Distributuion Channel 2024 & 2032
- Figure 50: Middle East and Africa Enteral Feeding Formula Industry Revenue (Million), by Country 2024 & 2032
- Figure 51: Middle East and Africa Enteral Feeding Formula Industry Revenue Share (%), by Country 2024 & 2032
- Figure 52: South America Enteral Feeding Formula Industry Revenue (Million), by Product 2024 & 2032
- Figure 53: South America Enteral Feeding Formula Industry Revenue Share (%), by Product 2024 & 2032
- Figure 54: South America Enteral Feeding Formula Industry Revenue (Million), by Application 2024 & 2032
- Figure 55: South America Enteral Feeding Formula Industry Revenue Share (%), by Application 2024 & 2032
- Figure 56: South America Enteral Feeding Formula Industry Revenue (Million), by End User 2024 & 2032
- Figure 57: South America Enteral Feeding Formula Industry Revenue Share (%), by End User 2024 & 2032
- Figure 58: South America Enteral Feeding Formula Industry Revenue (Million), by Distributuion Channel 2024 & 2032
- Figure 59: South America Enteral Feeding Formula Industry Revenue Share (%), by Distributuion Channel 2024 & 2032
- Figure 60: South America Enteral Feeding Formula Industry Revenue (Million), by Country 2024 & 2032
- Figure 61: South America Enteral Feeding Formula Industry Revenue Share (%), by Country 2024 & 2032
List of Tables
- Table 1: Global Enteral Feeding Formula Industry Revenue Million Forecast, by Region 2019 & 2032
- Table 2: Global Enteral Feeding Formula Industry Revenue Million Forecast, by Product 2019 & 2032
- Table 3: Global Enteral Feeding Formula Industry Revenue Million Forecast, by Application 2019 & 2032
- Table 4: Global Enteral Feeding Formula Industry Revenue Million Forecast, by End User 2019 & 2032
- Table 5: Global Enteral Feeding Formula Industry Revenue Million Forecast, by Distributuion Channel 2019 & 2032
- Table 6: Global Enteral Feeding Formula Industry Revenue Million Forecast, by Region 2019 & 2032
- Table 7: Global Enteral Feeding Formula Industry Revenue Million Forecast, by Country 2019 & 2032
- Table 8: United States Enteral Feeding Formula Industry Revenue (Million) Forecast, by Application 2019 & 2032
- Table 9: Canada Enteral Feeding Formula Industry Revenue (Million) Forecast, by Application 2019 & 2032
- Table 10: Mexico Enteral Feeding Formula Industry Revenue (Million) Forecast, by Application 2019 & 2032
- Table 11: Global Enteral Feeding Formula Industry Revenue Million Forecast, by Country 2019 & 2032
- Table 12: Brazil Enteral Feeding Formula Industry Revenue (Million) Forecast, by Application 2019 & 2032
- Table 13: Mexico Enteral Feeding Formula Industry Revenue (Million) Forecast, by Application 2019 & 2032
- Table 14: Rest of South America Enteral Feeding Formula Industry Revenue (Million) Forecast, by Application 2019 & 2032
- Table 15: Global Enteral Feeding Formula Industry Revenue Million Forecast, by Country 2019 & 2032
- Table 16: United Kingdom Enteral Feeding Formula Industry Revenue (Million) Forecast, by Application 2019 & 2032
- Table 17: Germany Enteral Feeding Formula Industry Revenue (Million) Forecast, by Application 2019 & 2032
- Table 18: France Enteral Feeding Formula Industry Revenue (Million) Forecast, by Application 2019 & 2032
- Table 19: Italy Enteral Feeding Formula Industry Revenue (Million) Forecast, by Application 2019 & 2032
- Table 20: Spain Enteral Feeding Formula Industry Revenue (Million) Forecast, by Application 2019 & 2032
- Table 21: Russia Enteral Feeding Formula Industry Revenue (Million) Forecast, by Application 2019 & 2032
- Table 22: Rest of Europe Enteral Feeding Formula Industry Revenue (Million) Forecast, by Application 2019 & 2032
- Table 23: Global Enteral Feeding Formula Industry Revenue Million Forecast, by Country 2019 & 2032
- Table 24: China Enteral Feeding Formula Industry Revenue (Million) Forecast, by Application 2019 & 2032
- Table 25: Japan Enteral Feeding Formula Industry Revenue (Million) Forecast, by Application 2019 & 2032
- Table 26: India Enteral Feeding Formula Industry Revenue (Million) Forecast, by Application 2019 & 2032
- Table 27: South Korea Enteral Feeding Formula Industry Revenue (Million) Forecast, by Application 2019 & 2032
- Table 28: Taiwan Enteral Feeding Formula Industry Revenue (Million) Forecast, by Application 2019 & 2032
- Table 29: Australia Enteral Feeding Formula Industry Revenue (Million) Forecast, by Application 2019 & 2032
- Table 30: Rest of Asia-Pacific Enteral Feeding Formula Industry Revenue (Million) Forecast, by Application 2019 & 2032
- Table 31: Global Enteral Feeding Formula Industry Revenue Million Forecast, by Country 2019 & 2032
- Table 32: Middle East Enteral Feeding Formula Industry Revenue (Million) Forecast, by Application 2019 & 2032
- Table 33: Africa Enteral Feeding Formula Industry Revenue (Million) Forecast, by Application 2019 & 2032
- Table 34: Global Enteral Feeding Formula Industry Revenue Million Forecast, by Product 2019 & 2032
- Table 35: Global Enteral Feeding Formula Industry Revenue Million Forecast, by Application 2019 & 2032
- Table 36: Global Enteral Feeding Formula Industry Revenue Million Forecast, by End User 2019 & 2032
- Table 37: Global Enteral Feeding Formula Industry Revenue Million Forecast, by Distributuion Channel 2019 & 2032
- Table 38: Global Enteral Feeding Formula Industry Revenue Million Forecast, by Country 2019 & 2032
- Table 39: United States Enteral Feeding Formula Industry Revenue (Million) Forecast, by Application 2019 & 2032
- Table 40: Canada Enteral Feeding Formula Industry Revenue (Million) Forecast, by Application 2019 & 2032
- Table 41: Mexico Enteral Feeding Formula Industry Revenue (Million) Forecast, by Application 2019 & 2032
- Table 42: Global Enteral Feeding Formula Industry Revenue Million Forecast, by Product 2019 & 2032
- Table 43: Global Enteral Feeding Formula Industry Revenue Million Forecast, by Application 2019 & 2032
- Table 44: Global Enteral Feeding Formula Industry Revenue Million Forecast, by End User 2019 & 2032
- Table 45: Global Enteral Feeding Formula Industry Revenue Million Forecast, by Distributuion Channel 2019 & 2032
- Table 46: Global Enteral Feeding Formula Industry Revenue Million Forecast, by Country 2019 & 2032
- Table 47: Germany Enteral Feeding Formula Industry Revenue (Million) Forecast, by Application 2019 & 2032
- Table 48: United Kingdom Enteral Feeding Formula Industry Revenue (Million) Forecast, by Application 2019 & 2032
- Table 49: France Enteral Feeding Formula Industry Revenue (Million) Forecast, by Application 2019 & 2032
- Table 50: Italy Enteral Feeding Formula Industry Revenue (Million) Forecast, by Application 2019 & 2032
- Table 51: Spain Enteral Feeding Formula Industry Revenue (Million) Forecast, by Application 2019 & 2032
- Table 52: Rest of Europe Enteral Feeding Formula Industry Revenue (Million) Forecast, by Application 2019 & 2032
- Table 53: Global Enteral Feeding Formula Industry Revenue Million Forecast, by Product 2019 & 2032
- Table 54: Global Enteral Feeding Formula Industry Revenue Million Forecast, by Application 2019 & 2032
- Table 55: Global Enteral Feeding Formula Industry Revenue Million Forecast, by End User 2019 & 2032
- Table 56: Global Enteral Feeding Formula Industry Revenue Million Forecast, by Distributuion Channel 2019 & 2032
- Table 57: Global Enteral Feeding Formula Industry Revenue Million Forecast, by Country 2019 & 2032
- Table 58: China Enteral Feeding Formula Industry Revenue (Million) Forecast, by Application 2019 & 2032
- Table 59: Japan Enteral Feeding Formula Industry Revenue (Million) Forecast, by Application 2019 & 2032
- Table 60: India Enteral Feeding Formula Industry Revenue (Million) Forecast, by Application 2019 & 2032
- Table 61: Australia Enteral Feeding Formula Industry Revenue (Million) Forecast, by Application 2019 & 2032
- Table 62: South Korea Enteral Feeding Formula Industry Revenue (Million) Forecast, by Application 2019 & 2032
- Table 63: Rest of Asia Pacific Enteral Feeding Formula Industry Revenue (Million) Forecast, by Application 2019 & 2032
- Table 64: Global Enteral Feeding Formula Industry Revenue Million Forecast, by Product 2019 & 2032
- Table 65: Global Enteral Feeding Formula Industry Revenue Million Forecast, by Application 2019 & 2032
- Table 66: Global Enteral Feeding Formula Industry Revenue Million Forecast, by End User 2019 & 2032
- Table 67: Global Enteral Feeding Formula Industry Revenue Million Forecast, by Distributuion Channel 2019 & 2032
- Table 68: Global Enteral Feeding Formula Industry Revenue Million Forecast, by Country 2019 & 2032
- Table 69: GCC Enteral Feeding Formula Industry Revenue (Million) Forecast, by Application 2019 & 2032
- Table 70: South Africa Enteral Feeding Formula Industry Revenue (Million) Forecast, by Application 2019 & 2032
- Table 71: Rest of Middle East and Africa Enteral Feeding Formula Industry Revenue (Million) Forecast, by Application 2019 & 2032
- Table 72: Global Enteral Feeding Formula Industry Revenue Million Forecast, by Product 2019 & 2032
- Table 73: Global Enteral Feeding Formula Industry Revenue Million Forecast, by Application 2019 & 2032
- Table 74: Global Enteral Feeding Formula Industry Revenue Million Forecast, by End User 2019 & 2032
- Table 75: Global Enteral Feeding Formula Industry Revenue Million Forecast, by Distributuion Channel 2019 & 2032
- Table 76: Global Enteral Feeding Formula Industry Revenue Million Forecast, by Country 2019 & 2032
- Table 77: Brazil Enteral Feeding Formula Industry Revenue (Million) Forecast, by Application 2019 & 2032
- Table 78: Argentina Enteral Feeding Formula Industry Revenue (Million) Forecast, by Application 2019 & 2032
- Table 79: Rest of South America Enteral Feeding Formula Industry Revenue (Million) Forecast, by Application 2019 & 2032
Frequently Asked Questions
1. What is the projected Compound Annual Growth Rate (CAGR) of the Enteral Feeding Formula Industry?
The projected CAGR is approximately 5.18%.
2. Which companies are prominent players in the Enteral Feeding Formula Industry?
Key companies in the market include Nestle SA, Fresenius SE & Co KgaA (Fresenius Kabi AG), Meiji Holdings Co Ltd, Global Health Product Inc, Abbott Laboratories, Danone SA (Nutricia), Functional Formularies*List Not Exhaustive, Hormel Foods Corporation, B Braun Melsungen AG, Victus Inc, Reckitt Benckiser Group plc (Mead Johnson), Kate Farms.
3. What are the main segments of the Enteral Feeding Formula Industry?
The market segments include Product, Application, End User, Distributuion Channel.
4. Can you provide details about the market size?
The market size is estimated to be USD 8.77 Million as of 2022.
5. What are some drivers contributing to market growth?
Increasing Prevalence of Metabolic and Chronic Diseases; Increasing Spending on Patient Care; Growing Geriatric Population.
6. What are the notable trends driving market growth?
Oncology Segment is Expected to Hold a Significant Market Share in the Enteral Feeding Formulas Market.
7. Are there any restraints impacting market growth?
Complications Associated with Enteral Nutrition; High Cost and Low Adherence Rates in Developing Countries.
8. Can you provide examples of recent developments in the market?
September 2022: Kate Farms raised USD 75 million in a Series C funding round led by life-science investor Novo Holdings. With this, Kate Farms will be able to increase its efforts in developing plant-based clinical nutrition research, product innovation, and development into more channels.
9. What pricing options are available for accessing the report?
Pricing options include single-user, multi-user, and enterprise licenses priced at USD 4750, USD 5250, and USD 8750 respectively.
10. Is the market size provided in terms of value or volume?
The market size is provided in terms of value, measured in Million.
11. Are there any specific market keywords associated with the report?
Yes, the market keyword associated with the report is "Enteral Feeding Formula Industry," which aids in identifying and referencing the specific market segment covered.
12. How do I determine which pricing option suits my needs best?
The pricing options vary based on user requirements and access needs. Individual users may opt for single-user licenses, while businesses requiring broader access may choose multi-user or enterprise licenses for cost-effective access to the report.
13. Are there any additional resources or data provided in the Enteral Feeding Formula Industry report?
While the report offers comprehensive insights, it's advisable to review the specific contents or supplementary materials provided to ascertain if additional resources or data are available.
14. How can I stay updated on further developments or reports in the Enteral Feeding Formula Industry?
To stay informed about further developments, trends, and reports in the Enteral Feeding Formula Industry, consider subscribing to industry newsletters, following relevant companies and organizations, or regularly checking reputable industry news sources and publications.
Methodology
Step 1 - Identification of Relevant Samples Size from Population Database


Step 2 - Approaches for Defining Global Market Size (Value, Volume* & Price*)

Note*: In applicable scenarios
Step 3 - Data Sources
Primary Research
- Web Analytics
- Survey Reports
- Research Institute
- Latest Research Reports
- Opinion Leaders
Secondary Research
- Annual Reports
- White Paper
- Latest Press Release
- Industry Association
- Paid Database
- Investor Presentations

Step 4 - Data Triangulation
Involves using different sources of information in order to increase the validity of a study
These sources are likely to be stakeholders in a program - participants, other researchers, program staff, other community members, and so on.
Then we put all data in single framework & apply various statistical tools to find out the dynamic on the market.
During the analysis stage, feedback from the stakeholder groups would be compared to determine areas of agreement as well as areas of divergence
