

Key Insights
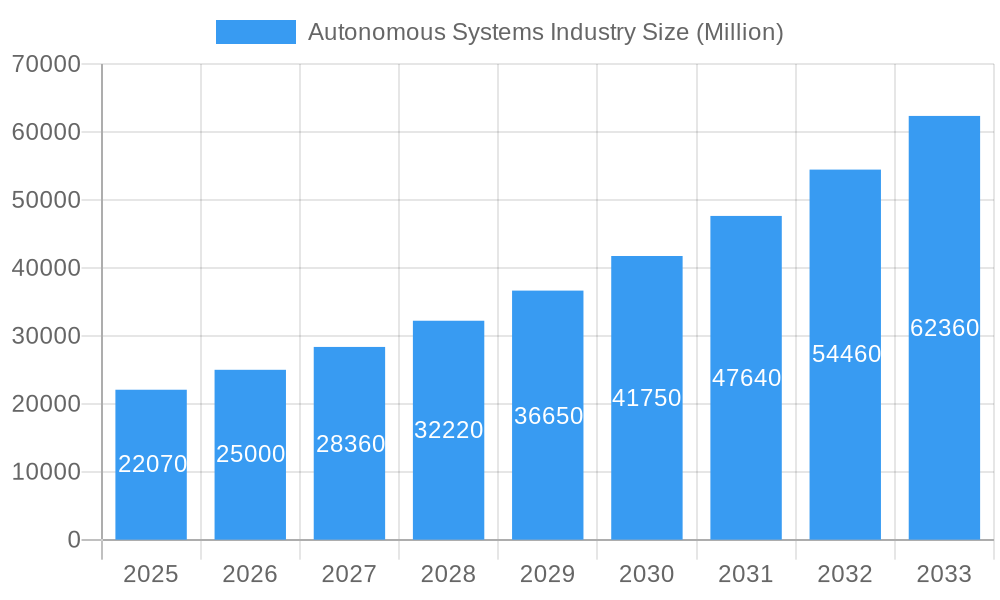
The autonomous systems industry is experiencing robust growth, projected to reach a market size of $22.07 billion in 2025 and exhibiting a Compound Annual Growth Rate (CAGR) of 13.33%. This expansion is fueled by several key drivers. Increased demand for improved efficiency and safety across various sectors, including military and law enforcement, commercial applications, and logistics, is a primary catalyst. Technological advancements in areas like artificial intelligence (AI), machine learning (ML), sensor technology, and improved communication networks are enabling the development of more sophisticated and reliable autonomous systems. Furthermore, government initiatives promoting autonomous technology adoption and significant investments in R&D are fostering innovation and market expansion.
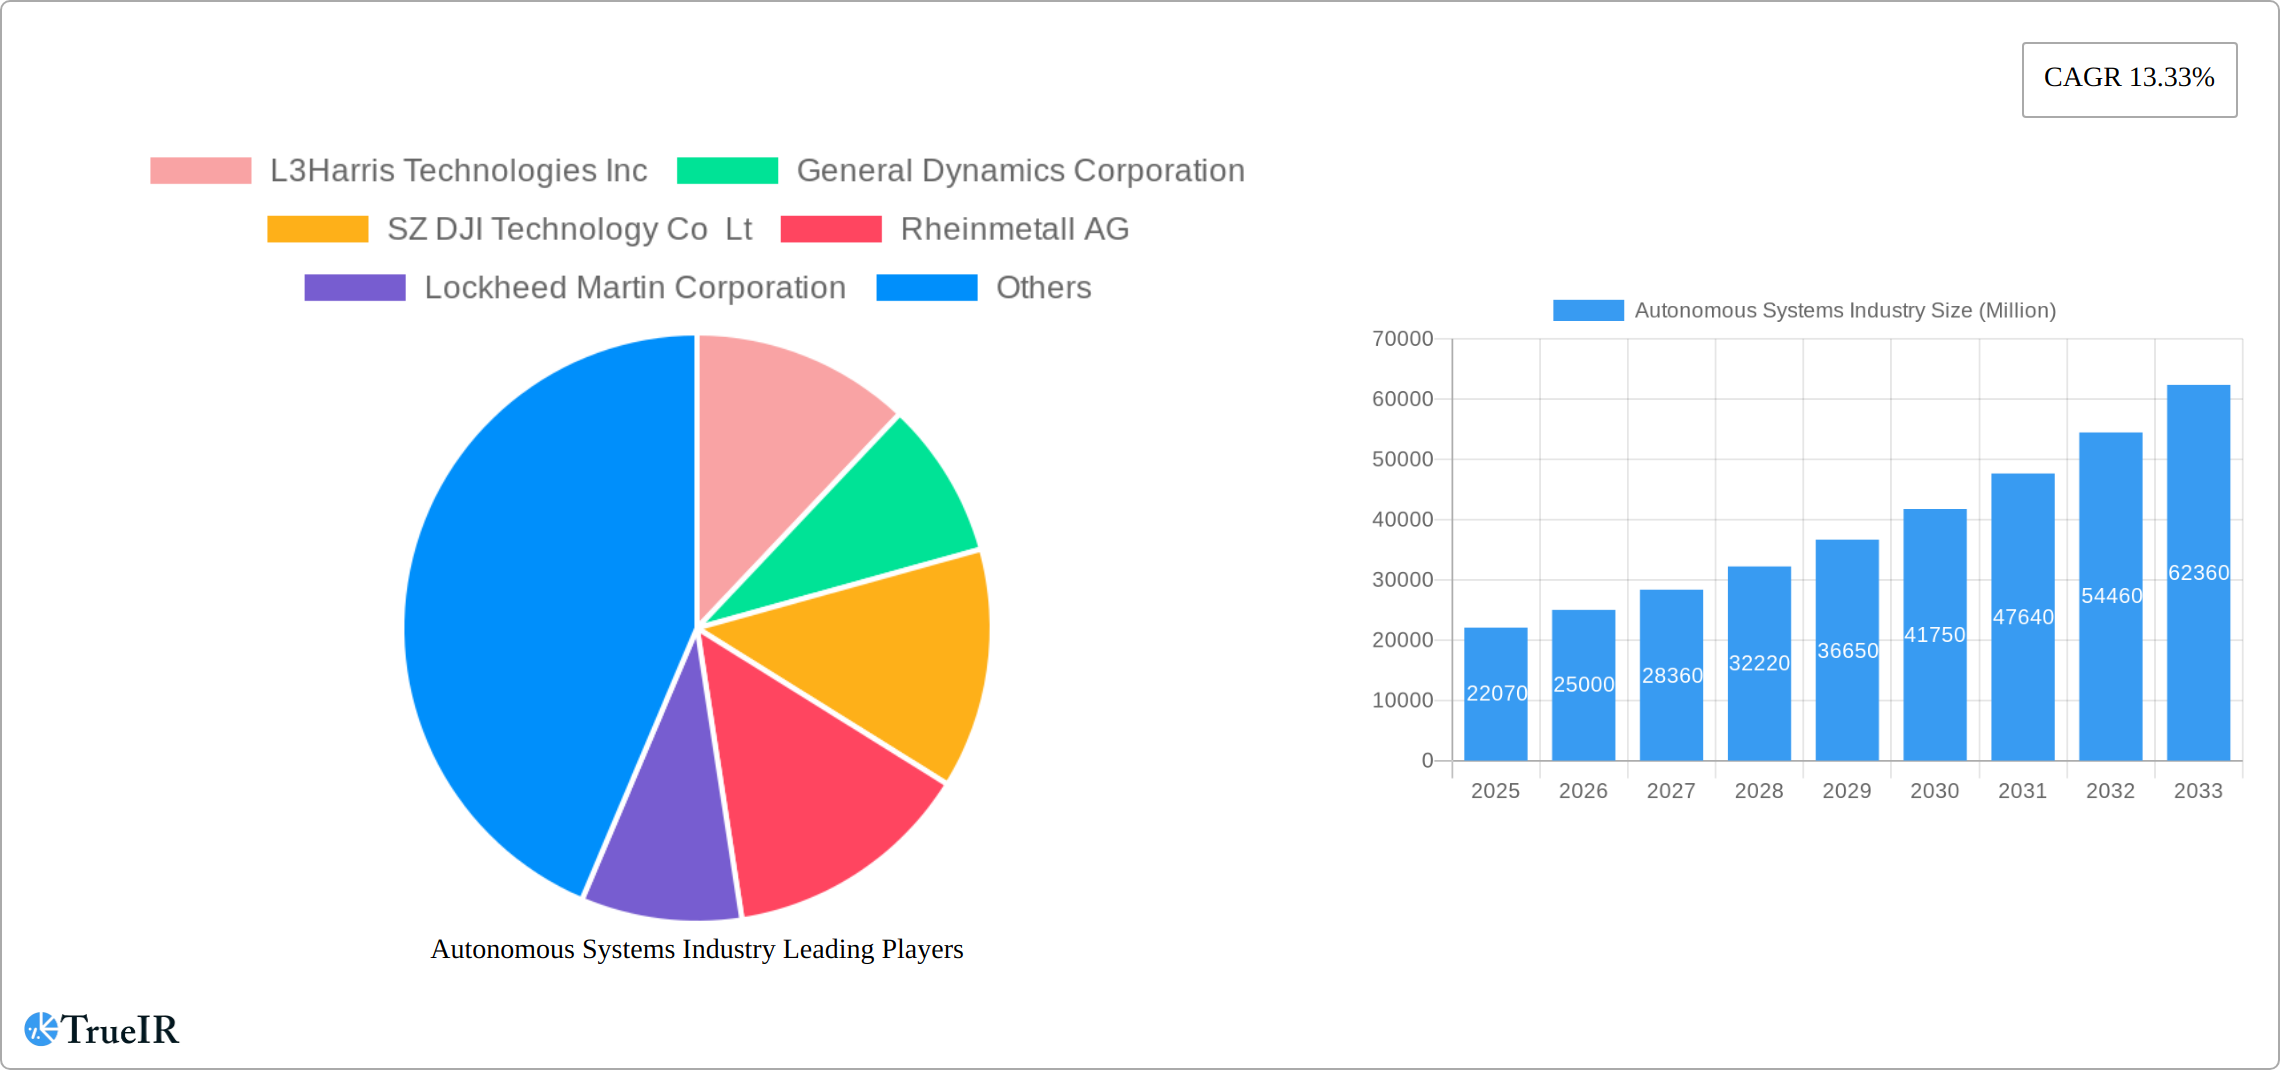
Autonomous Systems Industry Market Size (In Billion)
Market segmentation reveals strong performance across various types of autonomous systems. Unmanned aerial vehicles (UAVs), particularly large UAVs, are witnessing high demand driven by their applications in surveillance, mapping, and delivery services. Unmanned ground vehicles (UGVs) are also experiencing significant growth due to their use in hazardous environments and logistics. The hybrid category of unmanned sea systems is emerging as a promising segment, propelled by increasing interest in underwater exploration and maritime security. Geographically, North America and Europe currently hold significant market share, driven by technological advancements and early adoption. However, the Asia-Pacific region is expected to witness the fastest growth in the coming years, fueled by rising investments and a growing need for automation in diverse industries. Competition is fierce, with key players such as L3Harris Technologies, General Dynamics, DJI, and Lockheed Martin vying for market dominance through continuous innovation and strategic partnerships.
Autonomous Systems Industry Company Market Share
Autonomous Systems Industry Market Report: 2019-2033
This comprehensive report provides a detailed analysis of the Autonomous Systems industry, projecting a market value exceeding $XXX Million by 2033. The study covers the period 2019-2033, with a focus on the 2025-2033 forecast period and a base year of 2025. Key segments analyzed include Unmanned Aerial Vehicles (UAVs), Large UAVs, Unmanned Ground Vehicles (UGVs), and Unmanned Sea Systems, across Military & Law Enforcement and Commercial applications. Leading players like L3Harris Technologies Inc, General Dynamics Corporation, and DJI Technology are profiled, offering critical insights into market dynamics, competitive landscapes, and future growth trajectories.
Autonomous Systems Industry Market Structure & Competitive Landscape
The Autonomous Systems market is characterized by a moderately concentrated structure, with a few large players holding significant market share. The Herfindahl-Hirschman Index (HHI) for the industry in 2025 is estimated at xx, indicating a moderately concentrated market. Innovation is a key driver, with companies investing heavily in AI, machine learning, and sensor technologies to enhance autonomy and capabilities. Regulatory landscapes vary significantly across regions, impacting market entry and product development. The market sees ongoing M&A activity, with an estimated $xx Million in deals recorded during 2019-2024. Product substitution is a factor, with emerging technologies continually challenging established solutions. End-user segmentation is primarily driven by military and commercial applications, with the military segment exhibiting stronger growth.
- Market Concentration: Moderately concentrated, with a HHI of xx in 2025.
- Innovation Drivers: AI, machine learning, advanced sensor technologies.
- Regulatory Impact: Varies significantly by region, impacting market entry.
- Product Substitutes: Continuous emergence of newer technologies poses a challenge.
- End-User Segmentation: Military and commercial applications dominate.
- M&A Trends: Significant activity with an estimated $xx Million in deals (2019-2024).
Autonomous Systems Industry Market Trends & Opportunities
The Autonomous Systems market is experiencing robust growth, driven by increasing demand across various sectors. The market size is projected to reach $XXX Million by 2033, exhibiting a Compound Annual Growth Rate (CAGR) of xx% during the forecast period (2025-2033). Technological advancements, particularly in AI and sensor technology, are significantly impacting market dynamics. Consumer preferences are shifting towards more sophisticated and reliable autonomous systems, driving demand for advanced features and functionalities. The competitive landscape is dynamic, with established players and new entrants vying for market share. Market penetration rates vary across segments and regions, with higher penetration observed in developed economies. Specific opportunities lie in the integration of autonomous systems into various applications, such as logistics, agriculture, and infrastructure monitoring. The increasing adoption of cloud-based solutions for data management and system control is also expected to fuel market growth.
Dominant Markets & Segments in Autonomous Systems Industry
The North American region is currently the dominant market for autonomous systems, driven by significant government spending on defense and increased commercial adoption. However, the Asia-Pacific region is expected to witness substantial growth in the coming years due to rapid technological advancements and expanding industrial applications.
Key Growth Drivers by Segment:
- Unmanned Aerial Vehicles (UAVs): Demand driven by military surveillance, commercial mapping, and delivery services.
- Large UAVs: Growth propelled by increased payload capacity and extended operational range.
- Unmanned Ground Vehicles (UGVs): Demand driven by logistics, mining, and agricultural applications.
- Unmanned Sea Systems: Growth fueled by maritime surveillance, underwater exploration, and defense requirements.
- Military and Law Enforcement Application: High government spending and requirement for enhanced security capabilities.
- Commercial Application: Growing adoption across various sectors, including logistics, agriculture, and infrastructure.
Market Dominance Analysis: North America currently dominates; however, Asia-Pacific is poised for rapid growth. Key growth drivers include favorable government policies, robust infrastructure development, and increasing private sector investment.
Autonomous Systems Industry Product Analysis
The autonomous systems industry is experiencing rapid evolution, driven by breakthroughs in artificial intelligence (AI), particularly deep learning and reinforcement learning. These advancements are leading to more sophisticated algorithms for decision-making, path planning, and environmental perception. Simultaneously, sensor technology is undergoing significant improvements, with the integration of LiDAR, radar, cameras, and other sensors enabling more robust and reliable data acquisition in complex and dynamic environments. This enhanced sensing and processing power allows autonomous systems to operate with greater precision, adaptability, and safety. The development of more robust and reliable systems, capable of handling unforeseen circumstances and operating in harsh conditions (e.g., extreme temperatures, limited visibility), is another key focus. These combined advancements are not only driving wider market acceptance but also unlocking new applications across numerous sectors, including defense, logistics, agriculture, and healthcare.
Competitive differentiation within the industry is increasingly determined by factors beyond just technological prowess. Companies are focusing on delivering cost-effective solutions, emphasizing lifecycle management and minimizing total cost of ownership. Crucially, the ability to provide tailored, industry-specific solutions that address unique operational needs and challenges is proving to be a significant competitive advantage. This includes not only the hardware but also the development of user-friendly interfaces and robust support systems.
Key Drivers, Barriers & Challenges in Autonomous Systems Industry
Key Drivers:
- Technological Advancements: AI, machine learning, and sensor technology improvements.
- Increasing Demand: Across diverse sectors like military, commercial, and industrial.
- Government Support: Funding for R&D and supportive regulatory frameworks (in certain regions).
Key Challenges & Restraints:
- Regulatory Hurdles: Varying and sometimes conflicting regulations across different geographies.
- Supply Chain Disruptions: Impacting availability of critical components and increasing costs.
- Cybersecurity Threats: Vulnerability of autonomous systems to cyberattacks. Estimated annual cost of cybersecurity breaches in the industry is $xx Million.
- High Initial Investment Costs: Limiting adoption in certain sectors.
Growth Drivers in the Autonomous Systems Industry Market
Several key factors are propelling the growth of the autonomous systems market. Technological advancements, particularly in AI, machine learning, and advanced sensor technologies (e.g., high-resolution cameras, improved LiDAR systems, and miniaturized sensor fusion units), are paramount. The increasing demand for automation across various sectors, including defense, logistics, agriculture, mining, and infrastructure inspection, is another significant driver. This demand is fuelled by the need for increased efficiency, reduced operational costs, improved safety, and the ability to perform tasks in hazardous or inaccessible environments. Furthermore, substantial government investments in research and development (R&D), coupled with supportive regulatory frameworks in certain regions, are fostering innovation and market expansion. The emergence of new business models, such as autonomous-as-a-service (AaaS), is also contributing to market growth by lowering the barrier to entry for potential users.
Challenges Impacting Autonomous Systems Industry Growth
Regulatory complexity across regions creates barriers to market entry. Supply chain disruptions increase costs and limit production. Cybersecurity vulnerabilities pose a significant risk to system integrity and operational safety. High initial investment costs can restrict adoption among smaller businesses.
Key Players Shaping the Autonomous Systems Industry Market
Significant Autonomous Systems Industry Milestones
- 2020: Successful deployment of autonomous delivery drones by multiple companies.
- 2021: Introduction of advanced AI algorithms enhancing autonomous navigation capabilities.
- 2022: Significant investments in R&D by key players in autonomous underwater vehicles.
- 2023: Regulatory approvals for autonomous driving systems in certain regions.
- 2024: Several major mergers and acquisitions shaping the industry landscape.
Future Outlook for Autonomous Systems Industry Market
The future of the autonomous systems industry is exceptionally bright, with significant growth projected over the coming decade. Continued technological innovation, particularly in AI, machine learning, and sensor fusion, will remain a key driver. The expansion into new applications and market segments, driven by the increasing demand for automation and efficiency across various industries, will further fuel this growth. Strategic opportunities exist for companies that can develop specialized, robust, and cost-effective solutions tailored to specific industry requirements. A focus on enhancing cybersecurity, ensuring system safety and reliability, and addressing ethical concerns surrounding the use of autonomous systems will be crucial for long-term success. The development of standardized interfaces and protocols will also play a significant role in accelerating wider adoption and interoperability.
Autonomous Systems Industry Segmentation
- 1. Production Analysis
- 2. Consumption Analysis
- 3. Import Market Analysis (Value & Volume)
- 4. Export Market Analysis (Value & Volume)
- 5. Price Trend Analysis
Autonomous Systems Industry Segmentation By Geography
-
1. North America
- 1.1. United States
- 1.2. Canada
- 1.3. Mexico
-
2. South America
- 2.1. Brazil
- 2.2. Argentina
- 2.3. Rest of South America
-
3. Europe
- 3.1. United Kingdom
- 3.2. Germany
- 3.3. France
- 3.4. Italy
- 3.5. Spain
- 3.6. Russia
- 3.7. Benelux
- 3.8. Nordics
- 3.9. Rest of Europe
-
4. Middle East & Africa
- 4.1. Turkey
- 4.2. Israel
- 4.3. GCC
- 4.4. North Africa
- 4.5. South Africa
- 4.6. Rest of Middle East & Africa
-
5. Asia Pacific
- 5.1. China
- 5.2. India
- 5.3. Japan
- 5.4. South Korea
- 5.5. ASEAN
- 5.6. Oceania
- 5.7. Rest of Asia Pacific
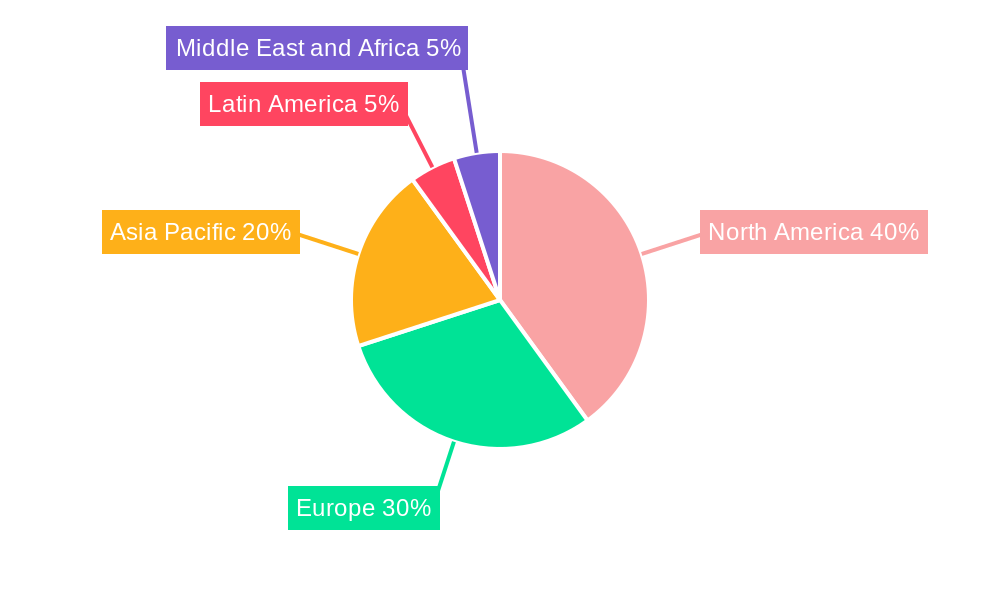
Autonomous Systems Industry Regional Market Share
Geographic Coverage of Autonomous Systems Industry
Autonomous Systems Industry REPORT HIGHLIGHTS
| Aspects | Details |
|---|---|
| Study Period | 2020-2034 |
| Base Year | 2025 |
| Estimated Year | 2026 |
| Forecast Period | 2026-2034 |
| Historical Period | 2020-2025 |
| Growth Rate | CAGR of 13.33% from 2020-2034 |
| Segmentation |
|
Table of Contents
- 1. Introduction
- 1.1. Research Scope
- 1.2. Market Segmentation
- 1.3. Research Objective
- 1.4. Definitions and Assumptions
- 2. Executive Summary
- 2.1. Market Snapshot
- 3. Market Dynamics
- 3.1. Market Drivers
- 3.2. Market Restrains
- 3.3. Market Trends
- 3.4. Market Opportunities
- 4. Market Factor Analysis
- 4.1. Porters Five Forces
- 4.1.1. Bargaining Power of Suppliers
- 4.1.2. Bargaining Power of Buyers
- 4.1.3. Threat of New Entrants
- 4.1.4. Threat of Substitutes
- 4.1.5. Competitive Rivalry
- 4.2. PESTEL analysis
- 4.3. BCG Analysis
- 4.3.1. Stars (High Growth, High Market Share)
- 4.3.2. Cash Cows (Low Growth, High Market Share)
- 4.3.3. Question Mark (High Growth, Low Market Share)
- 4.3.4. Dogs (Low Growth, Low Market Share)
- 4.4. Ansoff Matrix Analysis
- 4.5. Supply Chain Analysis
- 4.6. Regulatory Landscape
- 4.7. Current Market Potential and Opportunity Assessment (TAM–SAM–SOM Framework)
- 4.8. TIR Analyst Note
- 4.1. Porters Five Forces
- 5. Market Analysis, Insights and Forecast 2021-2033
- 5.1. Market Analysis, Insights and Forecast - by Production Analysis
- 5.2. Market Analysis, Insights and Forecast - by Consumption Analysis
- 5.3. Market Analysis, Insights and Forecast - by Import Market Analysis (Value & Volume)
- 5.4. Market Analysis, Insights and Forecast - by Export Market Analysis (Value & Volume)
- 5.5. Market Analysis, Insights and Forecast - by Price Trend Analysis
- 5.6. Market Analysis, Insights and Forecast - by Region
- 5.6.1. North America
- 5.6.2. South America
- 5.6.3. Europe
- 5.6.4. Middle East & Africa
- 5.6.5. Asia Pacific
- 6. Global Autonomous Systems Industry Analysis, Insights and Forecast, 2021-2033
- 6.1. Market Analysis, Insights and Forecast - by Production Analysis
- 6.2. Market Analysis, Insights and Forecast - by Consumption Analysis
- 6.3. Market Analysis, Insights and Forecast - by Import Market Analysis (Value & Volume)
- 6.4. Market Analysis, Insights and Forecast - by Export Market Analysis (Value & Volume)
- 6.5. Market Analysis, Insights and Forecast - by Price Trend Analysis
- 7. North America Autonomous Systems Industry Analysis, Insights and Forecast, 2020-2032
- 7.1. Market Analysis, Insights and Forecast - by Production Analysis
- 7.2. Market Analysis, Insights and Forecast - by Consumption Analysis
- 7.3. Market Analysis, Insights and Forecast - by Import Market Analysis (Value & Volume)
- 7.4. Market Analysis, Insights and Forecast - by Export Market Analysis (Value & Volume)
- 7.5. Market Analysis, Insights and Forecast - by Price Trend Analysis
- 8. South America Autonomous Systems Industry Analysis, Insights and Forecast, 2020-2032
- 8.1. Market Analysis, Insights and Forecast - by Production Analysis
- 8.2. Market Analysis, Insights and Forecast - by Consumption Analysis
- 8.3. Market Analysis, Insights and Forecast - by Import Market Analysis (Value & Volume)
- 8.4. Market Analysis, Insights and Forecast - by Export Market Analysis (Value & Volume)
- 8.5. Market Analysis, Insights and Forecast - by Price Trend Analysis
- 9. Europe Autonomous Systems Industry Analysis, Insights and Forecast, 2020-2032
- 9.1. Market Analysis, Insights and Forecast - by Production Analysis
- 9.2. Market Analysis, Insights and Forecast - by Consumption Analysis
- 9.3. Market Analysis, Insights and Forecast - by Import Market Analysis (Value & Volume)
- 9.4. Market Analysis, Insights and Forecast - by Export Market Analysis (Value & Volume)
- 9.5. Market Analysis, Insights and Forecast - by Price Trend Analysis
- 10. Middle East & Africa Autonomous Systems Industry Analysis, Insights and Forecast, 2020-2032
- 10.1. Market Analysis, Insights and Forecast - by Production Analysis
- 10.2. Market Analysis, Insights and Forecast - by Consumption Analysis
- 10.3. Market Analysis, Insights and Forecast - by Import Market Analysis (Value & Volume)
- 10.4. Market Analysis, Insights and Forecast - by Export Market Analysis (Value & Volume)
- 10.5. Market Analysis, Insights and Forecast - by Price Trend Analysis
- 11. Asia Pacific Autonomous Systems Industry Analysis, Insights and Forecast, 2020-2032
- 11.1. Market Analysis, Insights and Forecast - by Production Analysis
- 11.2. Market Analysis, Insights and Forecast - by Consumption Analysis
- 11.3. Market Analysis, Insights and Forecast - by Import Market Analysis (Value & Volume)
- 11.4. Market Analysis, Insights and Forecast - by Export Market Analysis (Value & Volume)
- 11.5. Market Analysis, Insights and Forecast - by Price Trend Analysis
- 12. Competitive Analysis
- 12.1. Company Profiles
- 12.1.1 L3Harris Technologies Inc
- 12.1.1.1. Company Overview
- 12.1.1.2. Products
- 12.1.1.3. Company Financials
- 12.1.1.4. SWOT Analysis
- 12.1.2 General Dynamics Corporation
- 12.1.2.1. Company Overview
- 12.1.2.2. Products
- 12.1.2.3. Company Financials
- 12.1.2.4. SWOT Analysis
- 12.1.3 SZ DJI Technology Co Lt
- 12.1.3.1. Company Overview
- 12.1.3.2. Products
- 12.1.3.3. Company Financials
- 12.1.3.4. SWOT Analysis
- 12.1.4 Rheinmetall AG
- 12.1.4.1. Company Overview
- 12.1.4.2. Products
- 12.1.4.3. Company Financials
- 12.1.4.4. SWOT Analysis
- 12.1.5 Lockheed Martin Corporation
- 12.1.5.1. Company Overview
- 12.1.5.2. Products
- 12.1.5.3. Company Financials
- 12.1.5.4. SWOT Analysis
- 12.1.6 Elbit Systems Ltd
- 12.1.6.1. Company Overview
- 12.1.6.2. Products
- 12.1.6.3. Company Financials
- 12.1.6.4. SWOT Analysis
- 12.1.7 ECA Group
- 12.1.7.1. Company Overview
- 12.1.7.2. Products
- 12.1.7.3. Company Financials
- 12.1.7.4. SWOT Analysis
- 12.1.8 QinetiQ Group
- 12.1.8.1. Company Overview
- 12.1.8.2. Products
- 12.1.8.3. Company Financials
- 12.1.8.4. SWOT Analysis
- 12.1.9 BAE Systems PLC
- 12.1.9.1. Company Overview
- 12.1.9.2. Products
- 12.1.9.3. Company Financials
- 12.1.9.4. SWOT Analysis
- 12.1.10 Israel Aerospace Industries Ltd
- 12.1.10.1. Company Overview
- 12.1.10.2. Products
- 12.1.10.3. Company Financials
- 12.1.10.4. SWOT Analysis
- 12.1.11 Northrop Grumman Corporation
- 12.1.11.1. Company Overview
- 12.1.11.2. Products
- 12.1.11.3. Company Financials
- 12.1.11.4. SWOT Analysis
- 12.1.12 Saab AB
- 12.1.12.1. Company Overview
- 12.1.12.2. Products
- 12.1.12.3. Company Financials
- 12.1.12.4. SWOT Analysis
- 12.1.13 The Boeing Company
- 12.1.13.1. Company Overview
- 12.1.13.2. Products
- 12.1.13.3. Company Financials
- 12.1.13.4. SWOT Analysis
- 12.1.14 Teledyne FLIR LLC
- 12.1.14.1. Company Overview
- 12.1.14.2. Products
- 12.1.14.3. Company Financials
- 12.1.14.4. SWOT Analysis
- 12.1.1 L3Harris Technologies Inc
- 12.2. Market Entropy
- 12.2.1 Company's Key Areas Served
- 12.2.2 Recent Developments
- 12.3. Company Market Share Analysis 2025
- 12.3.1 Top 5 Companies Market Share Analysis
- 12.3.2 Top 3 Companies Market Share Analysis
- 12.4. List of Potential Customers
- 13. Research Methodology
List of Figures
- Figure 1: Global Autonomous Systems Industry Revenue Breakdown (Million, %) by Region 2025 & 2033
- Figure 2: North America Autonomous Systems Industry Revenue (Million), by Production Analysis 2025 & 2033
- Figure 3: North America Autonomous Systems Industry Revenue Share (%), by Production Analysis 2025 & 2033
- Figure 4: North America Autonomous Systems Industry Revenue (Million), by Consumption Analysis 2025 & 2033
- Figure 5: North America Autonomous Systems Industry Revenue Share (%), by Consumption Analysis 2025 & 2033
- Figure 6: North America Autonomous Systems Industry Revenue (Million), by Import Market Analysis (Value & Volume) 2025 & 2033
- Figure 7: North America Autonomous Systems Industry Revenue Share (%), by Import Market Analysis (Value & Volume) 2025 & 2033
- Figure 8: North America Autonomous Systems Industry Revenue (Million), by Export Market Analysis (Value & Volume) 2025 & 2033
- Figure 9: North America Autonomous Systems Industry Revenue Share (%), by Export Market Analysis (Value & Volume) 2025 & 2033
- Figure 10: North America Autonomous Systems Industry Revenue (Million), by Price Trend Analysis 2025 & 2033
- Figure 11: North America Autonomous Systems Industry Revenue Share (%), by Price Trend Analysis 2025 & 2033
- Figure 12: North America Autonomous Systems Industry Revenue (Million), by Country 2025 & 2033
- Figure 13: North America Autonomous Systems Industry Revenue Share (%), by Country 2025 & 2033
- Figure 14: South America Autonomous Systems Industry Revenue (Million), by Production Analysis 2025 & 2033
- Figure 15: South America Autonomous Systems Industry Revenue Share (%), by Production Analysis 2025 & 2033
- Figure 16: South America Autonomous Systems Industry Revenue (Million), by Consumption Analysis 2025 & 2033
- Figure 17: South America Autonomous Systems Industry Revenue Share (%), by Consumption Analysis 2025 & 2033
- Figure 18: South America Autonomous Systems Industry Revenue (Million), by Import Market Analysis (Value & Volume) 2025 & 2033
- Figure 19: South America Autonomous Systems Industry Revenue Share (%), by Import Market Analysis (Value & Volume) 2025 & 2033
- Figure 20: South America Autonomous Systems Industry Revenue (Million), by Export Market Analysis (Value & Volume) 2025 & 2033
- Figure 21: South America Autonomous Systems Industry Revenue Share (%), by Export Market Analysis (Value & Volume) 2025 & 2033
- Figure 22: South America Autonomous Systems Industry Revenue (Million), by Price Trend Analysis 2025 & 2033
- Figure 23: South America Autonomous Systems Industry Revenue Share (%), by Price Trend Analysis 2025 & 2033
- Figure 24: South America Autonomous Systems Industry Revenue (Million), by Country 2025 & 2033
- Figure 25: South America Autonomous Systems Industry Revenue Share (%), by Country 2025 & 2033
- Figure 26: Europe Autonomous Systems Industry Revenue (Million), by Production Analysis 2025 & 2033
- Figure 27: Europe Autonomous Systems Industry Revenue Share (%), by Production Analysis 2025 & 2033
- Figure 28: Europe Autonomous Systems Industry Revenue (Million), by Consumption Analysis 2025 & 2033
- Figure 29: Europe Autonomous Systems Industry Revenue Share (%), by Consumption Analysis 2025 & 2033
- Figure 30: Europe Autonomous Systems Industry Revenue (Million), by Import Market Analysis (Value & Volume) 2025 & 2033
- Figure 31: Europe Autonomous Systems Industry Revenue Share (%), by Import Market Analysis (Value & Volume) 2025 & 2033
- Figure 32: Europe Autonomous Systems Industry Revenue (Million), by Export Market Analysis (Value & Volume) 2025 & 2033
- Figure 33: Europe Autonomous Systems Industry Revenue Share (%), by Export Market Analysis (Value & Volume) 2025 & 2033
- Figure 34: Europe Autonomous Systems Industry Revenue (Million), by Price Trend Analysis 2025 & 2033
- Figure 35: Europe Autonomous Systems Industry Revenue Share (%), by Price Trend Analysis 2025 & 2033
- Figure 36: Europe Autonomous Systems Industry Revenue (Million), by Country 2025 & 2033
- Figure 37: Europe Autonomous Systems Industry Revenue Share (%), by Country 2025 & 2033
- Figure 38: Middle East & Africa Autonomous Systems Industry Revenue (Million), by Production Analysis 2025 & 2033
- Figure 39: Middle East & Africa Autonomous Systems Industry Revenue Share (%), by Production Analysis 2025 & 2033
- Figure 40: Middle East & Africa Autonomous Systems Industry Revenue (Million), by Consumption Analysis 2025 & 2033
- Figure 41: Middle East & Africa Autonomous Systems Industry Revenue Share (%), by Consumption Analysis 2025 & 2033
- Figure 42: Middle East & Africa Autonomous Systems Industry Revenue (Million), by Import Market Analysis (Value & Volume) 2025 & 2033
- Figure 43: Middle East & Africa Autonomous Systems Industry Revenue Share (%), by Import Market Analysis (Value & Volume) 2025 & 2033
- Figure 44: Middle East & Africa Autonomous Systems Industry Revenue (Million), by Export Market Analysis (Value & Volume) 2025 & 2033
- Figure 45: Middle East & Africa Autonomous Systems Industry Revenue Share (%), by Export Market Analysis (Value & Volume) 2025 & 2033
- Figure 46: Middle East & Africa Autonomous Systems Industry Revenue (Million), by Price Trend Analysis 2025 & 2033
- Figure 47: Middle East & Africa Autonomous Systems Industry Revenue Share (%), by Price Trend Analysis 2025 & 2033
- Figure 48: Middle East & Africa Autonomous Systems Industry Revenue (Million), by Country 2025 & 2033
- Figure 49: Middle East & Africa Autonomous Systems Industry Revenue Share (%), by Country 2025 & 2033
- Figure 50: Asia Pacific Autonomous Systems Industry Revenue (Million), by Production Analysis 2025 & 2033
- Figure 51: Asia Pacific Autonomous Systems Industry Revenue Share (%), by Production Analysis 2025 & 2033
- Figure 52: Asia Pacific Autonomous Systems Industry Revenue (Million), by Consumption Analysis 2025 & 2033
- Figure 53: Asia Pacific Autonomous Systems Industry Revenue Share (%), by Consumption Analysis 2025 & 2033
- Figure 54: Asia Pacific Autonomous Systems Industry Revenue (Million), by Import Market Analysis (Value & Volume) 2025 & 2033
- Figure 55: Asia Pacific Autonomous Systems Industry Revenue Share (%), by Import Market Analysis (Value & Volume) 2025 & 2033
- Figure 56: Asia Pacific Autonomous Systems Industry Revenue (Million), by Export Market Analysis (Value & Volume) 2025 & 2033
- Figure 57: Asia Pacific Autonomous Systems Industry Revenue Share (%), by Export Market Analysis (Value & Volume) 2025 & 2033
- Figure 58: Asia Pacific Autonomous Systems Industry Revenue (Million), by Price Trend Analysis 2025 & 2033
- Figure 59: Asia Pacific Autonomous Systems Industry Revenue Share (%), by Price Trend Analysis 2025 & 2033
- Figure 60: Asia Pacific Autonomous Systems Industry Revenue (Million), by Country 2025 & 2033
- Figure 61: Asia Pacific Autonomous Systems Industry Revenue Share (%), by Country 2025 & 2033
List of Tables
- Table 1: Global Autonomous Systems Industry Revenue Million Forecast, by Production Analysis 2020 & 2033
- Table 2: Global Autonomous Systems Industry Revenue Million Forecast, by Consumption Analysis 2020 & 2033
- Table 3: Global Autonomous Systems Industry Revenue Million Forecast, by Import Market Analysis (Value & Volume) 2020 & 2033
- Table 4: Global Autonomous Systems Industry Revenue Million Forecast, by Export Market Analysis (Value & Volume) 2020 & 2033
- Table 5: Global Autonomous Systems Industry Revenue Million Forecast, by Price Trend Analysis 2020 & 2033
- Table 6: Global Autonomous Systems Industry Revenue Million Forecast, by Region 2020 & 2033
- Table 7: Global Autonomous Systems Industry Revenue Million Forecast, by Production Analysis 2020 & 2033
- Table 8: Global Autonomous Systems Industry Revenue Million Forecast, by Consumption Analysis 2020 & 2033
- Table 9: Global Autonomous Systems Industry Revenue Million Forecast, by Import Market Analysis (Value & Volume) 2020 & 2033
- Table 10: Global Autonomous Systems Industry Revenue Million Forecast, by Export Market Analysis (Value & Volume) 2020 & 2033
- Table 11: Global Autonomous Systems Industry Revenue Million Forecast, by Price Trend Analysis 2020 & 2033
- Table 12: Global Autonomous Systems Industry Revenue Million Forecast, by Country 2020 & 2033
- Table 13: United States Autonomous Systems Industry Revenue (Million) Forecast, by Application 2020 & 2033
- Table 14: Canada Autonomous Systems Industry Revenue (Million) Forecast, by Application 2020 & 2033
- Table 15: Mexico Autonomous Systems Industry Revenue (Million) Forecast, by Application 2020 & 2033
- Table 16: Global Autonomous Systems Industry Revenue Million Forecast, by Production Analysis 2020 & 2033
- Table 17: Global Autonomous Systems Industry Revenue Million Forecast, by Consumption Analysis 2020 & 2033
- Table 18: Global Autonomous Systems Industry Revenue Million Forecast, by Import Market Analysis (Value & Volume) 2020 & 2033
- Table 19: Global Autonomous Systems Industry Revenue Million Forecast, by Export Market Analysis (Value & Volume) 2020 & 2033
- Table 20: Global Autonomous Systems Industry Revenue Million Forecast, by Price Trend Analysis 2020 & 2033
- Table 21: Global Autonomous Systems Industry Revenue Million Forecast, by Country 2020 & 2033
- Table 22: Brazil Autonomous Systems Industry Revenue (Million) Forecast, by Application 2020 & 2033
- Table 23: Argentina Autonomous Systems Industry Revenue (Million) Forecast, by Application 2020 & 2033
- Table 24: Rest of South America Autonomous Systems Industry Revenue (Million) Forecast, by Application 2020 & 2033
- Table 25: Global Autonomous Systems Industry Revenue Million Forecast, by Production Analysis 2020 & 2033
- Table 26: Global Autonomous Systems Industry Revenue Million Forecast, by Consumption Analysis 2020 & 2033
- Table 27: Global Autonomous Systems Industry Revenue Million Forecast, by Import Market Analysis (Value & Volume) 2020 & 2033
- Table 28: Global Autonomous Systems Industry Revenue Million Forecast, by Export Market Analysis (Value & Volume) 2020 & 2033
- Table 29: Global Autonomous Systems Industry Revenue Million Forecast, by Price Trend Analysis 2020 & 2033
- Table 30: Global Autonomous Systems Industry Revenue Million Forecast, by Country 2020 & 2033
- Table 31: United Kingdom Autonomous Systems Industry Revenue (Million) Forecast, by Application 2020 & 2033
- Table 32: Germany Autonomous Systems Industry Revenue (Million) Forecast, by Application 2020 & 2033
- Table 33: France Autonomous Systems Industry Revenue (Million) Forecast, by Application 2020 & 2033
- Table 34: Italy Autonomous Systems Industry Revenue (Million) Forecast, by Application 2020 & 2033
- Table 35: Spain Autonomous Systems Industry Revenue (Million) Forecast, by Application 2020 & 2033
- Table 36: Russia Autonomous Systems Industry Revenue (Million) Forecast, by Application 2020 & 2033
- Table 37: Benelux Autonomous Systems Industry Revenue (Million) Forecast, by Application 2020 & 2033
- Table 38: Nordics Autonomous Systems Industry Revenue (Million) Forecast, by Application 2020 & 2033
- Table 39: Rest of Europe Autonomous Systems Industry Revenue (Million) Forecast, by Application 2020 & 2033
- Table 40: Global Autonomous Systems Industry Revenue Million Forecast, by Production Analysis 2020 & 2033
- Table 41: Global Autonomous Systems Industry Revenue Million Forecast, by Consumption Analysis 2020 & 2033
- Table 42: Global Autonomous Systems Industry Revenue Million Forecast, by Import Market Analysis (Value & Volume) 2020 & 2033
- Table 43: Global Autonomous Systems Industry Revenue Million Forecast, by Export Market Analysis (Value & Volume) 2020 & 2033
- Table 44: Global Autonomous Systems Industry Revenue Million Forecast, by Price Trend Analysis 2020 & 2033
- Table 45: Global Autonomous Systems Industry Revenue Million Forecast, by Country 2020 & 2033
- Table 46: Turkey Autonomous Systems Industry Revenue (Million) Forecast, by Application 2020 & 2033
- Table 47: Israel Autonomous Systems Industry Revenue (Million) Forecast, by Application 2020 & 2033
- Table 48: GCC Autonomous Systems Industry Revenue (Million) Forecast, by Application 2020 & 2033
- Table 49: North Africa Autonomous Systems Industry Revenue (Million) Forecast, by Application 2020 & 2033
- Table 50: South Africa Autonomous Systems Industry Revenue (Million) Forecast, by Application 2020 & 2033
- Table 51: Rest of Middle East & Africa Autonomous Systems Industry Revenue (Million) Forecast, by Application 2020 & 2033
- Table 52: Global Autonomous Systems Industry Revenue Million Forecast, by Production Analysis 2020 & 2033
- Table 53: Global Autonomous Systems Industry Revenue Million Forecast, by Consumption Analysis 2020 & 2033
- Table 54: Global Autonomous Systems Industry Revenue Million Forecast, by Import Market Analysis (Value & Volume) 2020 & 2033
- Table 55: Global Autonomous Systems Industry Revenue Million Forecast, by Export Market Analysis (Value & Volume) 2020 & 2033
- Table 56: Global Autonomous Systems Industry Revenue Million Forecast, by Price Trend Analysis 2020 & 2033
- Table 57: Global Autonomous Systems Industry Revenue Million Forecast, by Country 2020 & 2033
- Table 58: China Autonomous Systems Industry Revenue (Million) Forecast, by Application 2020 & 2033
- Table 59: India Autonomous Systems Industry Revenue (Million) Forecast, by Application 2020 & 2033
- Table 60: Japan Autonomous Systems Industry Revenue (Million) Forecast, by Application 2020 & 2033
- Table 61: South Korea Autonomous Systems Industry Revenue (Million) Forecast, by Application 2020 & 2033
- Table 62: ASEAN Autonomous Systems Industry Revenue (Million) Forecast, by Application 2020 & 2033
- Table 63: Oceania Autonomous Systems Industry Revenue (Million) Forecast, by Application 2020 & 2033
- Table 64: Rest of Asia Pacific Autonomous Systems Industry Revenue (Million) Forecast, by Application 2020 & 2033
Frequently Asked Questions
1. What is the projected Compound Annual Growth Rate (CAGR) of the Autonomous Systems Industry?
The projected CAGR is approximately 13.33%.
2. Which companies are prominent players in the Autonomous Systems Industry?
Key companies in the market include L3Harris Technologies Inc, General Dynamics Corporation, SZ DJI Technology Co Lt, Rheinmetall AG, Lockheed Martin Corporation, Elbit Systems Ltd, ECA Group, QinetiQ Group, BAE Systems PLC, Israel Aerospace Industries Ltd, Northrop Grumman Corporation, Saab AB, The Boeing Company, Teledyne FLIR LLC.
3. What are the main segments of the Autonomous Systems Industry?
The market segments include Production Analysis, Consumption Analysis, Import Market Analysis (Value & Volume), Export Market Analysis (Value & Volume), Price Trend Analysis.
4. Can you provide details about the market size?
The market size is estimated to be USD 22.07 Million as of 2022.
5. What are some drivers contributing to market growth?
; Increasing Number Of Air Passengers; Use Of Portable Electronic Devices.
6. What are the notable trends driving market growth?
The Unmanned Aerial Vehicles Segment to Witness the Highest Growth During the Forecast Period.
7. Are there any restraints impacting market growth?
; High Cost Of Connectivity Equipments.
8. Can you provide examples of recent developments in the market?
N/A
9. What pricing options are available for accessing the report?
Pricing options include single-user, multi-user, and enterprise licenses priced at USD 4750, USD 5250, and USD 8750 respectively.
10. Is the market size provided in terms of value or volume?
The market size is provided in terms of value, measured in Million.
11. Are there any specific market keywords associated with the report?
Yes, the market keyword associated with the report is "Autonomous Systems Industry," which aids in identifying and referencing the specific market segment covered.
12. How do I determine which pricing option suits my needs best?
The pricing options vary based on user requirements and access needs. Individual users may opt for single-user licenses, while businesses requiring broader access may choose multi-user or enterprise licenses for cost-effective access to the report.
13. Are there any additional resources or data provided in the Autonomous Systems Industry report?
While the report offers comprehensive insights, it's advisable to review the specific contents or supplementary materials provided to ascertain if additional resources or data are available.
14. How can I stay updated on further developments or reports in the Autonomous Systems Industry?
To stay informed about further developments, trends, and reports in the Autonomous Systems Industry, consider subscribing to industry newsletters, following relevant companies and organizations, or regularly checking reputable industry news sources and publications.
Methodology
Step 1 - Identification of Relevant Samples Size from Population Database


Step 2 - Approaches for Defining Global Market Size (Value, Volume* & Price*)

Note*: In applicable scenarios
Step 3 - Data Sources
Primary Research
- Web Analytics
- Survey Reports
- Research Institute
- Latest Research Reports
- Opinion Leaders
Secondary Research
- Annual Reports
- White Paper
- Latest Press Release
- Industry Association
- Paid Database
- Investor Presentations

Step 4 - Data Triangulation
Involves using different sources of information in order to increase the validity of a study
These sources are likely to be stakeholders in a program - participants, other researchers, program staff, other community members, and so on.
Then we put all data in single framework & apply various statistical tools to find out the dynamic on the market.
During the analysis stage, feedback from the stakeholder groups would be compared to determine areas of agreement as well as areas of divergence