

Key Insights
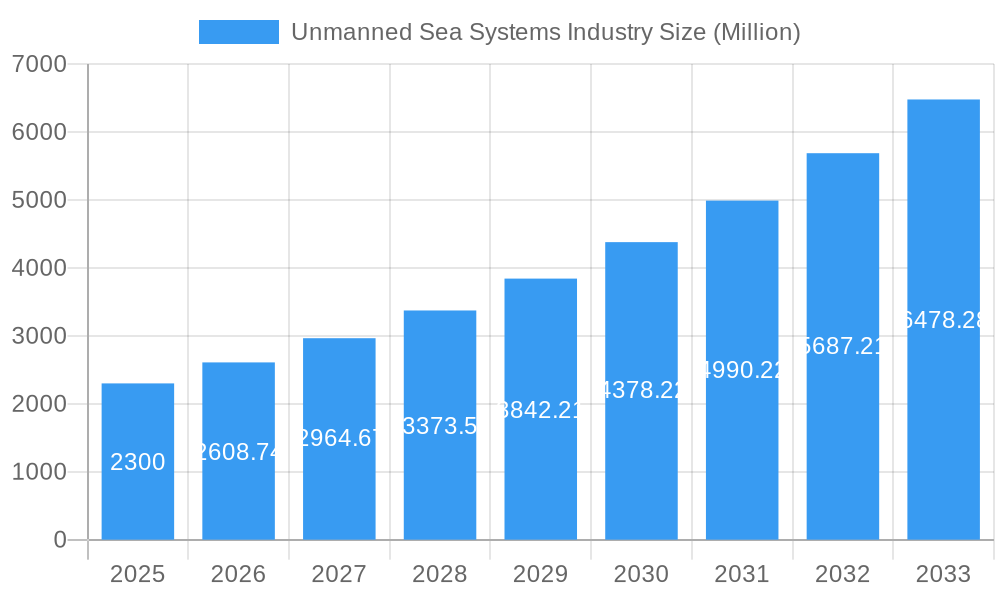
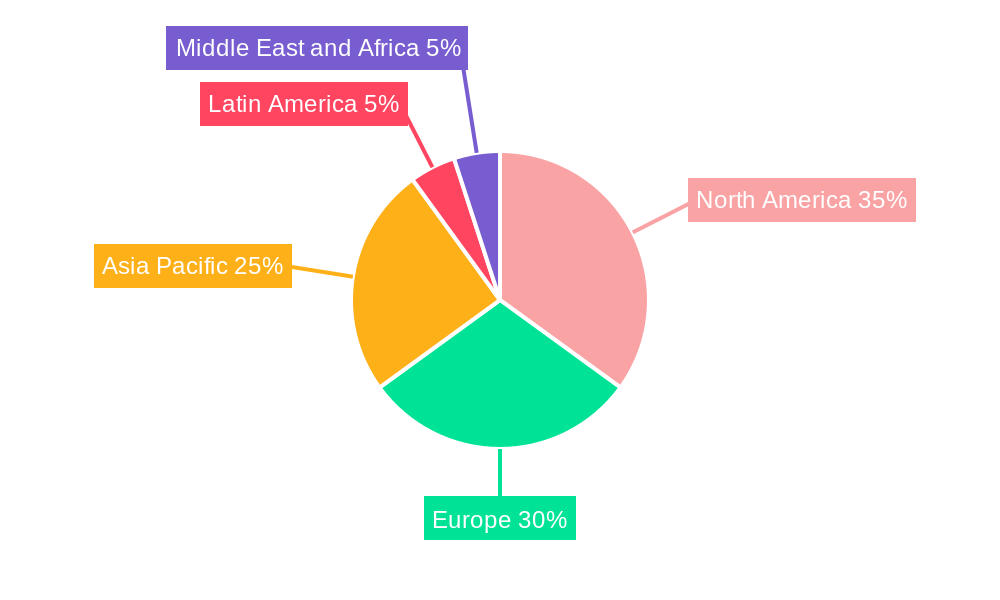
The Unmanned Sea Systems (USS) industry is experiencing robust growth, projected to reach a market size of $2.3 billion in 2025 and maintain a Compound Annual Growth Rate (CAGR) of 13.78% from 2025 to 2033. This expansion is driven by several key factors. Firstly, increasing military spending globally fuels demand for autonomous underwater and surface vehicles (UUVs and USVs) for surveillance, mine countermeasures, and anti-submarine warfare. Secondly, the commercial sector is adopting USS technology for diverse applications, including offshore oil and gas exploration, underwater infrastructure inspection, and oceanographic research. The rising need for efficient and cost-effective solutions for maritime operations further boosts market growth. Technological advancements in autonomy, sensor technology, and communication systems are also significant drivers, enabling the development of more sophisticated and capable USS. The market is segmented by vehicle type (UUVs and USVs), capability (Remotely Operated Vehicles (ROVs) and Autonomous Underwater Vehicles (AUVs)), and application (military, commercial, and other). While data limitations prevent precise regional breakdown, North America and Europe are expected to hold significant market share due to robust defense budgets and technological advancements within these regions. However, the Asia-Pacific region is projected to witness substantial growth in the coming years driven by increasing maritime activities and investments in defense modernization.
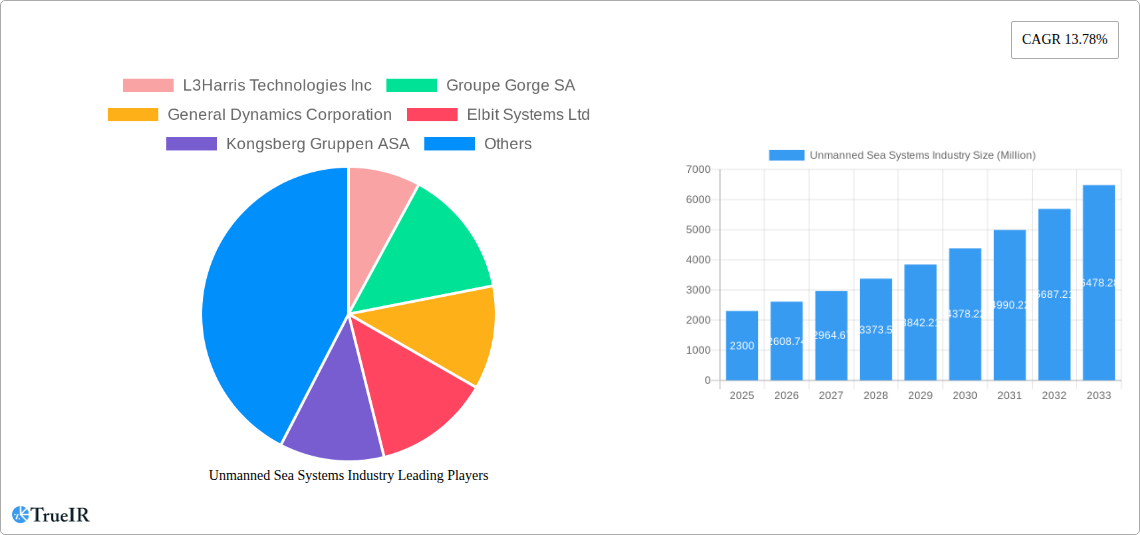
Unmanned Sea Systems Industry Market Size (In Billion)
Challenges remain, including the high initial investment costs associated with USS development and deployment, along with concerns regarding cybersecurity and data security. Furthermore, regulatory frameworks governing the operation of autonomous systems in maritime environments are still evolving, potentially hindering market penetration. Nevertheless, the long-term outlook for the USS industry remains positive, as ongoing technological improvements, increased operational efficiency, and the expanding application scope are poised to offset these challenges and fuel continued market expansion. Key players like L3Harris Technologies Inc, General Dynamics Corporation, and Kongsberg Gruppen ASA are leading the technological innovation and market penetration within this rapidly growing sector.
Unmanned Sea Systems Industry Company Market Share
Unmanned Sea Systems Industry Market Report: 2019-2033
Dive deep into the dynamic world of Unmanned Sea Systems with this comprehensive market report, offering an in-depth analysis of market trends, competitive landscape, and future projections from 2019-2033. This report is your essential guide to navigating the complexities of this rapidly evolving sector, providing critical insights for strategic decision-making. The study period covers 2019-2033, with the base year at 2025 and a forecast period spanning 2025-2033, using 2019-2024 as the historical period. The market is expected to reach xx Million USD by 2033.
Unmanned Sea Systems Industry Market Structure & Competitive Landscape
The Unmanned Sea Systems (USS) industry is characterized by a moderately concentrated market structure, featuring several prominent players that command significant market share. While specific figures may vary, the Herfindahl-Hirschman Index (HHI) is estimated to be in a range indicating moderate consolidation. The primary catalysts for innovation within this sector are continuous advancements in autonomy, sophisticated sensor technology, and the increasing integration of artificial intelligence (AI). These technological leaps are directly contributing to enhanced operational capabilities, greater data acquisition precision, and a reduction in overall operational expenses. Furthermore, the evolving landscape of regulatory frameworks, particularly those pertaining to maritime safety, navigation, and data security, exert a substantial influence on market dynamics and strategic decision-making. Traditional manned vessels are facing increasing competition from USS due to their superior cost-effectiveness and unique operational advantages. The end-user segmentation of the USS market is broadly categorized into military applications, commercial operations, and a range of other specialized applications.
- Market Concentration: The market exhibits moderate concentration, with key players holding substantial shares. (HHI estimated at xx).
- Key Innovation Drivers: Significant advancements in Artificial Intelligence (AI), sophisticated autonomous navigation systems, and cutting-edge sensor technologies are propelling innovation.
- Regulatory Impacts: Stringent regulations concerning maritime safety, operational protocols, and robust data security measures are actively shaping market development.
- Product Substitutes: Traditional manned maritime vessels are increasingly being supplanted by the efficiency and economic benefits of USS.
- End-User Segmentation: The primary end-user segments include the Military, Commercial enterprises, and a diverse array of Other Applications.
- Mergers & Acquisitions (M&A) Trends: The period between 2019 and 2024 has witnessed a notable volume of M&A activity, with an estimated total deal value of approximately xx Million USD. This trend underscores ongoing sector consolidation, heightened competition, and strategic expansion efforts by industry participants.
Unmanned Sea Systems Industry Market Trends & Opportunities
The Unmanned Sea Systems (USS) market is poised for substantial expansion, driven by escalating demand from both the defense and commercial maritime sectors. Projections indicate a robust Compound Annual Growth Rate (CAGR) of approximately xx% for the forecast period of 2025-2033, with the market size anticipated to reach an estimated xx Million USD by 2033. This impressive growth trajectory is underpinned by several pivotal trends: the widespread adoption of autonomous vehicles for optimizing operational efficiency; the seamless integration of advanced sensor technologies to enhance situational awareness and refine data collection methodologies; significant and ongoing investments in Research & Development (R&D) aimed at pioneering next-generation USS platforms; and proactive government initiatives that actively promote the deployment and utilization of unmanned systems across a spectrum of applications. Current market penetration is estimated at xx%, with expectations of significant upward movement throughout the forecast horizon. The burgeoning demand for more efficient and economically viable maritime operations, particularly in critical areas such as surveillance, infrastructure inspection, environmental monitoring, and scientific research, presents a wealth of lucrative opportunities for market stakeholders. The competitive landscape is dynamically evolving, with a pronounced emphasis on fostering innovation, forging strategic alliances, and developing specialized solutions for niche market segments.
Dominant Markets & Segments in Unmanned Sea Systems Industry
The North American market holds a dominant position in the global Unmanned Sea Systems industry, driven by substantial government investment in military and defense applications. The leading segments include:
Type: Unmanned Underwater Vehicles (UUVs) and Unmanned Surface Vehicles (USVs) are both experiencing strong growth, with UUVs witnessing slightly higher demand due to their ability to operate in challenging environments.
Capability: Autonomous Vehicles are gaining traction over Remotely Operated Vehicles (ROVs) due to their enhanced operational independence.
Application: The military sector currently holds the largest market share, followed by commercial applications such as offshore oil & gas, maritime surveillance, and underwater inspection. Other applications, including scientific research and environmental monitoring, are also showing increasing potential.
Key Growth Drivers:
- Military applications: Increased defense budgets and the need for enhanced maritime security.
- Commercial applications: Growing demand for cost-effective solutions in offshore operations.
- Technological advancements: Improvements in autonomy, sensor technology, and AI.
- Government regulations: Initiatives promoting the adoption of unmanned systems.
Unmanned Sea Systems Industry Product Analysis
Product innovation in the Unmanned Sea Systems industry focuses on enhancing autonomy, improving payload capacity, increasing operational range, and integrating advanced sensor technologies. The competitive advantage lies in developing highly adaptable and versatile systems that can cater to diverse applications. Miniaturization, improved power efficiency, and robust designs are crucial factors contributing to market success. The increasing integration of AI and machine learning promises to further revolutionize the capabilities of these systems.
Key Drivers, Barriers & Challenges in Unmanned Sea Systems Industry
Key Drivers: The primary impetus for growth in the USS industry stems from rapid technological advancements in autonomy, AI, and sophisticated sensor technologies. Escalating global defense budgets and a heightened focus on maritime security solutions are further accelerating market expansion. Additionally, supportive government initiatives and favorable policy frameworks are actively encouraging the widespread adoption and development of unmanned systems.
Key Challenges & Restraints: Navigating complex and evolving regulatory hurdles, particularly concerning operations in international waters, presents a significant challenge. Disruptions within the supply chain, especially concerning the sourcing of specialized components and efficient manufacturing processes, can impede production timelines and overall market growth. Intense competition from established industry giants and the emergence of agile new entrants contribute to significant market pressure. The substantial initial investment costs associated with the research, development, and deployment of these advanced systems, particularly for autonomous underwater vehicles (AUVs), can act as a considerable barrier to broader market penetration.
Growth Drivers in the Unmanned Sea Systems Industry Market
The Unmanned Sea Systems market is experiencing robust growth, significantly propelled by increasing global defense expenditures, with a particular emphasis on enhancing maritime security capabilities. Technological breakthroughs in autonomous navigation and artificial intelligence are instrumental in expanding the operational scope and effectiveness of these systems, thereby unlocking new application frontiers. Furthermore, the implementation of supportive government policies and evolving regulatory landscapes are actively fostering innovation and encouraging the broader deployment of unmanned sea systems across various sectors.
Challenges Impacting Unmanned Sea Systems Industry Growth
High upfront investment costs and the inherent complexity in integrating cutting-edge technologies can present significant obstacles to market expansion. Navigating intricate regulatory frameworks and stringent compliance requirements, especially those aligned with international maritime laws, can create substantial barriers to entry for new and existing players. Moreover, inherent vulnerabilities within the global supply chain and a dependency on highly specialized components can pose considerable logistical and operational challenges, potentially impacting production and deployment timelines.
Key Players Shaping the Unmanned Sea Systems Industry Market
Significant Unmanned Sea Systems Industry Industry Milestones
- October 2023: The Naval Sea Systems Command awarded Lockheed Martin Corporation an USD 11 Million contract for engineering support of an Extra Large Unmanned Undersea Vehicle (UUV), scheduled for completion by September 2024.
- September 2023: HII received a USD 19 Million contract (with a ceiling of USD 347 Million) from the US Navy to deliver REMUS 300 UUVs, with ongoing deliveries through 2028.
Future Outlook for Unmanned Sea Systems Industry Market
The future of the Unmanned Sea Systems market appears bright, with continued growth driven by technological advancements, increasing defense budgets, and a growing demand for cost-effective maritime solutions. Strategic partnerships and collaborations among key players will further accelerate innovation and market penetration. The integration of AI and machine learning will unlock new capabilities and applications, expanding the market's potential. This market segment is poised for significant expansion in the coming years, offering substantial opportunities for businesses involved in developing and deploying unmanned maritime systems.
Unmanned Sea Systems Industry Segmentation
- 1. Production Analysis
- 2. Consumption Analysis
- 3. Import Market Analysis (Value & Volume)
- 4. Export Market Analysis (Value & Volume)
- 5. Price Trend Analysis
Unmanned Sea Systems Industry Segmentation By Geography
-
1. North America
- 1.1. United States
- 1.2. Canada
- 1.3. Mexico
-
2. South America
- 2.1. Brazil
- 2.2. Argentina
- 2.3. Rest of South America
-
3. Europe
- 3.1. United Kingdom
- 3.2. Germany
- 3.3. France
- 3.4. Italy
- 3.5. Spain
- 3.6. Russia
- 3.7. Benelux
- 3.8. Nordics
- 3.9. Rest of Europe
-
4. Middle East & Africa
- 4.1. Turkey
- 4.2. Israel
- 4.3. GCC
- 4.4. North Africa
- 4.5. South Africa
- 4.6. Rest of Middle East & Africa
-
5. Asia Pacific
- 5.1. China
- 5.2. India
- 5.3. Japan
- 5.4. South Korea
- 5.5. ASEAN
- 5.6. Oceania
- 5.7. Rest of Asia Pacific
Unmanned Sea Systems Industry Regional Market Share
Geographic Coverage of Unmanned Sea Systems Industry
Unmanned Sea Systems Industry REPORT HIGHLIGHTS
| Aspects | Details |
|---|---|
| Study Period | 2020-2034 |
| Base Year | 2025 |
| Estimated Year | 2026 |
| Forecast Period | 2026-2034 |
| Historical Period | 2020-2025 |
| Growth Rate | CAGR of 13.78% from 2020-2034 |
| Segmentation |
|
Table of Contents
- 1. Introduction
- 1.1. Research Scope
- 1.2. Market Segmentation
- 1.3. Research Objective
- 1.4. Definitions and Assumptions
- 2. Executive Summary
- 2.1. Market Snapshot
- 3. Market Dynamics
- 3.1. Market Drivers
- 3.2. Market Restrains
- 3.3. Market Trends
- 3.4. Market Opportunities
- 4. Market Factor Analysis
- 4.1. Porters Five Forces
- 4.1.1. Bargaining Power of Suppliers
- 4.1.2. Bargaining Power of Buyers
- 4.1.3. Threat of New Entrants
- 4.1.4. Threat of Substitutes
- 4.1.5. Competitive Rivalry
- 4.2. PESTEL analysis
- 4.3. BCG Analysis
- 4.3.1. Stars (High Growth, High Market Share)
- 4.3.2. Cash Cows (Low Growth, High Market Share)
- 4.3.3. Question Mark (High Growth, Low Market Share)
- 4.3.4. Dogs (Low Growth, Low Market Share)
- 4.4. Ansoff Matrix Analysis
- 4.5. Supply Chain Analysis
- 4.6. Regulatory Landscape
- 4.7. Current Market Potential and Opportunity Assessment (TAM–SAM–SOM Framework)
- 4.8. TIR Analyst Note
- 4.1. Porters Five Forces
- 5. Market Analysis, Insights and Forecast 2021-2033
- 5.1. Market Analysis, Insights and Forecast - by Production Analysis
- 5.2. Market Analysis, Insights and Forecast - by Consumption Analysis
- 5.3. Market Analysis, Insights and Forecast - by Import Market Analysis (Value & Volume)
- 5.4. Market Analysis, Insights and Forecast - by Export Market Analysis (Value & Volume)
- 5.5. Market Analysis, Insights and Forecast - by Price Trend Analysis
- 5.6. Market Analysis, Insights and Forecast - by Region
- 5.6.1. North America
- 5.6.2. South America
- 5.6.3. Europe
- 5.6.4. Middle East & Africa
- 5.6.5. Asia Pacific
- 6. Global Unmanned Sea Systems Industry Analysis, Insights and Forecast, 2021-2033
- 6.1. Market Analysis, Insights and Forecast - by Production Analysis
- 6.2. Market Analysis, Insights and Forecast - by Consumption Analysis
- 6.3. Market Analysis, Insights and Forecast - by Import Market Analysis (Value & Volume)
- 6.4. Market Analysis, Insights and Forecast - by Export Market Analysis (Value & Volume)
- 6.5. Market Analysis, Insights and Forecast - by Price Trend Analysis
- 7. North America Unmanned Sea Systems Industry Analysis, Insights and Forecast, 2020-2032
- 7.1. Market Analysis, Insights and Forecast - by Production Analysis
- 7.2. Market Analysis, Insights and Forecast - by Consumption Analysis
- 7.3. Market Analysis, Insights and Forecast - by Import Market Analysis (Value & Volume)
- 7.4. Market Analysis, Insights and Forecast - by Export Market Analysis (Value & Volume)
- 7.5. Market Analysis, Insights and Forecast - by Price Trend Analysis
- 8. South America Unmanned Sea Systems Industry Analysis, Insights and Forecast, 2020-2032
- 8.1. Market Analysis, Insights and Forecast - by Production Analysis
- 8.2. Market Analysis, Insights and Forecast - by Consumption Analysis
- 8.3. Market Analysis, Insights and Forecast - by Import Market Analysis (Value & Volume)
- 8.4. Market Analysis, Insights and Forecast - by Export Market Analysis (Value & Volume)
- 8.5. Market Analysis, Insights and Forecast - by Price Trend Analysis
- 9. Europe Unmanned Sea Systems Industry Analysis, Insights and Forecast, 2020-2032
- 9.1. Market Analysis, Insights and Forecast - by Production Analysis
- 9.2. Market Analysis, Insights and Forecast - by Consumption Analysis
- 9.3. Market Analysis, Insights and Forecast - by Import Market Analysis (Value & Volume)
- 9.4. Market Analysis, Insights and Forecast - by Export Market Analysis (Value & Volume)
- 9.5. Market Analysis, Insights and Forecast - by Price Trend Analysis
- 10. Middle East & Africa Unmanned Sea Systems Industry Analysis, Insights and Forecast, 2020-2032
- 10.1. Market Analysis, Insights and Forecast - by Production Analysis
- 10.2. Market Analysis, Insights and Forecast - by Consumption Analysis
- 10.3. Market Analysis, Insights and Forecast - by Import Market Analysis (Value & Volume)
- 10.4. Market Analysis, Insights and Forecast - by Export Market Analysis (Value & Volume)
- 10.5. Market Analysis, Insights and Forecast - by Price Trend Analysis
- 11. Asia Pacific Unmanned Sea Systems Industry Analysis, Insights and Forecast, 2020-2032
- 11.1. Market Analysis, Insights and Forecast - by Production Analysis
- 11.2. Market Analysis, Insights and Forecast - by Consumption Analysis
- 11.3. Market Analysis, Insights and Forecast - by Import Market Analysis (Value & Volume)
- 11.4. Market Analysis, Insights and Forecast - by Export Market Analysis (Value & Volume)
- 11.5. Market Analysis, Insights and Forecast - by Price Trend Analysis
- 12. Competitive Analysis
- 12.1. Company Profiles
- 12.1.1 L3Harris Technologies Inc
- 12.1.1.1. Company Overview
- 12.1.1.2. Products
- 12.1.1.3. Company Financials
- 12.1.1.4. SWOT Analysis
- 12.1.2 Groupe Gorge SA
- 12.1.2.1. Company Overview
- 12.1.2.2. Products
- 12.1.2.3. Company Financials
- 12.1.2.4. SWOT Analysis
- 12.1.3 General Dynamics Corporation
- 12.1.3.1. Company Overview
- 12.1.3.2. Products
- 12.1.3.3. Company Financials
- 12.1.3.4. SWOT Analysis
- 12.1.4 Elbit Systems Ltd
- 12.1.4.1. Company Overview
- 12.1.4.2. Products
- 12.1.4.3. Company Financials
- 12.1.4.4. SWOT Analysis
- 12.1.5 Kongsberg Gruppen ASA
- 12.1.5.1. Company Overview
- 12.1.5.2. Products
- 12.1.5.3. Company Financials
- 12.1.5.4. SWOT Analysis
- 12.1.6 Lockheed Martin Corporation
- 12.1.6.1. Company Overview
- 12.1.6.2. Products
- 12.1.6.3. Company Financials
- 12.1.6.4. SWOT Analysis
- 12.1.7 Maritime Robotics AS
- 12.1.7.1. Company Overview
- 12.1.7.2. Products
- 12.1.7.3. Company Financials
- 12.1.7.4. SWOT Analysis
- 12.1.8 Teledyne Technologies Incorporated
- 12.1.8.1. Company Overview
- 12.1.8.2. Products
- 12.1.8.3. Company Financials
- 12.1.8.4. SWOT Analysis
- 12.1.9 thyssenkrupp AG
- 12.1.9.1. Company Overview
- 12.1.9.2. Products
- 12.1.9.3. Company Financials
- 12.1.9.4. SWOT Analysis
- 12.1.10 BAE Systems plc
- 12.1.10.1. Company Overview
- 12.1.10.2. Products
- 12.1.10.3. Company Financials
- 12.1.10.4. SWOT Analysis
- 12.1.11 Saab AB
- 12.1.11.1. Company Overview
- 12.1.11.2. Products
- 12.1.11.3. Company Financials
- 12.1.11.4. SWOT Analysis
- 12.1.12 The Boeing Company
- 12.1.12.1. Company Overview
- 12.1.12.2. Products
- 12.1.12.3. Company Financials
- 12.1.12.4. SWOT Analysis
- 12.1.1 L3Harris Technologies Inc
- 12.2. Market Entropy
- 12.2.1 Company's Key Areas Served
- 12.2.2 Recent Developments
- 12.3. Company Market Share Analysis 2025
- 12.3.1 Top 5 Companies Market Share Analysis
- 12.3.2 Top 3 Companies Market Share Analysis
- 12.4. List of Potential Customers
- 13. Research Methodology
List of Figures
- Figure 1: Global Unmanned Sea Systems Industry Revenue Breakdown (Million, %) by Region 2025 & 2033
- Figure 2: North America Unmanned Sea Systems Industry Revenue (Million), by Production Analysis 2025 & 2033
- Figure 3: North America Unmanned Sea Systems Industry Revenue Share (%), by Production Analysis 2025 & 2033
- Figure 4: North America Unmanned Sea Systems Industry Revenue (Million), by Consumption Analysis 2025 & 2033
- Figure 5: North America Unmanned Sea Systems Industry Revenue Share (%), by Consumption Analysis 2025 & 2033
- Figure 6: North America Unmanned Sea Systems Industry Revenue (Million), by Import Market Analysis (Value & Volume) 2025 & 2033
- Figure 7: North America Unmanned Sea Systems Industry Revenue Share (%), by Import Market Analysis (Value & Volume) 2025 & 2033
- Figure 8: North America Unmanned Sea Systems Industry Revenue (Million), by Export Market Analysis (Value & Volume) 2025 & 2033
- Figure 9: North America Unmanned Sea Systems Industry Revenue Share (%), by Export Market Analysis (Value & Volume) 2025 & 2033
- Figure 10: North America Unmanned Sea Systems Industry Revenue (Million), by Price Trend Analysis 2025 & 2033
- Figure 11: North America Unmanned Sea Systems Industry Revenue Share (%), by Price Trend Analysis 2025 & 2033
- Figure 12: North America Unmanned Sea Systems Industry Revenue (Million), by Country 2025 & 2033
- Figure 13: North America Unmanned Sea Systems Industry Revenue Share (%), by Country 2025 & 2033
- Figure 14: South America Unmanned Sea Systems Industry Revenue (Million), by Production Analysis 2025 & 2033
- Figure 15: South America Unmanned Sea Systems Industry Revenue Share (%), by Production Analysis 2025 & 2033
- Figure 16: South America Unmanned Sea Systems Industry Revenue (Million), by Consumption Analysis 2025 & 2033
- Figure 17: South America Unmanned Sea Systems Industry Revenue Share (%), by Consumption Analysis 2025 & 2033
- Figure 18: South America Unmanned Sea Systems Industry Revenue (Million), by Import Market Analysis (Value & Volume) 2025 & 2033
- Figure 19: South America Unmanned Sea Systems Industry Revenue Share (%), by Import Market Analysis (Value & Volume) 2025 & 2033
- Figure 20: South America Unmanned Sea Systems Industry Revenue (Million), by Export Market Analysis (Value & Volume) 2025 & 2033
- Figure 21: South America Unmanned Sea Systems Industry Revenue Share (%), by Export Market Analysis (Value & Volume) 2025 & 2033
- Figure 22: South America Unmanned Sea Systems Industry Revenue (Million), by Price Trend Analysis 2025 & 2033
- Figure 23: South America Unmanned Sea Systems Industry Revenue Share (%), by Price Trend Analysis 2025 & 2033
- Figure 24: South America Unmanned Sea Systems Industry Revenue (Million), by Country 2025 & 2033
- Figure 25: South America Unmanned Sea Systems Industry Revenue Share (%), by Country 2025 & 2033
- Figure 26: Europe Unmanned Sea Systems Industry Revenue (Million), by Production Analysis 2025 & 2033
- Figure 27: Europe Unmanned Sea Systems Industry Revenue Share (%), by Production Analysis 2025 & 2033
- Figure 28: Europe Unmanned Sea Systems Industry Revenue (Million), by Consumption Analysis 2025 & 2033
- Figure 29: Europe Unmanned Sea Systems Industry Revenue Share (%), by Consumption Analysis 2025 & 2033
- Figure 30: Europe Unmanned Sea Systems Industry Revenue (Million), by Import Market Analysis (Value & Volume) 2025 & 2033
- Figure 31: Europe Unmanned Sea Systems Industry Revenue Share (%), by Import Market Analysis (Value & Volume) 2025 & 2033
- Figure 32: Europe Unmanned Sea Systems Industry Revenue (Million), by Export Market Analysis (Value & Volume) 2025 & 2033
- Figure 33: Europe Unmanned Sea Systems Industry Revenue Share (%), by Export Market Analysis (Value & Volume) 2025 & 2033
- Figure 34: Europe Unmanned Sea Systems Industry Revenue (Million), by Price Trend Analysis 2025 & 2033
- Figure 35: Europe Unmanned Sea Systems Industry Revenue Share (%), by Price Trend Analysis 2025 & 2033
- Figure 36: Europe Unmanned Sea Systems Industry Revenue (Million), by Country 2025 & 2033
- Figure 37: Europe Unmanned Sea Systems Industry Revenue Share (%), by Country 2025 & 2033
- Figure 38: Middle East & Africa Unmanned Sea Systems Industry Revenue (Million), by Production Analysis 2025 & 2033
- Figure 39: Middle East & Africa Unmanned Sea Systems Industry Revenue Share (%), by Production Analysis 2025 & 2033
- Figure 40: Middle East & Africa Unmanned Sea Systems Industry Revenue (Million), by Consumption Analysis 2025 & 2033
- Figure 41: Middle East & Africa Unmanned Sea Systems Industry Revenue Share (%), by Consumption Analysis 2025 & 2033
- Figure 42: Middle East & Africa Unmanned Sea Systems Industry Revenue (Million), by Import Market Analysis (Value & Volume) 2025 & 2033
- Figure 43: Middle East & Africa Unmanned Sea Systems Industry Revenue Share (%), by Import Market Analysis (Value & Volume) 2025 & 2033
- Figure 44: Middle East & Africa Unmanned Sea Systems Industry Revenue (Million), by Export Market Analysis (Value & Volume) 2025 & 2033
- Figure 45: Middle East & Africa Unmanned Sea Systems Industry Revenue Share (%), by Export Market Analysis (Value & Volume) 2025 & 2033
- Figure 46: Middle East & Africa Unmanned Sea Systems Industry Revenue (Million), by Price Trend Analysis 2025 & 2033
- Figure 47: Middle East & Africa Unmanned Sea Systems Industry Revenue Share (%), by Price Trend Analysis 2025 & 2033
- Figure 48: Middle East & Africa Unmanned Sea Systems Industry Revenue (Million), by Country 2025 & 2033
- Figure 49: Middle East & Africa Unmanned Sea Systems Industry Revenue Share (%), by Country 2025 & 2033
- Figure 50: Asia Pacific Unmanned Sea Systems Industry Revenue (Million), by Production Analysis 2025 & 2033
- Figure 51: Asia Pacific Unmanned Sea Systems Industry Revenue Share (%), by Production Analysis 2025 & 2033
- Figure 52: Asia Pacific Unmanned Sea Systems Industry Revenue (Million), by Consumption Analysis 2025 & 2033
- Figure 53: Asia Pacific Unmanned Sea Systems Industry Revenue Share (%), by Consumption Analysis 2025 & 2033
- Figure 54: Asia Pacific Unmanned Sea Systems Industry Revenue (Million), by Import Market Analysis (Value & Volume) 2025 & 2033
- Figure 55: Asia Pacific Unmanned Sea Systems Industry Revenue Share (%), by Import Market Analysis (Value & Volume) 2025 & 2033
- Figure 56: Asia Pacific Unmanned Sea Systems Industry Revenue (Million), by Export Market Analysis (Value & Volume) 2025 & 2033
- Figure 57: Asia Pacific Unmanned Sea Systems Industry Revenue Share (%), by Export Market Analysis (Value & Volume) 2025 & 2033
- Figure 58: Asia Pacific Unmanned Sea Systems Industry Revenue (Million), by Price Trend Analysis 2025 & 2033
- Figure 59: Asia Pacific Unmanned Sea Systems Industry Revenue Share (%), by Price Trend Analysis 2025 & 2033
- Figure 60: Asia Pacific Unmanned Sea Systems Industry Revenue (Million), by Country 2025 & 2033
- Figure 61: Asia Pacific Unmanned Sea Systems Industry Revenue Share (%), by Country 2025 & 2033
List of Tables
- Table 1: Global Unmanned Sea Systems Industry Revenue Million Forecast, by Production Analysis 2020 & 2033
- Table 2: Global Unmanned Sea Systems Industry Revenue Million Forecast, by Consumption Analysis 2020 & 2033
- Table 3: Global Unmanned Sea Systems Industry Revenue Million Forecast, by Import Market Analysis (Value & Volume) 2020 & 2033
- Table 4: Global Unmanned Sea Systems Industry Revenue Million Forecast, by Export Market Analysis (Value & Volume) 2020 & 2033
- Table 5: Global Unmanned Sea Systems Industry Revenue Million Forecast, by Price Trend Analysis 2020 & 2033
- Table 6: Global Unmanned Sea Systems Industry Revenue Million Forecast, by Region 2020 & 2033
- Table 7: Global Unmanned Sea Systems Industry Revenue Million Forecast, by Production Analysis 2020 & 2033
- Table 8: Global Unmanned Sea Systems Industry Revenue Million Forecast, by Consumption Analysis 2020 & 2033
- Table 9: Global Unmanned Sea Systems Industry Revenue Million Forecast, by Import Market Analysis (Value & Volume) 2020 & 2033
- Table 10: Global Unmanned Sea Systems Industry Revenue Million Forecast, by Export Market Analysis (Value & Volume) 2020 & 2033
- Table 11: Global Unmanned Sea Systems Industry Revenue Million Forecast, by Price Trend Analysis 2020 & 2033
- Table 12: Global Unmanned Sea Systems Industry Revenue Million Forecast, by Country 2020 & 2033
- Table 13: United States Unmanned Sea Systems Industry Revenue (Million) Forecast, by Application 2020 & 2033
- Table 14: Canada Unmanned Sea Systems Industry Revenue (Million) Forecast, by Application 2020 & 2033
- Table 15: Mexico Unmanned Sea Systems Industry Revenue (Million) Forecast, by Application 2020 & 2033
- Table 16: Global Unmanned Sea Systems Industry Revenue Million Forecast, by Production Analysis 2020 & 2033
- Table 17: Global Unmanned Sea Systems Industry Revenue Million Forecast, by Consumption Analysis 2020 & 2033
- Table 18: Global Unmanned Sea Systems Industry Revenue Million Forecast, by Import Market Analysis (Value & Volume) 2020 & 2033
- Table 19: Global Unmanned Sea Systems Industry Revenue Million Forecast, by Export Market Analysis (Value & Volume) 2020 & 2033
- Table 20: Global Unmanned Sea Systems Industry Revenue Million Forecast, by Price Trend Analysis 2020 & 2033
- Table 21: Global Unmanned Sea Systems Industry Revenue Million Forecast, by Country 2020 & 2033
- Table 22: Brazil Unmanned Sea Systems Industry Revenue (Million) Forecast, by Application 2020 & 2033
- Table 23: Argentina Unmanned Sea Systems Industry Revenue (Million) Forecast, by Application 2020 & 2033
- Table 24: Rest of South America Unmanned Sea Systems Industry Revenue (Million) Forecast, by Application 2020 & 2033
- Table 25: Global Unmanned Sea Systems Industry Revenue Million Forecast, by Production Analysis 2020 & 2033
- Table 26: Global Unmanned Sea Systems Industry Revenue Million Forecast, by Consumption Analysis 2020 & 2033
- Table 27: Global Unmanned Sea Systems Industry Revenue Million Forecast, by Import Market Analysis (Value & Volume) 2020 & 2033
- Table 28: Global Unmanned Sea Systems Industry Revenue Million Forecast, by Export Market Analysis (Value & Volume) 2020 & 2033
- Table 29: Global Unmanned Sea Systems Industry Revenue Million Forecast, by Price Trend Analysis 2020 & 2033
- Table 30: Global Unmanned Sea Systems Industry Revenue Million Forecast, by Country 2020 & 2033
- Table 31: United Kingdom Unmanned Sea Systems Industry Revenue (Million) Forecast, by Application 2020 & 2033
- Table 32: Germany Unmanned Sea Systems Industry Revenue (Million) Forecast, by Application 2020 & 2033
- Table 33: France Unmanned Sea Systems Industry Revenue (Million) Forecast, by Application 2020 & 2033
- Table 34: Italy Unmanned Sea Systems Industry Revenue (Million) Forecast, by Application 2020 & 2033
- Table 35: Spain Unmanned Sea Systems Industry Revenue (Million) Forecast, by Application 2020 & 2033
- Table 36: Russia Unmanned Sea Systems Industry Revenue (Million) Forecast, by Application 2020 & 2033
- Table 37: Benelux Unmanned Sea Systems Industry Revenue (Million) Forecast, by Application 2020 & 2033
- Table 38: Nordics Unmanned Sea Systems Industry Revenue (Million) Forecast, by Application 2020 & 2033
- Table 39: Rest of Europe Unmanned Sea Systems Industry Revenue (Million) Forecast, by Application 2020 & 2033
- Table 40: Global Unmanned Sea Systems Industry Revenue Million Forecast, by Production Analysis 2020 & 2033
- Table 41: Global Unmanned Sea Systems Industry Revenue Million Forecast, by Consumption Analysis 2020 & 2033
- Table 42: Global Unmanned Sea Systems Industry Revenue Million Forecast, by Import Market Analysis (Value & Volume) 2020 & 2033
- Table 43: Global Unmanned Sea Systems Industry Revenue Million Forecast, by Export Market Analysis (Value & Volume) 2020 & 2033
- Table 44: Global Unmanned Sea Systems Industry Revenue Million Forecast, by Price Trend Analysis 2020 & 2033
- Table 45: Global Unmanned Sea Systems Industry Revenue Million Forecast, by Country 2020 & 2033
- Table 46: Turkey Unmanned Sea Systems Industry Revenue (Million) Forecast, by Application 2020 & 2033
- Table 47: Israel Unmanned Sea Systems Industry Revenue (Million) Forecast, by Application 2020 & 2033
- Table 48: GCC Unmanned Sea Systems Industry Revenue (Million) Forecast, by Application 2020 & 2033
- Table 49: North Africa Unmanned Sea Systems Industry Revenue (Million) Forecast, by Application 2020 & 2033
- Table 50: South Africa Unmanned Sea Systems Industry Revenue (Million) Forecast, by Application 2020 & 2033
- Table 51: Rest of Middle East & Africa Unmanned Sea Systems Industry Revenue (Million) Forecast, by Application 2020 & 2033
- Table 52: Global Unmanned Sea Systems Industry Revenue Million Forecast, by Production Analysis 2020 & 2033
- Table 53: Global Unmanned Sea Systems Industry Revenue Million Forecast, by Consumption Analysis 2020 & 2033
- Table 54: Global Unmanned Sea Systems Industry Revenue Million Forecast, by Import Market Analysis (Value & Volume) 2020 & 2033
- Table 55: Global Unmanned Sea Systems Industry Revenue Million Forecast, by Export Market Analysis (Value & Volume) 2020 & 2033
- Table 56: Global Unmanned Sea Systems Industry Revenue Million Forecast, by Price Trend Analysis 2020 & 2033
- Table 57: Global Unmanned Sea Systems Industry Revenue Million Forecast, by Country 2020 & 2033
- Table 58: China Unmanned Sea Systems Industry Revenue (Million) Forecast, by Application 2020 & 2033
- Table 59: India Unmanned Sea Systems Industry Revenue (Million) Forecast, by Application 2020 & 2033
- Table 60: Japan Unmanned Sea Systems Industry Revenue (Million) Forecast, by Application 2020 & 2033
- Table 61: South Korea Unmanned Sea Systems Industry Revenue (Million) Forecast, by Application 2020 & 2033
- Table 62: ASEAN Unmanned Sea Systems Industry Revenue (Million) Forecast, by Application 2020 & 2033
- Table 63: Oceania Unmanned Sea Systems Industry Revenue (Million) Forecast, by Application 2020 & 2033
- Table 64: Rest of Asia Pacific Unmanned Sea Systems Industry Revenue (Million) Forecast, by Application 2020 & 2033
Frequently Asked Questions
1. What is the projected Compound Annual Growth Rate (CAGR) of the Unmanned Sea Systems Industry?
The projected CAGR is approximately 13.78%.
2. Which companies are prominent players in the Unmanned Sea Systems Industry?
Key companies in the market include L3Harris Technologies Inc, Groupe Gorge SA, General Dynamics Corporation, Elbit Systems Ltd, Kongsberg Gruppen ASA, Lockheed Martin Corporation, Maritime Robotics AS, Teledyne Technologies Incorporated, thyssenkrupp AG, BAE Systems plc, Saab AB, The Boeing Company.
3. What are the main segments of the Unmanned Sea Systems Industry?
The market segments include Production Analysis, Consumption Analysis, Import Market Analysis (Value & Volume), Export Market Analysis (Value & Volume), Price Trend Analysis.
4. Can you provide details about the market size?
The market size is estimated to be USD 2.30 Million as of 2022.
5. What are some drivers contributing to market growth?
Increase in Internet of Things (IoT) and Autonomous Systems; Rise in Demand for Military and Defense Satellite Communication Solutions.
6. What are the notable trends driving market growth?
Remotely Operated Vehicles (ROVs) Segment Will Showcase Significant Growth During the Forecast Period.
7. Are there any restraints impacting market growth?
Cybersecurity Threats to Satellite Communication; Interference in Transmission of Data.
8. Can you provide examples of recent developments in the market?
October 2023: The Naval Sea Systems Command, Washington, DC, signed a modification contract with Lockheed Martin Corporation to provide engineering support for Extra Large Unmanned Undersea Vehicle (UUV). The value of the contract was USD 11 million, and it will be completed by September 2024.
9. What pricing options are available for accessing the report?
Pricing options include single-user, multi-user, and enterprise licenses priced at USD 4750, USD 5250, and USD 8750 respectively.
10. Is the market size provided in terms of value or volume?
The market size is provided in terms of value, measured in Million.
11. Are there any specific market keywords associated with the report?
Yes, the market keyword associated with the report is "Unmanned Sea Systems Industry," which aids in identifying and referencing the specific market segment covered.
12. How do I determine which pricing option suits my needs best?
The pricing options vary based on user requirements and access needs. Individual users may opt for single-user licenses, while businesses requiring broader access may choose multi-user or enterprise licenses for cost-effective access to the report.
13. Are there any additional resources or data provided in the Unmanned Sea Systems Industry report?
While the report offers comprehensive insights, it's advisable to review the specific contents or supplementary materials provided to ascertain if additional resources or data are available.
14. How can I stay updated on further developments or reports in the Unmanned Sea Systems Industry?
To stay informed about further developments, trends, and reports in the Unmanned Sea Systems Industry, consider subscribing to industry newsletters, following relevant companies and organizations, or regularly checking reputable industry news sources and publications.
Methodology
Step 1 - Identification of Relevant Samples Size from Population Database


Step 2 - Approaches for Defining Global Market Size (Value, Volume* & Price*)

Note*: In applicable scenarios
Step 3 - Data Sources
Primary Research
- Web Analytics
- Survey Reports
- Research Institute
- Latest Research Reports
- Opinion Leaders
Secondary Research
- Annual Reports
- White Paper
- Latest Press Release
- Industry Association
- Paid Database
- Investor Presentations

Step 4 - Data Triangulation
Involves using different sources of information in order to increase the validity of a study
These sources are likely to be stakeholders in a program - participants, other researchers, program staff, other community members, and so on.
Then we put all data in single framework & apply various statistical tools to find out the dynamic on the market.
During the analysis stage, feedback from the stakeholder groups would be compared to determine areas of agreement as well as areas of divergence