

Key Insights
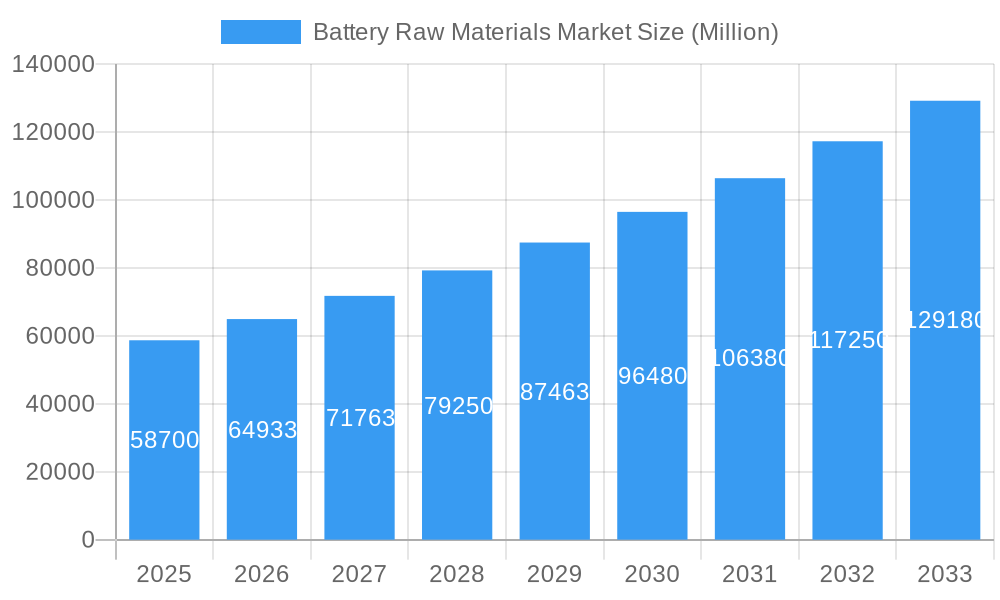
The Battery Raw Materials market, valued at $58.70 billion in 2025, is projected to experience robust growth, driven by the increasing demand for electric vehicles (EVs), energy storage systems (ESS), and portable electronics. The market's Compound Annual Growth Rate (CAGR) of 10.62% from 2025 to 2033 signifies substantial expansion. Key drivers include the global transition to renewable energy sources, stringent emission regulations promoting EV adoption, and the growing need for reliable backup power solutions. Technological advancements in battery technology, particularly the rise of high-energy density lithium-ion batteries and the emerging potential of solid-state batteries, are further fueling market growth. Segmentation reveals a significant share held by lithium-ion batteries within the battery type segment, while cathode materials dominate the material segment due to their crucial role in determining battery performance. The automotive sector is expected to be the largest application segment, reflecting the massive increase in EV production and sales globally. However, challenges remain, including price volatility of raw materials like lithium and cobalt, concerns regarding the environmental impact of battery production and disposal, and the need for further advancements in battery recycling technologies. Despite these restraints, the long-term outlook for the Battery Raw Materials market remains exceptionally positive, indicating a promising investment opportunity for businesses involved in the production and supply of these crucial components.
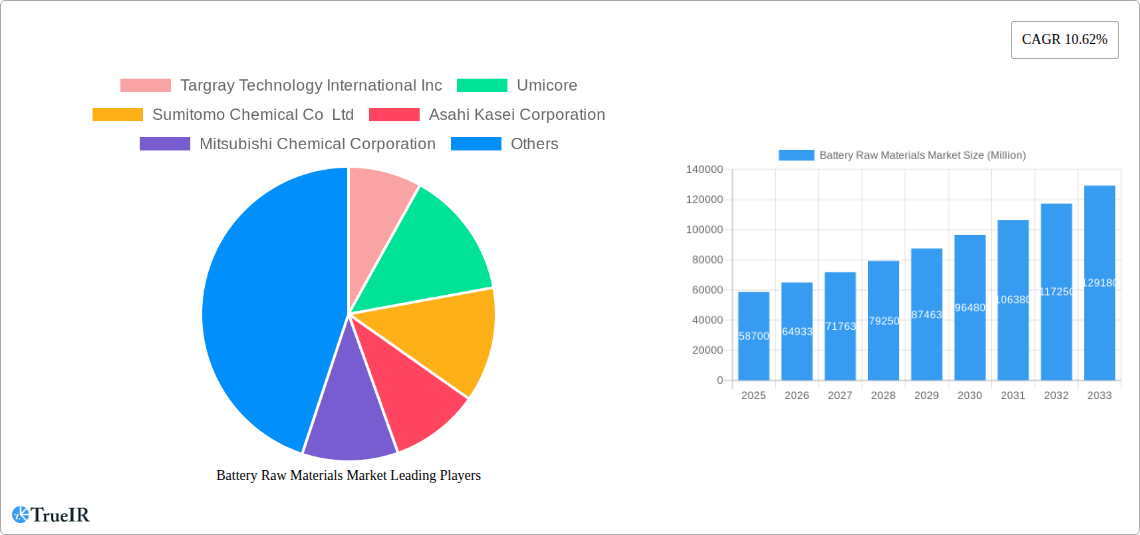
Battery Raw Materials Market Market Size (In Billion)
The geographic distribution of the market is broad, with North America, Europe, and Asia Pacific representing the major regional markets. China, with its substantial EV manufacturing base and burgeoning renewable energy sector, is expected to be a significant growth driver. The increasing adoption of EVs in Europe and North America also contributes to substantial regional market growth. Emerging economies in Asia Pacific and South America are showing promising growth potential, albeit at a slower pace compared to more established markets. Competitive landscape analysis reveals a mix of established chemical companies, specialized materials producers, and technology providers, indicating a highly dynamic market with significant opportunities for both existing players and new entrants focusing on innovation, sustainable sourcing, and efficient supply chain management. The forecast period of 2025-2033 promises sustained market expansion, driven by consistent demand across diverse applications and the continuous evolution of battery technologies.
Battery Raw Materials Market Company Market Share
Battery Raw Materials Market: A Comprehensive Report (2019-2033)
This in-depth report provides a comprehensive analysis of the Battery Raw Materials Market, covering the period from 2019 to 2033. We delve into market structure, competitive dynamics, key trends, and future growth prospects, offering invaluable insights for industry stakeholders, investors, and researchers. The market is segmented by battery type (Lead-acid, Lithium-ion, Other Battery Types), material (Cathode, Anode, Electrolyte, Separator), and application (Consumer Electronics, Automotive, Industrial, Telecommunication, Other Applications). The report projects a xx Million market value by 2033, with a CAGR of xx% during the forecast period (2025-2033). Key players analyzed include Targray Technology International Inc, Umicore, Sumitomo Chemical Co Ltd, Asahi Kasei Corporation, Mitsubishi Chemical Corporation, Celgard LLC, BASF SE, ENTEK, Johnson Matthey, ITOCHU Corporation, and NICHIA CORPORATION.
Battery Raw Materials Market Market Structure & Competitive Landscape
The Battery Raw Materials Market exhibits a moderately concentrated structure, with a few dominant players controlling significant market share. The Herfindahl-Hirschman Index (HHI) for 2024 was estimated at xx, indicating a moderately concentrated market. Innovation is a crucial driver, with companies constantly investing in R&D to develop advanced materials and improve battery performance. Stringent environmental regulations and increasing focus on sustainability are significantly impacting the market. Product substitutes, such as alternative energy storage technologies, pose a potential threat, although lithium-ion batteries currently dominate.
- Market Concentration: HHI (2024): xx
- Innovation Drivers: Development of high-energy density materials, improved battery lifecycle, and cost reduction strategies.
- Regulatory Impacts: Stringent environmental regulations and safety standards are shaping the market landscape.
- Product Substitutes: Alternative energy storage technologies pose a long-term threat, but their market penetration remains limited currently.
- End-User Segmentation: Automotive, consumer electronics, and energy storage are the major end-use segments.
- M&A Trends: The market has witnessed xx M&A deals in the last 5 years, driven by efforts to consolidate market share and access new technologies. The total deal value was approximately xx Million.
Battery Raw Materials Market Market Trends & Opportunities
The global Battery Raw Materials Market is experiencing a robust expansion, driven by the accelerating adoption of electric vehicles (EVs), the growing demand for advanced portable electronics, and the critical need for efficient renewable energy storage systems. The market was valued at approximately XX Million USD in 2024 and is on track to reach an estimated XX Million USD by 2033, showcasing a significant compound annual growth rate (CAGR).
Key market trends include continuous innovation in battery chemistry, with a particular focus on enhancing lithium-ion technology to achieve higher energy densities, faster charging capabilities, and extended battery lifecycles. This technological evolution is crucial for meeting the performance demands of next-generation EVs and electronic devices. Concurrently, there's a discernible shift in consumer and industry preferences towards more sustainable, ethically sourced, and environmentally friendly energy storage solutions, which is a powerful catalyst for market growth.
The competitive landscape is characterized by intense rivalry among raw material suppliers, leading to strategic price adjustments and fostering an environment ripe for innovation. Companies are actively pursuing differentiation through proprietary technologies, supply chain optimization, and strategic alliances to secure raw material access and develop novel battery components. While developed regions exhibit high market penetration, emerging economies present substantial untapped growth potential due to increasing industrialization and a rising middle class.
Dominant Markets & Segments in Battery Raw Materials Market
The Lithium-ion battery segment dominates the Battery Raw Materials Market, driven by its widespread adoption in electric vehicles and portable electronics. The automotive application segment represents the largest end-use sector, owing to the rapid growth of the EV industry. Geographically, Asia-Pacific is the leading market, followed by North America and Europe.
- By Battery Type:
- Lithium-ion batteries hold the largest market share due to their high energy density and versatility.
- Lead-acid batteries maintain a significant market presence in stationary applications.
- Other battery types (NiMH, solid-state) are showing strong growth potential.
- By Material:
- Cathode materials represent the largest segment due to their importance in determining battery performance.
- Anode, electrolyte, and separator materials are all experiencing significant growth.
- By Application:
- Automotive is the fastest-growing segment, driven by the increasing adoption of EVs.
- Consumer electronics and energy storage are also significant application areas.
- Key Growth Drivers:
- Government incentives and subsidies for EV adoption
- Growing demand for renewable energy storage
- Advancements in battery technology leading to improved performance and lower costs.
Battery Raw Materials Market Product Analysis
Significant innovations are shaping the product landscape, including the development of high-nickel cathode materials, silicon-based anodes, and solid-state electrolytes. These advancements offer improved energy density, faster charging, and enhanced safety. The market is witnessing increasing competition based on product performance, cost-effectiveness, and sustainability attributes. The focus is on developing next-generation materials that offer a better balance between performance, cost, and environmental impact.
Key Drivers, Barriers & Challenges in Battery Raw Materials Market
Key Drivers:
- Rapid growth of the electric vehicle (EV) market.
- Increasing demand for renewable energy storage systems.
- Technological advancements leading to improved battery performance and lower costs.
- Government support and incentives promoting the adoption of electric vehicles and renewable energy.
Challenges and Restraints:
- Supply chain disruptions and price volatility for key raw materials like lithium and cobalt.
- Environmental concerns associated with mining and processing of battery materials.
- Stringent regulatory requirements and safety standards.
- Competition from alternative energy storage technologies. The impact of these constraints is estimated to reduce market growth by approximately xx% by 2033.
Growth Drivers in the Battery Raw Materials Market Market
The Battery Raw Materials Market is primarily propelled by several interconnected growth drivers. The exponential surge in electric vehicle (EV) sales globally is a paramount factor, directly increasing the demand for battery components. Furthermore, the rapid expansion of the renewable energy sector, including solar and wind power, necessitates large-scale energy storage solutions, further boosting the need for raw materials. Significant and ongoing investments in research and development (R&D) are crucial for improving battery performance, safety, and cost-effectiveness, leading to the exploration and utilization of new materials. Supportive government policies and incentives worldwide, aimed at accelerating EV adoption and promoting renewable energy integration, play a vital role in shaping market dynamics and driving demand for battery raw materials.
Challenges Impacting Battery Raw Materials Market Growth
Despite its promising growth trajectory, the Battery Raw Materials Market faces several significant challenges. The volatility in the prices of critical raw materials such as lithium, cobalt, and nickel, often influenced by geopolitical factors and supply-demand imbalances, can lead to market uncertainty and impact production costs. Environmental concerns associated with the mining and extraction processes of these materials, including habitat disruption and water usage, are under increasing scrutiny. The complex and evolving regulatory landscape governing battery manufacturing, recycling, and disposal across different regions adds another layer of complexity, potentially slowing down market expansion. Ensuring ethical sourcing and sustainable practices throughout the supply chain remains a critical challenge for the industry.
Key Players Shaping the Battery Raw Materials Market Market
Significant Battery Raw Materials Market Industry Milestones
- July 2023: Asahi Kasei advanced the battery technology landscape by licensing design and manufacturing technology for lithium-ion capacitors. This innovation promises significant improvements in terms of lower costs, increased energy storage capacity, and enhanced I/O performance, particularly beneficial for specialized applications.
- March 2023: A strategic collaboration was formed between Celgard and C4V. This partnership focused on the joint development of advanced separator solutions specifically optimized for C4V's high-voltage BM-LMP cathode material, aiming to boost battery performance and safety.
- January 2024: Iveco Group and BASF announced a significant partnership focused on developing a comprehensive lithium-ion battery recycling solution. This initiative underscores the industry's commitment to sustainability by aiming to extend the lifespan of batteries and minimize their environmental impact through effective resource recovery.
Future Outlook for Battery Raw Materials Market Market
The Battery Raw Materials Market is poised for continued robust growth, driven by the expanding electric vehicle market, the increasing adoption of renewable energy storage, and ongoing advancements in battery technologies. Strategic partnerships, investments in R&D, and innovative material development will shape the future market landscape, presenting significant opportunities for industry players.
Battery Raw Materials Market Segmentation
-
1. Battery Type
- 1.1. Lead-acid
- 1.2. Lithium-ion
- 1.3. Other Battery Type
-
2. Material
- 2.1. Cathode
- 2.2. Anode
- 2.3. Electrolyte
- 2.4. Separator
-
3. Application
- 3.1. Consumer Electronics
- 3.2. Automotive
- 3.3. Industrial
- 3.4. Telecommunication
- 3.5. Other Applications (Renewable Energy Storage)
Battery Raw Materials Market Segmentation By Geography
-
1. Asia Pacific
- 1.1. China
- 1.2. India
- 1.3. Japan
- 1.4. South Korea
- 1.5. Thailand
- 1.6. Malaysia
- 1.7. Indonesia
- 1.8. Vietnam
- 1.9. Rest of Asia Pacific
-
2. North America
- 2.1. United States
- 2.2. Canada
- 2.3. Mexico
-
3. Europe
- 3.1. Germany
- 3.2. United Kingdom
- 3.3. France
- 3.4. Italy
- 3.5. Spain
- 3.6. Turkey
- 3.7. Russia
- 3.8. NORDIC
- 3.9. Rest of Europe
-
4. Rest of the World
- 4.1. South America
- 4.2. Middle East and Africa
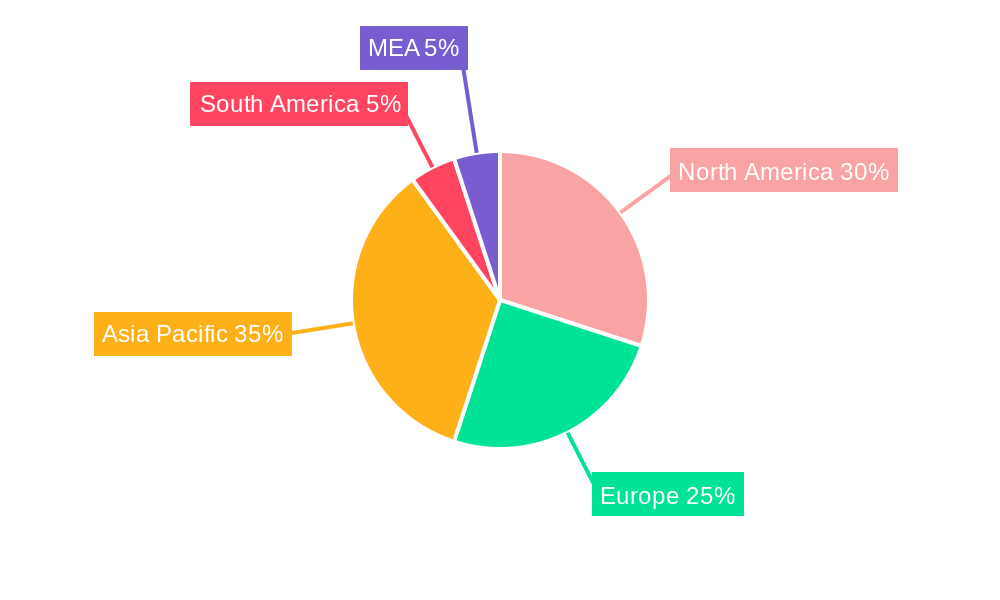
Battery Raw Materials Market Regional Market Share
Geographic Coverage of Battery Raw Materials Market
Battery Raw Materials Market REPORT HIGHLIGHTS
| Aspects | Details |
|---|---|
| Study Period | 2020-2034 |
| Base Year | 2025 |
| Estimated Year | 2026 |
| Forecast Period | 2026-2034 |
| Historical Period | 2020-2025 |
| Growth Rate | CAGR of 10.62% from 2020-2034 |
| Segmentation |
|
Table of Contents
- 1. Introduction
- 1.1. Research Scope
- 1.2. Market Segmentation
- 1.3. Research Objective
- 1.4. Definitions and Assumptions
- 2. Executive Summary
- 2.1. Market Snapshot
- 3. Market Dynamics
- 3.1. Market Drivers
- 3.2. Market Restrains
- 3.3. Market Trends
- 3.4. Market Opportunities
- 4. Market Factor Analysis
- 4.1. Porters Five Forces
- 4.1.1. Bargaining Power of Suppliers
- 4.1.2. Bargaining Power of Buyers
- 4.1.3. Threat of New Entrants
- 4.1.4. Threat of Substitutes
- 4.1.5. Competitive Rivalry
- 4.2. PESTEL analysis
- 4.3. BCG Analysis
- 4.3.1. Stars (High Growth, High Market Share)
- 4.3.2. Cash Cows (Low Growth, High Market Share)
- 4.3.3. Question Mark (High Growth, Low Market Share)
- 4.3.4. Dogs (Low Growth, Low Market Share)
- 4.4. Ansoff Matrix Analysis
- 4.5. Supply Chain Analysis
- 4.6. Regulatory Landscape
- 4.7. Current Market Potential and Opportunity Assessment (TAM–SAM–SOM Framework)
- 4.8. TIR Analyst Note
- 4.1. Porters Five Forces
- 5. Market Analysis, Insights and Forecast 2021-2033
- 5.1. Market Analysis, Insights and Forecast - by Battery Type
- 5.1.1. Lead-acid
- 5.1.2. Lithium-ion
- 5.1.3. Other Battery Type
- 5.2. Market Analysis, Insights and Forecast - by Material
- 5.2.1. Cathode
- 5.2.2. Anode
- 5.2.3. Electrolyte
- 5.2.4. Separator
- 5.3. Market Analysis, Insights and Forecast - by Application
- 5.3.1. Consumer Electronics
- 5.3.2. Automotive
- 5.3.3. Industrial
- 5.3.4. Telecommunication
- 5.3.5. Other Applications (Renewable Energy Storage)
- 5.4. Market Analysis, Insights and Forecast - by Region
- 5.4.1. Asia Pacific
- 5.4.2. North America
- 5.4.3. Europe
- 5.4.4. Rest of the World
- 5.1. Market Analysis, Insights and Forecast - by Battery Type
- 6. Global Battery Raw Materials Market Analysis, Insights and Forecast, 2021-2033
- 6.1. Market Analysis, Insights and Forecast - by Battery Type
- 6.1.1. Lead-acid
- 6.1.2. Lithium-ion
- 6.1.3. Other Battery Type
- 6.2. Market Analysis, Insights and Forecast - by Material
- 6.2.1. Cathode
- 6.2.2. Anode
- 6.2.3. Electrolyte
- 6.2.4. Separator
- 6.3. Market Analysis, Insights and Forecast - by Application
- 6.3.1. Consumer Electronics
- 6.3.2. Automotive
- 6.3.3. Industrial
- 6.3.4. Telecommunication
- 6.3.5. Other Applications (Renewable Energy Storage)
- 6.1. Market Analysis, Insights and Forecast - by Battery Type
- 7. Asia Pacific Battery Raw Materials Market Analysis, Insights and Forecast, 2020-2032
- 7.1. Market Analysis, Insights and Forecast - by Battery Type
- 7.1.1. Lead-acid
- 7.1.2. Lithium-ion
- 7.1.3. Other Battery Type
- 7.2. Market Analysis, Insights and Forecast - by Material
- 7.2.1. Cathode
- 7.2.2. Anode
- 7.2.3. Electrolyte
- 7.2.4. Separator
- 7.3. Market Analysis, Insights and Forecast - by Application
- 7.3.1. Consumer Electronics
- 7.3.2. Automotive
- 7.3.3. Industrial
- 7.3.4. Telecommunication
- 7.3.5. Other Applications (Renewable Energy Storage)
- 7.1. Market Analysis, Insights and Forecast - by Battery Type
- 8. North America Battery Raw Materials Market Analysis, Insights and Forecast, 2020-2032
- 8.1. Market Analysis, Insights and Forecast - by Battery Type
- 8.1.1. Lead-acid
- 8.1.2. Lithium-ion
- 8.1.3. Other Battery Type
- 8.2. Market Analysis, Insights and Forecast - by Material
- 8.2.1. Cathode
- 8.2.2. Anode
- 8.2.3. Electrolyte
- 8.2.4. Separator
- 8.3. Market Analysis, Insights and Forecast - by Application
- 8.3.1. Consumer Electronics
- 8.3.2. Automotive
- 8.3.3. Industrial
- 8.3.4. Telecommunication
- 8.3.5. Other Applications (Renewable Energy Storage)
- 8.1. Market Analysis, Insights and Forecast - by Battery Type
- 9. Europe Battery Raw Materials Market Analysis, Insights and Forecast, 2020-2032
- 9.1. Market Analysis, Insights and Forecast - by Battery Type
- 9.1.1. Lead-acid
- 9.1.2. Lithium-ion
- 9.1.3. Other Battery Type
- 9.2. Market Analysis, Insights and Forecast - by Material
- 9.2.1. Cathode
- 9.2.2. Anode
- 9.2.3. Electrolyte
- 9.2.4. Separator
- 9.3. Market Analysis, Insights and Forecast - by Application
- 9.3.1. Consumer Electronics
- 9.3.2. Automotive
- 9.3.3. Industrial
- 9.3.4. Telecommunication
- 9.3.5. Other Applications (Renewable Energy Storage)
- 9.1. Market Analysis, Insights and Forecast - by Battery Type
- 10. Rest of the World Battery Raw Materials Market Analysis, Insights and Forecast, 2020-2032
- 10.1. Market Analysis, Insights and Forecast - by Battery Type
- 10.1.1. Lead-acid
- 10.1.2. Lithium-ion
- 10.1.3. Other Battery Type
- 10.2. Market Analysis, Insights and Forecast - by Material
- 10.2.1. Cathode
- 10.2.2. Anode
- 10.2.3. Electrolyte
- 10.2.4. Separator
- 10.3. Market Analysis, Insights and Forecast - by Application
- 10.3.1. Consumer Electronics
- 10.3.2. Automotive
- 10.3.3. Industrial
- 10.3.4. Telecommunication
- 10.3.5. Other Applications (Renewable Energy Storage)
- 10.1. Market Analysis, Insights and Forecast - by Battery Type
- 11. Competitive Analysis
- 11.1. Company Profiles
- 11.1.1 Targray Technology International Inc
- 11.1.1.1. Company Overview
- 11.1.1.2. Products
- 11.1.1.3. Company Financials
- 11.1.1.4. SWOT Analysis
- 11.1.2 Umicore
- 11.1.2.1. Company Overview
- 11.1.2.2. Products
- 11.1.2.3. Company Financials
- 11.1.2.4. SWOT Analysis
- 11.1.3 Sumitomo Chemical Co Ltd
- 11.1.3.1. Company Overview
- 11.1.3.2. Products
- 11.1.3.3. Company Financials
- 11.1.3.4. SWOT Analysis
- 11.1.4 Asahi Kasei Corporation
- 11.1.4.1. Company Overview
- 11.1.4.2. Products
- 11.1.4.3. Company Financials
- 11.1.4.4. SWOT Analysis
- 11.1.5 Mitsubishi Chemical Corporation
- 11.1.5.1. Company Overview
- 11.1.5.2. Products
- 11.1.5.3. Company Financials
- 11.1.5.4. SWOT Analysis
- 11.1.6 Celgard LLC
- 11.1.6.1. Company Overview
- 11.1.6.2. Products
- 11.1.6.3. Company Financials
- 11.1.6.4. SWOT Analysis
- 11.1.7 BASF SE
- 11.1.7.1. Company Overview
- 11.1.7.2. Products
- 11.1.7.3. Company Financials
- 11.1.7.4. SWOT Analysis
- 11.1.8 ENTEK
- 11.1.8.1. Company Overview
- 11.1.8.2. Products
- 11.1.8.3. Company Financials
- 11.1.8.4. SWOT Analysis
- 11.1.9 Johnson Matthey
- 11.1.9.1. Company Overview
- 11.1.9.2. Products
- 11.1.9.3. Company Financials
- 11.1.9.4. SWOT Analysis
- 11.1.10 ITOCHU Corporation
- 11.1.10.1. Company Overview
- 11.1.10.2. Products
- 11.1.10.3. Company Financials
- 11.1.10.4. SWOT Analysis
- 11.1.11 NICHIA CORPORATION
- 11.1.11.1. Company Overview
- 11.1.11.2. Products
- 11.1.11.3. Company Financials
- 11.1.11.4. SWOT Analysis
- 11.1.1 Targray Technology International Inc
- 11.2. Market Entropy
- 11.2.1 Company's Key Areas Served
- 11.2.2 Recent Developments
- 11.3. Company Market Share Analysis 2025
- 11.3.1 Top 5 Companies Market Share Analysis
- 11.3.2 Top 3 Companies Market Share Analysis
- 11.4. List of Potential Customers
- 12. Research Methodology
List of Figures
- Figure 1: Global Battery Raw Materials Market Revenue Breakdown (Million, %) by Region 2025 & 2033
- Figure 2: Global Battery Raw Materials Market Volume Breakdown (K Tons, %) by Region 2025 & 2033
- Figure 3: Asia Pacific Battery Raw Materials Market Revenue (Million), by Battery Type 2025 & 2033
- Figure 4: Asia Pacific Battery Raw Materials Market Volume (K Tons), by Battery Type 2025 & 2033
- Figure 5: Asia Pacific Battery Raw Materials Market Revenue Share (%), by Battery Type 2025 & 2033
- Figure 6: Asia Pacific Battery Raw Materials Market Volume Share (%), by Battery Type 2025 & 2033
- Figure 7: Asia Pacific Battery Raw Materials Market Revenue (Million), by Material 2025 & 2033
- Figure 8: Asia Pacific Battery Raw Materials Market Volume (K Tons), by Material 2025 & 2033
- Figure 9: Asia Pacific Battery Raw Materials Market Revenue Share (%), by Material 2025 & 2033
- Figure 10: Asia Pacific Battery Raw Materials Market Volume Share (%), by Material 2025 & 2033
- Figure 11: Asia Pacific Battery Raw Materials Market Revenue (Million), by Application 2025 & 2033
- Figure 12: Asia Pacific Battery Raw Materials Market Volume (K Tons), by Application 2025 & 2033
- Figure 13: Asia Pacific Battery Raw Materials Market Revenue Share (%), by Application 2025 & 2033
- Figure 14: Asia Pacific Battery Raw Materials Market Volume Share (%), by Application 2025 & 2033
- Figure 15: Asia Pacific Battery Raw Materials Market Revenue (Million), by Country 2025 & 2033
- Figure 16: Asia Pacific Battery Raw Materials Market Volume (K Tons), by Country 2025 & 2033
- Figure 17: Asia Pacific Battery Raw Materials Market Revenue Share (%), by Country 2025 & 2033
- Figure 18: Asia Pacific Battery Raw Materials Market Volume Share (%), by Country 2025 & 2033
- Figure 19: North America Battery Raw Materials Market Revenue (Million), by Battery Type 2025 & 2033
- Figure 20: North America Battery Raw Materials Market Volume (K Tons), by Battery Type 2025 & 2033
- Figure 21: North America Battery Raw Materials Market Revenue Share (%), by Battery Type 2025 & 2033
- Figure 22: North America Battery Raw Materials Market Volume Share (%), by Battery Type 2025 & 2033
- Figure 23: North America Battery Raw Materials Market Revenue (Million), by Material 2025 & 2033
- Figure 24: North America Battery Raw Materials Market Volume (K Tons), by Material 2025 & 2033
- Figure 25: North America Battery Raw Materials Market Revenue Share (%), by Material 2025 & 2033
- Figure 26: North America Battery Raw Materials Market Volume Share (%), by Material 2025 & 2033
- Figure 27: North America Battery Raw Materials Market Revenue (Million), by Application 2025 & 2033
- Figure 28: North America Battery Raw Materials Market Volume (K Tons), by Application 2025 & 2033
- Figure 29: North America Battery Raw Materials Market Revenue Share (%), by Application 2025 & 2033
- Figure 30: North America Battery Raw Materials Market Volume Share (%), by Application 2025 & 2033
- Figure 31: North America Battery Raw Materials Market Revenue (Million), by Country 2025 & 2033
- Figure 32: North America Battery Raw Materials Market Volume (K Tons), by Country 2025 & 2033
- Figure 33: North America Battery Raw Materials Market Revenue Share (%), by Country 2025 & 2033
- Figure 34: North America Battery Raw Materials Market Volume Share (%), by Country 2025 & 2033
- Figure 35: Europe Battery Raw Materials Market Revenue (Million), by Battery Type 2025 & 2033
- Figure 36: Europe Battery Raw Materials Market Volume (K Tons), by Battery Type 2025 & 2033
- Figure 37: Europe Battery Raw Materials Market Revenue Share (%), by Battery Type 2025 & 2033
- Figure 38: Europe Battery Raw Materials Market Volume Share (%), by Battery Type 2025 & 2033
- Figure 39: Europe Battery Raw Materials Market Revenue (Million), by Material 2025 & 2033
- Figure 40: Europe Battery Raw Materials Market Volume (K Tons), by Material 2025 & 2033
- Figure 41: Europe Battery Raw Materials Market Revenue Share (%), by Material 2025 & 2033
- Figure 42: Europe Battery Raw Materials Market Volume Share (%), by Material 2025 & 2033
- Figure 43: Europe Battery Raw Materials Market Revenue (Million), by Application 2025 & 2033
- Figure 44: Europe Battery Raw Materials Market Volume (K Tons), by Application 2025 & 2033
- Figure 45: Europe Battery Raw Materials Market Revenue Share (%), by Application 2025 & 2033
- Figure 46: Europe Battery Raw Materials Market Volume Share (%), by Application 2025 & 2033
- Figure 47: Europe Battery Raw Materials Market Revenue (Million), by Country 2025 & 2033
- Figure 48: Europe Battery Raw Materials Market Volume (K Tons), by Country 2025 & 2033
- Figure 49: Europe Battery Raw Materials Market Revenue Share (%), by Country 2025 & 2033
- Figure 50: Europe Battery Raw Materials Market Volume Share (%), by Country 2025 & 2033
- Figure 51: Rest of the World Battery Raw Materials Market Revenue (Million), by Battery Type 2025 & 2033
- Figure 52: Rest of the World Battery Raw Materials Market Volume (K Tons), by Battery Type 2025 & 2033
- Figure 53: Rest of the World Battery Raw Materials Market Revenue Share (%), by Battery Type 2025 & 2033
- Figure 54: Rest of the World Battery Raw Materials Market Volume Share (%), by Battery Type 2025 & 2033
- Figure 55: Rest of the World Battery Raw Materials Market Revenue (Million), by Material 2025 & 2033
- Figure 56: Rest of the World Battery Raw Materials Market Volume (K Tons), by Material 2025 & 2033
- Figure 57: Rest of the World Battery Raw Materials Market Revenue Share (%), by Material 2025 & 2033
- Figure 58: Rest of the World Battery Raw Materials Market Volume Share (%), by Material 2025 & 2033
- Figure 59: Rest of the World Battery Raw Materials Market Revenue (Million), by Application 2025 & 2033
- Figure 60: Rest of the World Battery Raw Materials Market Volume (K Tons), by Application 2025 & 2033
- Figure 61: Rest of the World Battery Raw Materials Market Revenue Share (%), by Application 2025 & 2033
- Figure 62: Rest of the World Battery Raw Materials Market Volume Share (%), by Application 2025 & 2033
- Figure 63: Rest of the World Battery Raw Materials Market Revenue (Million), by Country 2025 & 2033
- Figure 64: Rest of the World Battery Raw Materials Market Volume (K Tons), by Country 2025 & 2033
- Figure 65: Rest of the World Battery Raw Materials Market Revenue Share (%), by Country 2025 & 2033
- Figure 66: Rest of the World Battery Raw Materials Market Volume Share (%), by Country 2025 & 2033
List of Tables
- Table 1: Global Battery Raw Materials Market Revenue Million Forecast, by Battery Type 2020 & 2033
- Table 2: Global Battery Raw Materials Market Volume K Tons Forecast, by Battery Type 2020 & 2033
- Table 3: Global Battery Raw Materials Market Revenue Million Forecast, by Material 2020 & 2033
- Table 4: Global Battery Raw Materials Market Volume K Tons Forecast, by Material 2020 & 2033
- Table 5: Global Battery Raw Materials Market Revenue Million Forecast, by Application 2020 & 2033
- Table 6: Global Battery Raw Materials Market Volume K Tons Forecast, by Application 2020 & 2033
- Table 7: Global Battery Raw Materials Market Revenue Million Forecast, by Region 2020 & 2033
- Table 8: Global Battery Raw Materials Market Volume K Tons Forecast, by Region 2020 & 2033
- Table 9: Global Battery Raw Materials Market Revenue Million Forecast, by Battery Type 2020 & 2033
- Table 10: Global Battery Raw Materials Market Volume K Tons Forecast, by Battery Type 2020 & 2033
- Table 11: Global Battery Raw Materials Market Revenue Million Forecast, by Material 2020 & 2033
- Table 12: Global Battery Raw Materials Market Volume K Tons Forecast, by Material 2020 & 2033
- Table 13: Global Battery Raw Materials Market Revenue Million Forecast, by Application 2020 & 2033
- Table 14: Global Battery Raw Materials Market Volume K Tons Forecast, by Application 2020 & 2033
- Table 15: Global Battery Raw Materials Market Revenue Million Forecast, by Country 2020 & 2033
- Table 16: Global Battery Raw Materials Market Volume K Tons Forecast, by Country 2020 & 2033
- Table 17: China Battery Raw Materials Market Revenue (Million) Forecast, by Application 2020 & 2033
- Table 18: China Battery Raw Materials Market Volume (K Tons) Forecast, by Application 2020 & 2033
- Table 19: India Battery Raw Materials Market Revenue (Million) Forecast, by Application 2020 & 2033
- Table 20: India Battery Raw Materials Market Volume (K Tons) Forecast, by Application 2020 & 2033
- Table 21: Japan Battery Raw Materials Market Revenue (Million) Forecast, by Application 2020 & 2033
- Table 22: Japan Battery Raw Materials Market Volume (K Tons) Forecast, by Application 2020 & 2033
- Table 23: South Korea Battery Raw Materials Market Revenue (Million) Forecast, by Application 2020 & 2033
- Table 24: South Korea Battery Raw Materials Market Volume (K Tons) Forecast, by Application 2020 & 2033
- Table 25: Thailand Battery Raw Materials Market Revenue (Million) Forecast, by Application 2020 & 2033
- Table 26: Thailand Battery Raw Materials Market Volume (K Tons) Forecast, by Application 2020 & 2033
- Table 27: Malaysia Battery Raw Materials Market Revenue (Million) Forecast, by Application 2020 & 2033
- Table 28: Malaysia Battery Raw Materials Market Volume (K Tons) Forecast, by Application 2020 & 2033
- Table 29: Indonesia Battery Raw Materials Market Revenue (Million) Forecast, by Application 2020 & 2033
- Table 30: Indonesia Battery Raw Materials Market Volume (K Tons) Forecast, by Application 2020 & 2033
- Table 31: Vietnam Battery Raw Materials Market Revenue (Million) Forecast, by Application 2020 & 2033
- Table 32: Vietnam Battery Raw Materials Market Volume (K Tons) Forecast, by Application 2020 & 2033
- Table 33: Rest of Asia Pacific Battery Raw Materials Market Revenue (Million) Forecast, by Application 2020 & 2033
- Table 34: Rest of Asia Pacific Battery Raw Materials Market Volume (K Tons) Forecast, by Application 2020 & 2033
- Table 35: Global Battery Raw Materials Market Revenue Million Forecast, by Battery Type 2020 & 2033
- Table 36: Global Battery Raw Materials Market Volume K Tons Forecast, by Battery Type 2020 & 2033
- Table 37: Global Battery Raw Materials Market Revenue Million Forecast, by Material 2020 & 2033
- Table 38: Global Battery Raw Materials Market Volume K Tons Forecast, by Material 2020 & 2033
- Table 39: Global Battery Raw Materials Market Revenue Million Forecast, by Application 2020 & 2033
- Table 40: Global Battery Raw Materials Market Volume K Tons Forecast, by Application 2020 & 2033
- Table 41: Global Battery Raw Materials Market Revenue Million Forecast, by Country 2020 & 2033
- Table 42: Global Battery Raw Materials Market Volume K Tons Forecast, by Country 2020 & 2033
- Table 43: United States Battery Raw Materials Market Revenue (Million) Forecast, by Application 2020 & 2033
- Table 44: United States Battery Raw Materials Market Volume (K Tons) Forecast, by Application 2020 & 2033
- Table 45: Canada Battery Raw Materials Market Revenue (Million) Forecast, by Application 2020 & 2033
- Table 46: Canada Battery Raw Materials Market Volume (K Tons) Forecast, by Application 2020 & 2033
- Table 47: Mexico Battery Raw Materials Market Revenue (Million) Forecast, by Application 2020 & 2033
- Table 48: Mexico Battery Raw Materials Market Volume (K Tons) Forecast, by Application 2020 & 2033
- Table 49: Global Battery Raw Materials Market Revenue Million Forecast, by Battery Type 2020 & 2033
- Table 50: Global Battery Raw Materials Market Volume K Tons Forecast, by Battery Type 2020 & 2033
- Table 51: Global Battery Raw Materials Market Revenue Million Forecast, by Material 2020 & 2033
- Table 52: Global Battery Raw Materials Market Volume K Tons Forecast, by Material 2020 & 2033
- Table 53: Global Battery Raw Materials Market Revenue Million Forecast, by Application 2020 & 2033
- Table 54: Global Battery Raw Materials Market Volume K Tons Forecast, by Application 2020 & 2033
- Table 55: Global Battery Raw Materials Market Revenue Million Forecast, by Country 2020 & 2033
- Table 56: Global Battery Raw Materials Market Volume K Tons Forecast, by Country 2020 & 2033
- Table 57: Germany Battery Raw Materials Market Revenue (Million) Forecast, by Application 2020 & 2033
- Table 58: Germany Battery Raw Materials Market Volume (K Tons) Forecast, by Application 2020 & 2033
- Table 59: United Kingdom Battery Raw Materials Market Revenue (Million) Forecast, by Application 2020 & 2033
- Table 60: United Kingdom Battery Raw Materials Market Volume (K Tons) Forecast, by Application 2020 & 2033
- Table 61: France Battery Raw Materials Market Revenue (Million) Forecast, by Application 2020 & 2033
- Table 62: France Battery Raw Materials Market Volume (K Tons) Forecast, by Application 2020 & 2033
- Table 63: Italy Battery Raw Materials Market Revenue (Million) Forecast, by Application 2020 & 2033
- Table 64: Italy Battery Raw Materials Market Volume (K Tons) Forecast, by Application 2020 & 2033
- Table 65: Spain Battery Raw Materials Market Revenue (Million) Forecast, by Application 2020 & 2033
- Table 66: Spain Battery Raw Materials Market Volume (K Tons) Forecast, by Application 2020 & 2033
- Table 67: Turkey Battery Raw Materials Market Revenue (Million) Forecast, by Application 2020 & 2033
- Table 68: Turkey Battery Raw Materials Market Volume (K Tons) Forecast, by Application 2020 & 2033
- Table 69: Russia Battery Raw Materials Market Revenue (Million) Forecast, by Application 2020 & 2033
- Table 70: Russia Battery Raw Materials Market Volume (K Tons) Forecast, by Application 2020 & 2033
- Table 71: NORDIC Battery Raw Materials Market Revenue (Million) Forecast, by Application 2020 & 2033
- Table 72: NORDIC Battery Raw Materials Market Volume (K Tons) Forecast, by Application 2020 & 2033
- Table 73: Rest of Europe Battery Raw Materials Market Revenue (Million) Forecast, by Application 2020 & 2033
- Table 74: Rest of Europe Battery Raw Materials Market Volume (K Tons) Forecast, by Application 2020 & 2033
- Table 75: Global Battery Raw Materials Market Revenue Million Forecast, by Battery Type 2020 & 2033
- Table 76: Global Battery Raw Materials Market Volume K Tons Forecast, by Battery Type 2020 & 2033
- Table 77: Global Battery Raw Materials Market Revenue Million Forecast, by Material 2020 & 2033
- Table 78: Global Battery Raw Materials Market Volume K Tons Forecast, by Material 2020 & 2033
- Table 79: Global Battery Raw Materials Market Revenue Million Forecast, by Application 2020 & 2033
- Table 80: Global Battery Raw Materials Market Volume K Tons Forecast, by Application 2020 & 2033
- Table 81: Global Battery Raw Materials Market Revenue Million Forecast, by Country 2020 & 2033
- Table 82: Global Battery Raw Materials Market Volume K Tons Forecast, by Country 2020 & 2033
- Table 83: South America Battery Raw Materials Market Revenue (Million) Forecast, by Application 2020 & 2033
- Table 84: South America Battery Raw Materials Market Volume (K Tons) Forecast, by Application 2020 & 2033
- Table 85: Middle East and Africa Battery Raw Materials Market Revenue (Million) Forecast, by Application 2020 & 2033
- Table 86: Middle East and Africa Battery Raw Materials Market Volume (K Tons) Forecast, by Application 2020 & 2033
Frequently Asked Questions
1. What is the projected Compound Annual Growth Rate (CAGR) of the Battery Raw Materials Market?
The projected CAGR is approximately 10.62%.
2. Which companies are prominent players in the Battery Raw Materials Market?
Key companies in the market include Targray Technology International Inc, Umicore, Sumitomo Chemical Co Ltd, Asahi Kasei Corporation, Mitsubishi Chemical Corporation, Celgard LLC, BASF SE, ENTEK, Johnson Matthey, ITOCHU Corporation, NICHIA CORPORATION.
3. What are the main segments of the Battery Raw Materials Market?
The market segments include Battery Type, Material, Application.
4. Can you provide details about the market size?
The market size is estimated to be USD 58.70 Million as of 2022.
5. What are some drivers contributing to market growth?
Growing Demand from Consumer Electronics; Rising Application in Automotive Industry.
6. What are the notable trends driving market growth?
Automotive Segment to Dominate the Market.
7. Are there any restraints impacting market growth?
Stringent Safety Regulations for Batteries through Storage and Transportation; Other Restraints.
8. Can you provide examples of recent developments in the market?
January 2024: Iveco Group collaborated with BASF to provide a recycling solution for the lithium-ion batteries. This collaboration is intended to increase the lifetime of the batteries while decreasing their overall environmental impact.
9. What pricing options are available for accessing the report?
Pricing options include single-user, multi-user, and enterprise licenses priced at USD 4750, USD 5250, and USD 8750 respectively.
10. Is the market size provided in terms of value or volume?
The market size is provided in terms of value, measured in Million and volume, measured in K Tons.
11. Are there any specific market keywords associated with the report?
Yes, the market keyword associated with the report is "Battery Raw Materials Market," which aids in identifying and referencing the specific market segment covered.
12. How do I determine which pricing option suits my needs best?
The pricing options vary based on user requirements and access needs. Individual users may opt for single-user licenses, while businesses requiring broader access may choose multi-user or enterprise licenses for cost-effective access to the report.
13. Are there any additional resources or data provided in the Battery Raw Materials Market report?
While the report offers comprehensive insights, it's advisable to review the specific contents or supplementary materials provided to ascertain if additional resources or data are available.
14. How can I stay updated on further developments or reports in the Battery Raw Materials Market?
To stay informed about further developments, trends, and reports in the Battery Raw Materials Market, consider subscribing to industry newsletters, following relevant companies and organizations, or regularly checking reputable industry news sources and publications.
Methodology
Step 1 - Identification of Relevant Samples Size from Population Database


Step 2 - Approaches for Defining Global Market Size (Value, Volume* & Price*)

Note*: In applicable scenarios
Step 3 - Data Sources
Primary Research
- Web Analytics
- Survey Reports
- Research Institute
- Latest Research Reports
- Opinion Leaders
Secondary Research
- Annual Reports
- White Paper
- Latest Press Release
- Industry Association
- Paid Database
- Investor Presentations

Step 4 - Data Triangulation
Involves using different sources of information in order to increase the validity of a study
These sources are likely to be stakeholders in a program - participants, other researchers, program staff, other community members, and so on.
Then we put all data in single framework & apply various statistical tools to find out the dynamic on the market.
During the analysis stage, feedback from the stakeholder groups would be compared to determine areas of agreement as well as areas of divergence