

Key Insights
The bio-based resins market is experiencing significant growth, driven by increasing environmental consciousness and evolving regulatory landscapes favoring sustainable materials over traditional petroleum-based plastics. Projections indicate a robust compound annual growth rate (CAGR) of 9%, with the market size anticipated to reach $1.4 billion by 2025. This expansion is propelled by a growing demand for eco-friendly and biodegradable alternatives across key sectors including packaging, textiles, and consumer goods. Factors such as heightened awareness of plastic pollution, the embrace of circular economy principles, and governmental support for bio-based material adoption are key market accelerators. The versatility of bio-based resins, encompassing starch blends, polylactic acid (PLA), and polyhydroxyalkanoate (PHA), further underpins market growth. Substantial investments in research and development are fostering innovation, leading to enhanced performance and cost-effectiveness in new bio-based resin technologies. Market segmentation highlights a strong trend towards biodegradable packaging solutions, reflecting the urgent global need for sustainable alternatives to conventional plastics. Prominent players like Novamont, Futerro, and Natureworks are leading this transformation with expanded product portfolios and global reach. While North America and Europe currently dominate due to established infrastructure and consumer demand, the Asia-Pacific region is poised for rapid growth driven by its burgeoning industrial sector and commitment to sustainable development.
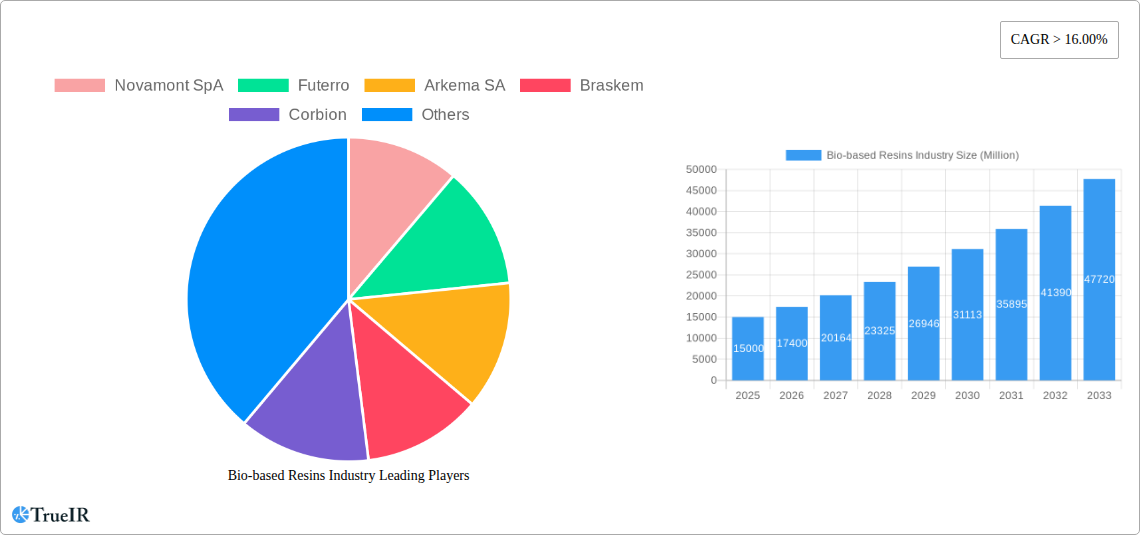
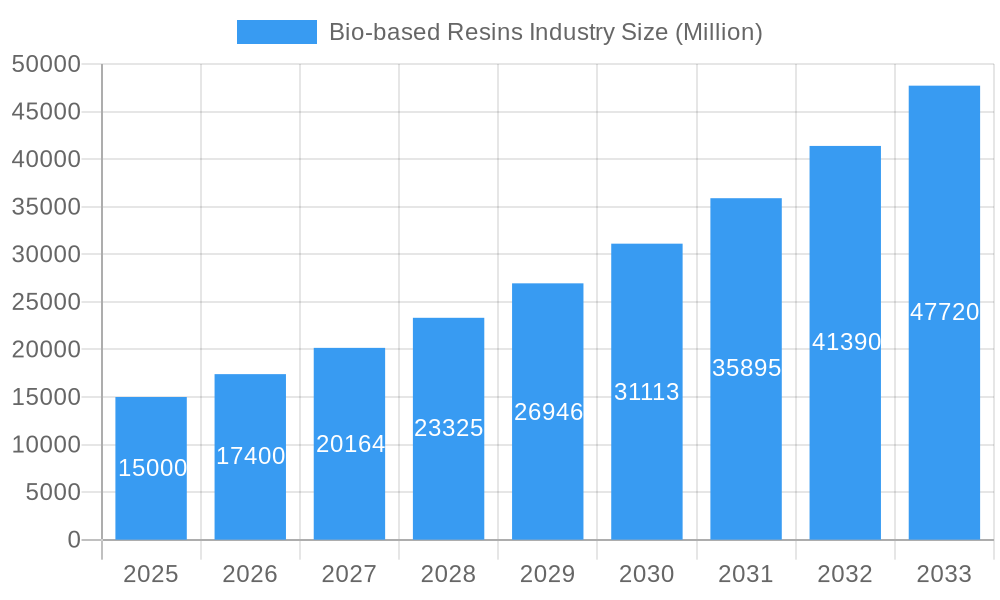
Bio-based Resins Industry Market Size (In Billion)
Despite a positive growth trajectory, the bio-based resins market encounters challenges. Higher production costs relative to conventional petroleum-based resins remain a primary barrier to widespread adoption. Additionally, concerns regarding production scalability, consistency, and potential performance limitations necessitate ongoing advancements. Nevertheless, continuous technological innovation and efforts to improve the properties and reduce the costs of bio-based resins are steadily addressing these hurdles. The long-term outlook for the bio-based resins market remains exceptionally promising, fueled by the global shift towards sustainable materials. Continued expansion is expected, driven by emerging applications and ongoing technological breakthroughs.
Bio-based Resins Industry Company Market Share
Bio-based Resins Market Report: 2019-2033 Forecast
This comprehensive report provides a detailed analysis of the Bio-based Resins industry, offering invaluable insights for stakeholders seeking to navigate this dynamic market. From market sizing and segmentation to competitive landscape analysis and future outlook projections, this report covers all crucial aspects, using the most up-to-date data and expert analysis. The study period covers 2019-2033, with 2025 as the base year and forecast period spanning 2025-2033. The report projects a market value of $XX Million by 2033, showcasing significant growth potential.
Bio-based Resins Industry Market Structure & Competitive Landscape
The bio-based resins market exhibits a moderately concentrated structure, with a few major players holding significant market share. The Herfindahl-Hirschman Index (HHI) for 2025 is estimated at XX, indicating a moderately concentrated market. Innovation is a key driver, with companies constantly developing new bio-based polymers with enhanced properties. Regulatory pressures, particularly those promoting sustainability, significantly influence market growth. Bio-based resins face competition from traditional petroleum-based resins, but their inherent sustainability advantages are fueling market expansion. The market is segmented by various resin types and applications, each with distinct growth trajectories. Mergers and acquisitions (M&A) activity is moderate, with approximately XX M&A deals recorded between 2019 and 2024, valued at approximately $XX Million.
- Key Market Players: Novamont SpA, Futerro, Arkema SA, Braskem, Corbion, BASF SE, Trinseo, Biotec, Yield10 Bioscience Inc, DuPont, Minima, Natureworks LLC, Danimer Scientific.
- Concentration Ratio (CR4): XX% (2025 estimate)
- M&A Activity: Moderate, with increasing focus on expanding product portfolios and geographical reach.
Bio-based Resins Industry Market Trends & Opportunities
The global bio-based resins market is experiencing robust growth, driven by increasing consumer demand for sustainable and eco-friendly materials. The market is projected to witness a Compound Annual Growth Rate (CAGR) of XX% during the forecast period (2025-2033), reaching a value of $XX Million by 2033. This growth is fueled by technological advancements leading to improved bio-based resin properties and cost reductions, alongside evolving consumer preferences that prioritize environmentally conscious product choices. The market penetration rate for bio-based resins in key application areas is steadily increasing, driven by supportive government policies and regulations. Competitive dynamics are intense, with companies investing heavily in research and development to differentiate their offerings and capture market share. This includes strategic partnerships, collaborations, and capacity expansions.
Dominant Markets & Segments in Bio-based Resins Industry
The Packaging segment currently dominates the bio-based resins market, followed by the Consumer Goods and Automotive sectors. Geographically, North America and Europe are currently the leading regions, propelled by strong environmental regulations and consumer awareness. Asia-Pacific is expected to show the fastest growth in the coming years.
Leading Segments (by Type):
- Polylactic Acid (PLA): High growth due to versatility and biodegradability.
- Bio-polyethylene (Bio-PE): Increasing demand driven by its performance characteristics and application in films.
Leading Segments (by Application):
- Packaging: Strong demand for sustainable alternatives to traditional plastics.
- Consumer Goods: Growing use in various products due to eco-friendly attributes.
Key Growth Drivers:
- Stringent environmental regulations: Driving the shift towards sustainable materials.
- Growing consumer awareness: Increased demand for eco-friendly products.
- Technological advancements: Improving the performance and cost-effectiveness of bio-based resins.
Bio-based Resins Industry Product Analysis
Bio-based resin innovation focuses on improving material properties like strength, flexibility, and heat resistance to compete with conventional plastics. New applications are constantly emerging, driven by advancements in bio-based resin formulations and processing technologies. Key competitive advantages include biodegradability, compostability, and reduced carbon footprint. Market fit is largely determined by the specific application and cost-performance trade-offs compared to conventional counterparts. Products are increasingly tailored to meet specific end-use requirements across sectors such as packaging and consumer goods.
Key Drivers, Barriers & Challenges in Bio-based Resins Industry
Key Drivers:
- Increasing demand for sustainable materials from various end-use industries.
- Government support through subsidies and tax incentives for bio-based products.
- Technological advancements leading to improved performance and cost-effectiveness.
Challenges & Restraints:
- Higher production costs compared to traditional petroleum-based resins.
- Limited availability of feedstock for certain bio-based resins.
- Potential scalability challenges for large-scale commercial production. A XX% increase in feedstock cost can lead to a YY% increase in final product cost.
Growth Drivers in the Bio-based Resins Industry Market
Growth is driven by stringent environmental regulations pushing towards sustainable solutions, increasing consumer demand for eco-friendly products, and continued technological progress that enhances product performance and reduces costs. Government policies, like subsidies and tax breaks, are accelerating adoption across multiple sectors.
Challenges Impacting Bio-based Resins Industry Growth
Challenges include higher production costs compared to petroleum-based resins, the need for consistent and reliable feedstock supply, and competition from existing well-established petrochemical industries. Regulatory complexities and scaling up production to meet growing demand also pose significant hurdles.
Key Players Shaping the Bio-based Resins Industry Market
Significant Bio-based Resins Industry Milestones
- 2020: Launch of a new biodegradable PLA resin with enhanced heat resistance by Natureworks LLC.
- 2021: Acquisition of a bio-PE producer by Braskem, expanding its product portfolio.
- 2022: Introduction of new government regulations in Europe promoting the use of bio-based plastics in packaging.
- 2023: Several key players announce major investments in new bio-based resin production facilities.
Future Outlook for Bio-based Resins Industry Market
The bio-based resins market is poised for significant growth, driven by sustained consumer demand for sustainable products and favorable regulatory landscapes. Strategic partnerships and technological advancements will further enhance product offerings, opening up new application areas and driving market expansion. The increasing focus on circular economy principles and the development of innovative recycling technologies will also contribute to the market’s long-term success. The market is expected to maintain a strong growth trajectory throughout the forecast period, with continued market share gains in key application segments and geographical regions.
Bio-based Resins Industry Segmentation
-
1. Type
- 1.1. Biodegradable Starch Blends
- 1.2. Polylactic Acid (PLA)
- 1.3. Bio-polyethylene Terephthalate (Bio-PET)
- 1.4. Polyhydroxyalkanoate (PHA)
- 1.5. Bio-polyethylene (Bio-PE)
- 1.6. Biodegradable Polyesters
- 1.7. Other Types
-
2. Application
-
2.1. Packaging
- 2.1.1. Rigid
- 2.1.2. Flexible
- 2.2. Textiles
- 2.3. Consumer Goods
- 2.4. Automotive and Transportation
- 2.5. Agriculture and Horticulture
- 2.6. Building and Construction
- 2.7. Electrical and Electronics
- 2.8. Other Applications
-
2.1. Packaging
Bio-based Resins Industry Segmentation By Geography
-
1. Asia Pacific
- 1.1. China
- 1.2. India
- 1.3. Japan
- 1.4. South Korea
- 1.5. Rest of Asia Pacific
-
2. North America
- 2.1. United States
- 2.2. Canada
- 2.3. Mexico
-
3. Europe
- 3.1. Germany
- 3.2. United Kingdom
- 3.3. France
- 3.4. Italy
- 3.5. Rest of Europe
-
4. South America
- 4.1. Brazil
- 4.2. Argentina
- 4.3. Rest of South America
- 5. Middle East
-
6. Saudi Arabia
- 6.1. South Africa
- 6.2. Rest of Middle East
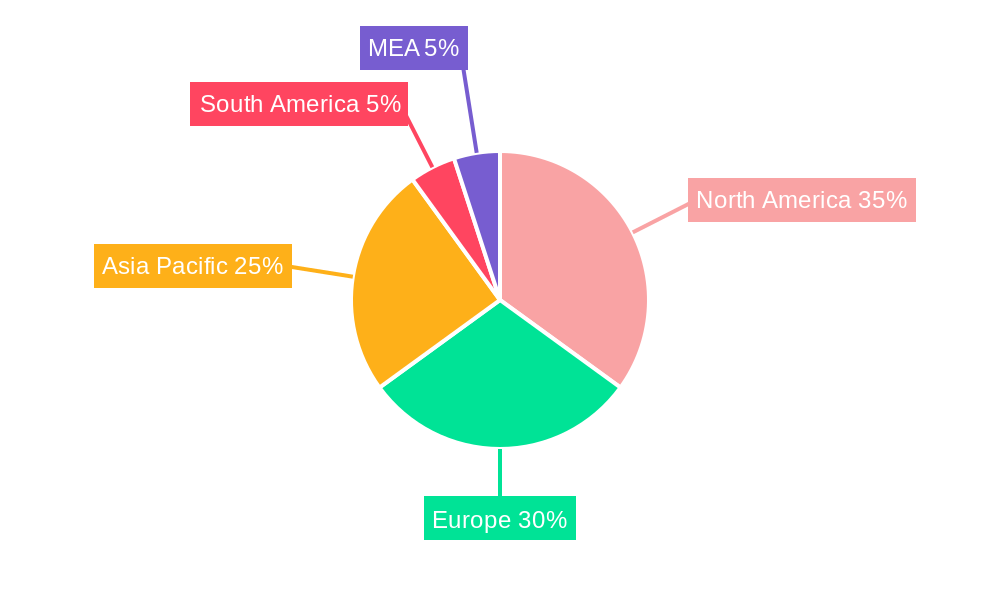
Bio-based Resins Industry Regional Market Share
Geographic Coverage of Bio-based Resins Industry
Bio-based Resins Industry REPORT HIGHLIGHTS
| Aspects | Details |
|---|---|
| Study Period | 2020-2034 |
| Base Year | 2025 |
| Estimated Year | 2026 |
| Forecast Period | 2026-2034 |
| Historical Period | 2020-2025 |
| Growth Rate | CAGR of 9% from 2020-2034 |
| Segmentation |
|
Table of Contents
- 1. Introduction
- 1.1. Research Scope
- 1.2. Market Segmentation
- 1.3. Research Objective
- 1.4. Definitions and Assumptions
- 2. Executive Summary
- 2.1. Market Snapshot
- 3. Market Dynamics
- 3.1. Market Drivers
- 3.2. Market Restrains
- 3.3. Market Trends
- 3.4. Market Opportunities
- 4. Market Factor Analysis
- 4.1. Porters Five Forces
- 4.1.1. Bargaining Power of Suppliers
- 4.1.2. Bargaining Power of Buyers
- 4.1.3. Threat of New Entrants
- 4.1.4. Threat of Substitutes
- 4.1.5. Competitive Rivalry
- 4.2. PESTEL analysis
- 4.3. BCG Analysis
- 4.3.1. Stars (High Growth, High Market Share)
- 4.3.2. Cash Cows (Low Growth, High Market Share)
- 4.3.3. Question Mark (High Growth, Low Market Share)
- 4.3.4. Dogs (Low Growth, Low Market Share)
- 4.4. Ansoff Matrix Analysis
- 4.5. Supply Chain Analysis
- 4.6. Regulatory Landscape
- 4.7. Current Market Potential and Opportunity Assessment (TAM–SAM–SOM Framework)
- 4.8. TIR Analyst Note
- 4.1. Porters Five Forces
- 5. Market Analysis, Insights and Forecast 2021-2033
- 5.1. Market Analysis, Insights and Forecast - by Type
- 5.1.1. Biodegradable Starch Blends
- 5.1.2. Polylactic Acid (PLA)
- 5.1.3. Bio-polyethylene Terephthalate (Bio-PET)
- 5.1.4. Polyhydroxyalkanoate (PHA)
- 5.1.5. Bio-polyethylene (Bio-PE)
- 5.1.6. Biodegradable Polyesters
- 5.1.7. Other Types
- 5.2. Market Analysis, Insights and Forecast - by Application
- 5.2.1. Packaging
- 5.2.1.1. Rigid
- 5.2.1.2. Flexible
- 5.2.2. Textiles
- 5.2.3. Consumer Goods
- 5.2.4. Automotive and Transportation
- 5.2.5. Agriculture and Horticulture
- 5.2.6. Building and Construction
- 5.2.7. Electrical and Electronics
- 5.2.8. Other Applications
- 5.2.1. Packaging
- 5.3. Market Analysis, Insights and Forecast - by Region
- 5.3.1. Asia Pacific
- 5.3.2. North America
- 5.3.3. Europe
- 5.3.4. South America
- 5.3.5. Middle East
- 5.3.6. Saudi Arabia
- 5.1. Market Analysis, Insights and Forecast - by Type
- 6. Global Bio-based Resins Industry Analysis, Insights and Forecast, 2021-2033
- 6.1. Market Analysis, Insights and Forecast - by Type
- 6.1.1. Biodegradable Starch Blends
- 6.1.2. Polylactic Acid (PLA)
- 6.1.3. Bio-polyethylene Terephthalate (Bio-PET)
- 6.1.4. Polyhydroxyalkanoate (PHA)
- 6.1.5. Bio-polyethylene (Bio-PE)
- 6.1.6. Biodegradable Polyesters
- 6.1.7. Other Types
- 6.2. Market Analysis, Insights and Forecast - by Application
- 6.2.1. Packaging
- 6.2.1.1. Rigid
- 6.2.1.2. Flexible
- 6.2.2. Textiles
- 6.2.3. Consumer Goods
- 6.2.4. Automotive and Transportation
- 6.2.5. Agriculture and Horticulture
- 6.2.6. Building and Construction
- 6.2.7. Electrical and Electronics
- 6.2.8. Other Applications
- 6.2.1. Packaging
- 6.1. Market Analysis, Insights and Forecast - by Type
- 7. Asia Pacific Bio-based Resins Industry Analysis, Insights and Forecast, 2020-2032
- 7.1. Market Analysis, Insights and Forecast - by Type
- 7.1.1. Biodegradable Starch Blends
- 7.1.2. Polylactic Acid (PLA)
- 7.1.3. Bio-polyethylene Terephthalate (Bio-PET)
- 7.1.4. Polyhydroxyalkanoate (PHA)
- 7.1.5. Bio-polyethylene (Bio-PE)
- 7.1.6. Biodegradable Polyesters
- 7.1.7. Other Types
- 7.2. Market Analysis, Insights and Forecast - by Application
- 7.2.1. Packaging
- 7.2.1.1. Rigid
- 7.2.1.2. Flexible
- 7.2.2. Textiles
- 7.2.3. Consumer Goods
- 7.2.4. Automotive and Transportation
- 7.2.5. Agriculture and Horticulture
- 7.2.6. Building and Construction
- 7.2.7. Electrical and Electronics
- 7.2.8. Other Applications
- 7.2.1. Packaging
- 7.1. Market Analysis, Insights and Forecast - by Type
- 8. North America Bio-based Resins Industry Analysis, Insights and Forecast, 2020-2032
- 8.1. Market Analysis, Insights and Forecast - by Type
- 8.1.1. Biodegradable Starch Blends
- 8.1.2. Polylactic Acid (PLA)
- 8.1.3. Bio-polyethylene Terephthalate (Bio-PET)
- 8.1.4. Polyhydroxyalkanoate (PHA)
- 8.1.5. Bio-polyethylene (Bio-PE)
- 8.1.6. Biodegradable Polyesters
- 8.1.7. Other Types
- 8.2. Market Analysis, Insights and Forecast - by Application
- 8.2.1. Packaging
- 8.2.1.1. Rigid
- 8.2.1.2. Flexible
- 8.2.2. Textiles
- 8.2.3. Consumer Goods
- 8.2.4. Automotive and Transportation
- 8.2.5. Agriculture and Horticulture
- 8.2.6. Building and Construction
- 8.2.7. Electrical and Electronics
- 8.2.8. Other Applications
- 8.2.1. Packaging
- 8.1. Market Analysis, Insights and Forecast - by Type
- 9. Europe Bio-based Resins Industry Analysis, Insights and Forecast, 2020-2032
- 9.1. Market Analysis, Insights and Forecast - by Type
- 9.1.1. Biodegradable Starch Blends
- 9.1.2. Polylactic Acid (PLA)
- 9.1.3. Bio-polyethylene Terephthalate (Bio-PET)
- 9.1.4. Polyhydroxyalkanoate (PHA)
- 9.1.5. Bio-polyethylene (Bio-PE)
- 9.1.6. Biodegradable Polyesters
- 9.1.7. Other Types
- 9.2. Market Analysis, Insights and Forecast - by Application
- 9.2.1. Packaging
- 9.2.1.1. Rigid
- 9.2.1.2. Flexible
- 9.2.2. Textiles
- 9.2.3. Consumer Goods
- 9.2.4. Automotive and Transportation
- 9.2.5. Agriculture and Horticulture
- 9.2.6. Building and Construction
- 9.2.7. Electrical and Electronics
- 9.2.8. Other Applications
- 9.2.1. Packaging
- 9.1. Market Analysis, Insights and Forecast - by Type
- 10. South America Bio-based Resins Industry Analysis, Insights and Forecast, 2020-2032
- 10.1. Market Analysis, Insights and Forecast - by Type
- 10.1.1. Biodegradable Starch Blends
- 10.1.2. Polylactic Acid (PLA)
- 10.1.3. Bio-polyethylene Terephthalate (Bio-PET)
- 10.1.4. Polyhydroxyalkanoate (PHA)
- 10.1.5. Bio-polyethylene (Bio-PE)
- 10.1.6. Biodegradable Polyesters
- 10.1.7. Other Types
- 10.2. Market Analysis, Insights and Forecast - by Application
- 10.2.1. Packaging
- 10.2.1.1. Rigid
- 10.2.1.2. Flexible
- 10.2.2. Textiles
- 10.2.3. Consumer Goods
- 10.2.4. Automotive and Transportation
- 10.2.5. Agriculture and Horticulture
- 10.2.6. Building and Construction
- 10.2.7. Electrical and Electronics
- 10.2.8. Other Applications
- 10.2.1. Packaging
- 10.1. Market Analysis, Insights and Forecast - by Type
- 11. Middle East Bio-based Resins Industry Analysis, Insights and Forecast, 2020-2032
- 11.1. Market Analysis, Insights and Forecast - by Type
- 11.1.1. Biodegradable Starch Blends
- 11.1.2. Polylactic Acid (PLA)
- 11.1.3. Bio-polyethylene Terephthalate (Bio-PET)
- 11.1.4. Polyhydroxyalkanoate (PHA)
- 11.1.5. Bio-polyethylene (Bio-PE)
- 11.1.6. Biodegradable Polyesters
- 11.1.7. Other Types
- 11.2. Market Analysis, Insights and Forecast - by Application
- 11.2.1. Packaging
- 11.2.1.1. Rigid
- 11.2.1.2. Flexible
- 11.2.2. Textiles
- 11.2.3. Consumer Goods
- 11.2.4. Automotive and Transportation
- 11.2.5. Agriculture and Horticulture
- 11.2.6. Building and Construction
- 11.2.7. Electrical and Electronics
- 11.2.8. Other Applications
- 11.2.1. Packaging
- 11.1. Market Analysis, Insights and Forecast - by Type
- 12. Saudi Arabia Bio-based Resins Industry Analysis, Insights and Forecast, 2020-2032
- 12.1. Market Analysis, Insights and Forecast - by Type
- 12.1.1. Biodegradable Starch Blends
- 12.1.2. Polylactic Acid (PLA)
- 12.1.3. Bio-polyethylene Terephthalate (Bio-PET)
- 12.1.4. Polyhydroxyalkanoate (PHA)
- 12.1.5. Bio-polyethylene (Bio-PE)
- 12.1.6. Biodegradable Polyesters
- 12.1.7. Other Types
- 12.2. Market Analysis, Insights and Forecast - by Application
- 12.2.1. Packaging
- 12.2.1.1. Rigid
- 12.2.1.2. Flexible
- 12.2.2. Textiles
- 12.2.3. Consumer Goods
- 12.2.4. Automotive and Transportation
- 12.2.5. Agriculture and Horticulture
- 12.2.6. Building and Construction
- 12.2.7. Electrical and Electronics
- 12.2.8. Other Applications
- 12.2.1. Packaging
- 12.1. Market Analysis, Insights and Forecast - by Type
- 13. Competitive Analysis
- 13.1. Company Profiles
- 13.1.1 Novamont SpA
- 13.1.1.1. Company Overview
- 13.1.1.2. Products
- 13.1.1.3. Company Financials
- 13.1.1.4. SWOT Analysis
- 13.1.2 Futerro
- 13.1.2.1. Company Overview
- 13.1.2.2. Products
- 13.1.2.3. Company Financials
- 13.1.2.4. SWOT Analysis
- 13.1.3 Arkema SA
- 13.1.3.1. Company Overview
- 13.1.3.2. Products
- 13.1.3.3. Company Financials
- 13.1.3.4. SWOT Analysis
- 13.1.4 Braskem
- 13.1.4.1. Company Overview
- 13.1.4.2. Products
- 13.1.4.3. Company Financials
- 13.1.4.4. SWOT Analysis
- 13.1.5 Corbion
- 13.1.5.1. Company Overview
- 13.1.5.2. Products
- 13.1.5.3. Company Financials
- 13.1.5.4. SWOT Analysis
- 13.1.6 BASF SE
- 13.1.6.1. Company Overview
- 13.1.6.2. Products
- 13.1.6.3. Company Financials
- 13.1.6.4. SWOT Analysis
- 13.1.7 Trinseo
- 13.1.7.1. Company Overview
- 13.1.7.2. Products
- 13.1.7.3. Company Financials
- 13.1.7.4. SWOT Analysis
- 13.1.8 Biotec
- 13.1.8.1. Company Overview
- 13.1.8.2. Products
- 13.1.8.3. Company Financials
- 13.1.8.4. SWOT Analysis
- 13.1.9 Yield10 Bioscience Inc
- 13.1.9.1. Company Overview
- 13.1.9.2. Products
- 13.1.9.3. Company Financials
- 13.1.9.4. SWOT Analysis
- 13.1.10 DuPont
- 13.1.10.1. Company Overview
- 13.1.10.2. Products
- 13.1.10.3. Company Financials
- 13.1.10.4. SWOT Analysis
- 13.1.11 Minima
- 13.1.11.1. Company Overview
- 13.1.11.2. Products
- 13.1.11.3. Company Financials
- 13.1.11.4. SWOT Analysis
- 13.1.12 Natureworks LLC
- 13.1.12.1. Company Overview
- 13.1.12.2. Products
- 13.1.12.3. Company Financials
- 13.1.12.4. SWOT Analysis
- 13.1.13 Danimer Scientific
- 13.1.13.1. Company Overview
- 13.1.13.2. Products
- 13.1.13.3. Company Financials
- 13.1.13.4. SWOT Analysis
- 13.1.1 Novamont SpA
- 13.2. Market Entropy
- 13.2.1 Company's Key Areas Served
- 13.2.2 Recent Developments
- 13.3. Company Market Share Analysis 2025
- 13.3.1 Top 5 Companies Market Share Analysis
- 13.3.2 Top 3 Companies Market Share Analysis
- 13.4. List of Potential Customers
- 14. Research Methodology
List of Figures
- Figure 1: Global Bio-based Resins Industry Revenue Breakdown (billion, %) by Region 2025 & 2033
- Figure 2: Global Bio-based Resins Industry Volume Breakdown (K Tons, %) by Region 2025 & 2033
- Figure 3: Asia Pacific Bio-based Resins Industry Revenue (billion), by Type 2025 & 2033
- Figure 4: Asia Pacific Bio-based Resins Industry Volume (K Tons), by Type 2025 & 2033
- Figure 5: Asia Pacific Bio-based Resins Industry Revenue Share (%), by Type 2025 & 2033
- Figure 6: Asia Pacific Bio-based Resins Industry Volume Share (%), by Type 2025 & 2033
- Figure 7: Asia Pacific Bio-based Resins Industry Revenue (billion), by Application 2025 & 2033
- Figure 8: Asia Pacific Bio-based Resins Industry Volume (K Tons), by Application 2025 & 2033
- Figure 9: Asia Pacific Bio-based Resins Industry Revenue Share (%), by Application 2025 & 2033
- Figure 10: Asia Pacific Bio-based Resins Industry Volume Share (%), by Application 2025 & 2033
- Figure 11: Asia Pacific Bio-based Resins Industry Revenue (billion), by Country 2025 & 2033
- Figure 12: Asia Pacific Bio-based Resins Industry Volume (K Tons), by Country 2025 & 2033
- Figure 13: Asia Pacific Bio-based Resins Industry Revenue Share (%), by Country 2025 & 2033
- Figure 14: Asia Pacific Bio-based Resins Industry Volume Share (%), by Country 2025 & 2033
- Figure 15: North America Bio-based Resins Industry Revenue (billion), by Type 2025 & 2033
- Figure 16: North America Bio-based Resins Industry Volume (K Tons), by Type 2025 & 2033
- Figure 17: North America Bio-based Resins Industry Revenue Share (%), by Type 2025 & 2033
- Figure 18: North America Bio-based Resins Industry Volume Share (%), by Type 2025 & 2033
- Figure 19: North America Bio-based Resins Industry Revenue (billion), by Application 2025 & 2033
- Figure 20: North America Bio-based Resins Industry Volume (K Tons), by Application 2025 & 2033
- Figure 21: North America Bio-based Resins Industry Revenue Share (%), by Application 2025 & 2033
- Figure 22: North America Bio-based Resins Industry Volume Share (%), by Application 2025 & 2033
- Figure 23: North America Bio-based Resins Industry Revenue (billion), by Country 2025 & 2033
- Figure 24: North America Bio-based Resins Industry Volume (K Tons), by Country 2025 & 2033
- Figure 25: North America Bio-based Resins Industry Revenue Share (%), by Country 2025 & 2033
- Figure 26: North America Bio-based Resins Industry Volume Share (%), by Country 2025 & 2033
- Figure 27: Europe Bio-based Resins Industry Revenue (billion), by Type 2025 & 2033
- Figure 28: Europe Bio-based Resins Industry Volume (K Tons), by Type 2025 & 2033
- Figure 29: Europe Bio-based Resins Industry Revenue Share (%), by Type 2025 & 2033
- Figure 30: Europe Bio-based Resins Industry Volume Share (%), by Type 2025 & 2033
- Figure 31: Europe Bio-based Resins Industry Revenue (billion), by Application 2025 & 2033
- Figure 32: Europe Bio-based Resins Industry Volume (K Tons), by Application 2025 & 2033
- Figure 33: Europe Bio-based Resins Industry Revenue Share (%), by Application 2025 & 2033
- Figure 34: Europe Bio-based Resins Industry Volume Share (%), by Application 2025 & 2033
- Figure 35: Europe Bio-based Resins Industry Revenue (billion), by Country 2025 & 2033
- Figure 36: Europe Bio-based Resins Industry Volume (K Tons), by Country 2025 & 2033
- Figure 37: Europe Bio-based Resins Industry Revenue Share (%), by Country 2025 & 2033
- Figure 38: Europe Bio-based Resins Industry Volume Share (%), by Country 2025 & 2033
- Figure 39: South America Bio-based Resins Industry Revenue (billion), by Type 2025 & 2033
- Figure 40: South America Bio-based Resins Industry Volume (K Tons), by Type 2025 & 2033
- Figure 41: South America Bio-based Resins Industry Revenue Share (%), by Type 2025 & 2033
- Figure 42: South America Bio-based Resins Industry Volume Share (%), by Type 2025 & 2033
- Figure 43: South America Bio-based Resins Industry Revenue (billion), by Application 2025 & 2033
- Figure 44: South America Bio-based Resins Industry Volume (K Tons), by Application 2025 & 2033
- Figure 45: South America Bio-based Resins Industry Revenue Share (%), by Application 2025 & 2033
- Figure 46: South America Bio-based Resins Industry Volume Share (%), by Application 2025 & 2033
- Figure 47: South America Bio-based Resins Industry Revenue (billion), by Country 2025 & 2033
- Figure 48: South America Bio-based Resins Industry Volume (K Tons), by Country 2025 & 2033
- Figure 49: South America Bio-based Resins Industry Revenue Share (%), by Country 2025 & 2033
- Figure 50: South America Bio-based Resins Industry Volume Share (%), by Country 2025 & 2033
- Figure 51: Middle East Bio-based Resins Industry Revenue (billion), by Type 2025 & 2033
- Figure 52: Middle East Bio-based Resins Industry Volume (K Tons), by Type 2025 & 2033
- Figure 53: Middle East Bio-based Resins Industry Revenue Share (%), by Type 2025 & 2033
- Figure 54: Middle East Bio-based Resins Industry Volume Share (%), by Type 2025 & 2033
- Figure 55: Middle East Bio-based Resins Industry Revenue (billion), by Application 2025 & 2033
- Figure 56: Middle East Bio-based Resins Industry Volume (K Tons), by Application 2025 & 2033
- Figure 57: Middle East Bio-based Resins Industry Revenue Share (%), by Application 2025 & 2033
- Figure 58: Middle East Bio-based Resins Industry Volume Share (%), by Application 2025 & 2033
- Figure 59: Middle East Bio-based Resins Industry Revenue (billion), by Country 2025 & 2033
- Figure 60: Middle East Bio-based Resins Industry Volume (K Tons), by Country 2025 & 2033
- Figure 61: Middle East Bio-based Resins Industry Revenue Share (%), by Country 2025 & 2033
- Figure 62: Middle East Bio-based Resins Industry Volume Share (%), by Country 2025 & 2033
- Figure 63: Saudi Arabia Bio-based Resins Industry Revenue (billion), by Type 2025 & 2033
- Figure 64: Saudi Arabia Bio-based Resins Industry Volume (K Tons), by Type 2025 & 2033
- Figure 65: Saudi Arabia Bio-based Resins Industry Revenue Share (%), by Type 2025 & 2033
- Figure 66: Saudi Arabia Bio-based Resins Industry Volume Share (%), by Type 2025 & 2033
- Figure 67: Saudi Arabia Bio-based Resins Industry Revenue (billion), by Application 2025 & 2033
- Figure 68: Saudi Arabia Bio-based Resins Industry Volume (K Tons), by Application 2025 & 2033
- Figure 69: Saudi Arabia Bio-based Resins Industry Revenue Share (%), by Application 2025 & 2033
- Figure 70: Saudi Arabia Bio-based Resins Industry Volume Share (%), by Application 2025 & 2033
- Figure 71: Saudi Arabia Bio-based Resins Industry Revenue (billion), by Country 2025 & 2033
- Figure 72: Saudi Arabia Bio-based Resins Industry Volume (K Tons), by Country 2025 & 2033
- Figure 73: Saudi Arabia Bio-based Resins Industry Revenue Share (%), by Country 2025 & 2033
- Figure 74: Saudi Arabia Bio-based Resins Industry Volume Share (%), by Country 2025 & 2033
List of Tables
- Table 1: Global Bio-based Resins Industry Revenue billion Forecast, by Type 2020 & 2033
- Table 2: Global Bio-based Resins Industry Volume K Tons Forecast, by Type 2020 & 2033
- Table 3: Global Bio-based Resins Industry Revenue billion Forecast, by Application 2020 & 2033
- Table 4: Global Bio-based Resins Industry Volume K Tons Forecast, by Application 2020 & 2033
- Table 5: Global Bio-based Resins Industry Revenue billion Forecast, by Region 2020 & 2033
- Table 6: Global Bio-based Resins Industry Volume K Tons Forecast, by Region 2020 & 2033
- Table 7: Global Bio-based Resins Industry Revenue billion Forecast, by Type 2020 & 2033
- Table 8: Global Bio-based Resins Industry Volume K Tons Forecast, by Type 2020 & 2033
- Table 9: Global Bio-based Resins Industry Revenue billion Forecast, by Application 2020 & 2033
- Table 10: Global Bio-based Resins Industry Volume K Tons Forecast, by Application 2020 & 2033
- Table 11: Global Bio-based Resins Industry Revenue billion Forecast, by Country 2020 & 2033
- Table 12: Global Bio-based Resins Industry Volume K Tons Forecast, by Country 2020 & 2033
- Table 13: China Bio-based Resins Industry Revenue (billion) Forecast, by Application 2020 & 2033
- Table 14: China Bio-based Resins Industry Volume (K Tons) Forecast, by Application 2020 & 2033
- Table 15: India Bio-based Resins Industry Revenue (billion) Forecast, by Application 2020 & 2033
- Table 16: India Bio-based Resins Industry Volume (K Tons) Forecast, by Application 2020 & 2033
- Table 17: Japan Bio-based Resins Industry Revenue (billion) Forecast, by Application 2020 & 2033
- Table 18: Japan Bio-based Resins Industry Volume (K Tons) Forecast, by Application 2020 & 2033
- Table 19: South Korea Bio-based Resins Industry Revenue (billion) Forecast, by Application 2020 & 2033
- Table 20: South Korea Bio-based Resins Industry Volume (K Tons) Forecast, by Application 2020 & 2033
- Table 21: Rest of Asia Pacific Bio-based Resins Industry Revenue (billion) Forecast, by Application 2020 & 2033
- Table 22: Rest of Asia Pacific Bio-based Resins Industry Volume (K Tons) Forecast, by Application 2020 & 2033
- Table 23: Global Bio-based Resins Industry Revenue billion Forecast, by Type 2020 & 2033
- Table 24: Global Bio-based Resins Industry Volume K Tons Forecast, by Type 2020 & 2033
- Table 25: Global Bio-based Resins Industry Revenue billion Forecast, by Application 2020 & 2033
- Table 26: Global Bio-based Resins Industry Volume K Tons Forecast, by Application 2020 & 2033
- Table 27: Global Bio-based Resins Industry Revenue billion Forecast, by Country 2020 & 2033
- Table 28: Global Bio-based Resins Industry Volume K Tons Forecast, by Country 2020 & 2033
- Table 29: United States Bio-based Resins Industry Revenue (billion) Forecast, by Application 2020 & 2033
- Table 30: United States Bio-based Resins Industry Volume (K Tons) Forecast, by Application 2020 & 2033
- Table 31: Canada Bio-based Resins Industry Revenue (billion) Forecast, by Application 2020 & 2033
- Table 32: Canada Bio-based Resins Industry Volume (K Tons) Forecast, by Application 2020 & 2033
- Table 33: Mexico Bio-based Resins Industry Revenue (billion) Forecast, by Application 2020 & 2033
- Table 34: Mexico Bio-based Resins Industry Volume (K Tons) Forecast, by Application 2020 & 2033
- Table 35: Global Bio-based Resins Industry Revenue billion Forecast, by Type 2020 & 2033
- Table 36: Global Bio-based Resins Industry Volume K Tons Forecast, by Type 2020 & 2033
- Table 37: Global Bio-based Resins Industry Revenue billion Forecast, by Application 2020 & 2033
- Table 38: Global Bio-based Resins Industry Volume K Tons Forecast, by Application 2020 & 2033
- Table 39: Global Bio-based Resins Industry Revenue billion Forecast, by Country 2020 & 2033
- Table 40: Global Bio-based Resins Industry Volume K Tons Forecast, by Country 2020 & 2033
- Table 41: Germany Bio-based Resins Industry Revenue (billion) Forecast, by Application 2020 & 2033
- Table 42: Germany Bio-based Resins Industry Volume (K Tons) Forecast, by Application 2020 & 2033
- Table 43: United Kingdom Bio-based Resins Industry Revenue (billion) Forecast, by Application 2020 & 2033
- Table 44: United Kingdom Bio-based Resins Industry Volume (K Tons) Forecast, by Application 2020 & 2033
- Table 45: France Bio-based Resins Industry Revenue (billion) Forecast, by Application 2020 & 2033
- Table 46: France Bio-based Resins Industry Volume (K Tons) Forecast, by Application 2020 & 2033
- Table 47: Italy Bio-based Resins Industry Revenue (billion) Forecast, by Application 2020 & 2033
- Table 48: Italy Bio-based Resins Industry Volume (K Tons) Forecast, by Application 2020 & 2033
- Table 49: Rest of Europe Bio-based Resins Industry Revenue (billion) Forecast, by Application 2020 & 2033
- Table 50: Rest of Europe Bio-based Resins Industry Volume (K Tons) Forecast, by Application 2020 & 2033
- Table 51: Global Bio-based Resins Industry Revenue billion Forecast, by Type 2020 & 2033
- Table 52: Global Bio-based Resins Industry Volume K Tons Forecast, by Type 2020 & 2033
- Table 53: Global Bio-based Resins Industry Revenue billion Forecast, by Application 2020 & 2033
- Table 54: Global Bio-based Resins Industry Volume K Tons Forecast, by Application 2020 & 2033
- Table 55: Global Bio-based Resins Industry Revenue billion Forecast, by Country 2020 & 2033
- Table 56: Global Bio-based Resins Industry Volume K Tons Forecast, by Country 2020 & 2033
- Table 57: Brazil Bio-based Resins Industry Revenue (billion) Forecast, by Application 2020 & 2033
- Table 58: Brazil Bio-based Resins Industry Volume (K Tons) Forecast, by Application 2020 & 2033
- Table 59: Argentina Bio-based Resins Industry Revenue (billion) Forecast, by Application 2020 & 2033
- Table 60: Argentina Bio-based Resins Industry Volume (K Tons) Forecast, by Application 2020 & 2033
- Table 61: Rest of South America Bio-based Resins Industry Revenue (billion) Forecast, by Application 2020 & 2033
- Table 62: Rest of South America Bio-based Resins Industry Volume (K Tons) Forecast, by Application 2020 & 2033
- Table 63: Global Bio-based Resins Industry Revenue billion Forecast, by Type 2020 & 2033
- Table 64: Global Bio-based Resins Industry Volume K Tons Forecast, by Type 2020 & 2033
- Table 65: Global Bio-based Resins Industry Revenue billion Forecast, by Application 2020 & 2033
- Table 66: Global Bio-based Resins Industry Volume K Tons Forecast, by Application 2020 & 2033
- Table 67: Global Bio-based Resins Industry Revenue billion Forecast, by Country 2020 & 2033
- Table 68: Global Bio-based Resins Industry Volume K Tons Forecast, by Country 2020 & 2033
- Table 69: Global Bio-based Resins Industry Revenue billion Forecast, by Type 2020 & 2033
- Table 70: Global Bio-based Resins Industry Volume K Tons Forecast, by Type 2020 & 2033
- Table 71: Global Bio-based Resins Industry Revenue billion Forecast, by Application 2020 & 2033
- Table 72: Global Bio-based Resins Industry Volume K Tons Forecast, by Application 2020 & 2033
- Table 73: Global Bio-based Resins Industry Revenue billion Forecast, by Country 2020 & 2033
- Table 74: Global Bio-based Resins Industry Volume K Tons Forecast, by Country 2020 & 2033
- Table 75: South Africa Bio-based Resins Industry Revenue (billion) Forecast, by Application 2020 & 2033
- Table 76: South Africa Bio-based Resins Industry Volume (K Tons) Forecast, by Application 2020 & 2033
- Table 77: Rest of Middle East Bio-based Resins Industry Revenue (billion) Forecast, by Application 2020 & 2033
- Table 78: Rest of Middle East Bio-based Resins Industry Volume (K Tons) Forecast, by Application 2020 & 2033
Frequently Asked Questions
1. What is the projected Compound Annual Growth Rate (CAGR) of the Bio-based Resins Industry?
The projected CAGR is approximately 9%.
2. Which companies are prominent players in the Bio-based Resins Industry?
Key companies in the market include Novamont SpA, Futerro, Arkema SA, Braskem, Corbion, BASF SE, Trinseo, Biotec, Yield10 Bioscience Inc, DuPont, Minima, Natureworks LLC, Danimer Scientific.
3. What are the main segments of the Bio-based Resins Industry?
The market segments include Type, Application.
4. Can you provide details about the market size?
The market size is estimated to be USD 1.4 billion as of 2022.
5. What are some drivers contributing to market growth?
; Environmental Factors Encouraging a Paradigm Shift; Surging Demand for Bioplastics in Flexible Packaging.
6. What are the notable trends driving market growth?
Flexible Packaging Segment to Dominate the Market Demand.
7. Are there any restraints impacting market growth?
; Lack of Awareness and High Cost Association; Availability of Cheaper Alternatives.
8. Can you provide examples of recent developments in the market?
N/A
9. What pricing options are available for accessing the report?
Pricing options include single-user, multi-user, and enterprise licenses priced at USD 4750, USD 5250, and USD 8750 respectively.
10. Is the market size provided in terms of value or volume?
The market size is provided in terms of value, measured in billion and volume, measured in K Tons.
11. Are there any specific market keywords associated with the report?
Yes, the market keyword associated with the report is "Bio-based Resins Industry," which aids in identifying and referencing the specific market segment covered.
12. How do I determine which pricing option suits my needs best?
The pricing options vary based on user requirements and access needs. Individual users may opt for single-user licenses, while businesses requiring broader access may choose multi-user or enterprise licenses for cost-effective access to the report.
13. Are there any additional resources or data provided in the Bio-based Resins Industry report?
While the report offers comprehensive insights, it's advisable to review the specific contents or supplementary materials provided to ascertain if additional resources or data are available.
14. How can I stay updated on further developments or reports in the Bio-based Resins Industry?
To stay informed about further developments, trends, and reports in the Bio-based Resins Industry, consider subscribing to industry newsletters, following relevant companies and organizations, or regularly checking reputable industry news sources and publications.
Methodology
Step 1 - Identification of Relevant Samples Size from Population Database


Step 2 - Approaches for Defining Global Market Size (Value, Volume* & Price*)

Note*: In applicable scenarios
Step 3 - Data Sources
Primary Research
- Web Analytics
- Survey Reports
- Research Institute
- Latest Research Reports
- Opinion Leaders
Secondary Research
- Annual Reports
- White Paper
- Latest Press Release
- Industry Association
- Paid Database
- Investor Presentations

Step 4 - Data Triangulation
Involves using different sources of information in order to increase the validity of a study
These sources are likely to be stakeholders in a program - participants, other researchers, program staff, other community members, and so on.
Then we put all data in single framework & apply various statistical tools to find out the dynamic on the market.
During the analysis stage, feedback from the stakeholder groups would be compared to determine areas of agreement as well as areas of divergence