

Key Insights
The global bioethanol market is projected to reach $66.99 billion by 2025, with an estimated Compound Annual Growth Rate (CAGR) of 11.7% from 2025 to 2033. This substantial growth is propelled by escalating demand for sustainable energy solutions and stringent environmental regulations promoting reduced carbon emissions, particularly in transportation fuels. Growing environmental consciousness and the pursuit of carbon neutrality further bolster market expansion. Bioethanol's versatility, extending beyond fuel to applications in food and beverage, pharmaceuticals, and cosmetics, enhances its market appeal. Technological innovations in production efficiency and cost optimization are also key growth drivers. However, market growth faces challenges from volatile feedstock prices, land-use considerations, and competition from alternative fuels.
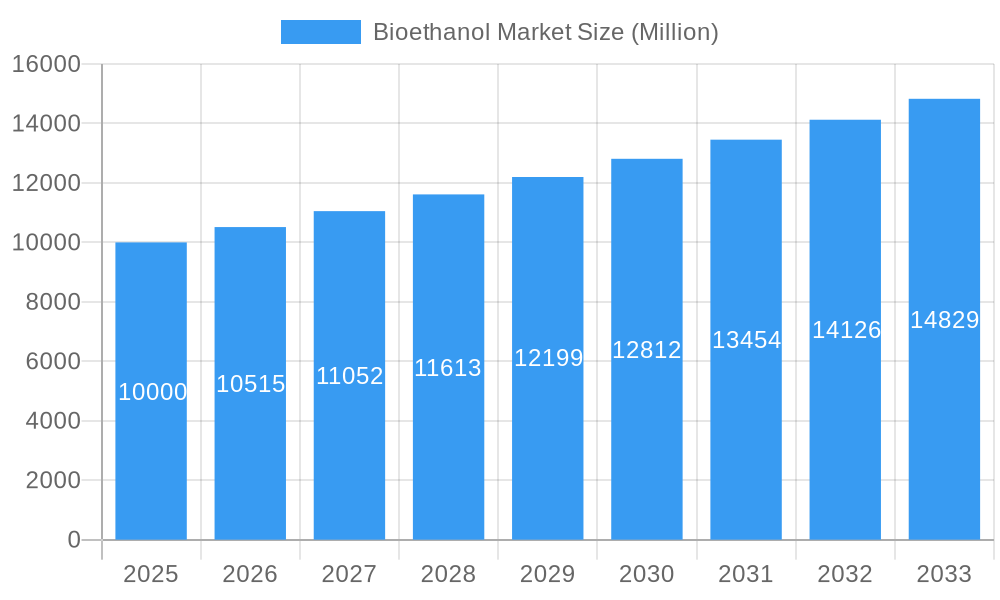
Bioethanol Market Market Size (In Billion)
The market is segmented by feedstock and application. Sugarcane and corn are leading feedstocks, with wheat and other alternatives gaining prominence. The automotive sector dominates bioethanol consumption due to mandated fuel blending, but the food and beverage, pharmaceutical, and cosmetic industries offer significant diversification opportunities. Regionally, the Asia-Pacific market, particularly China and India, shows robust growth driven by economic expansion and favorable government policies. North America and Europe maintain substantial market share, supported by mature bioethanol industries and renewable energy commitments. The competitive landscape features established companies such as ADM and Valero, alongside dynamic regional players.
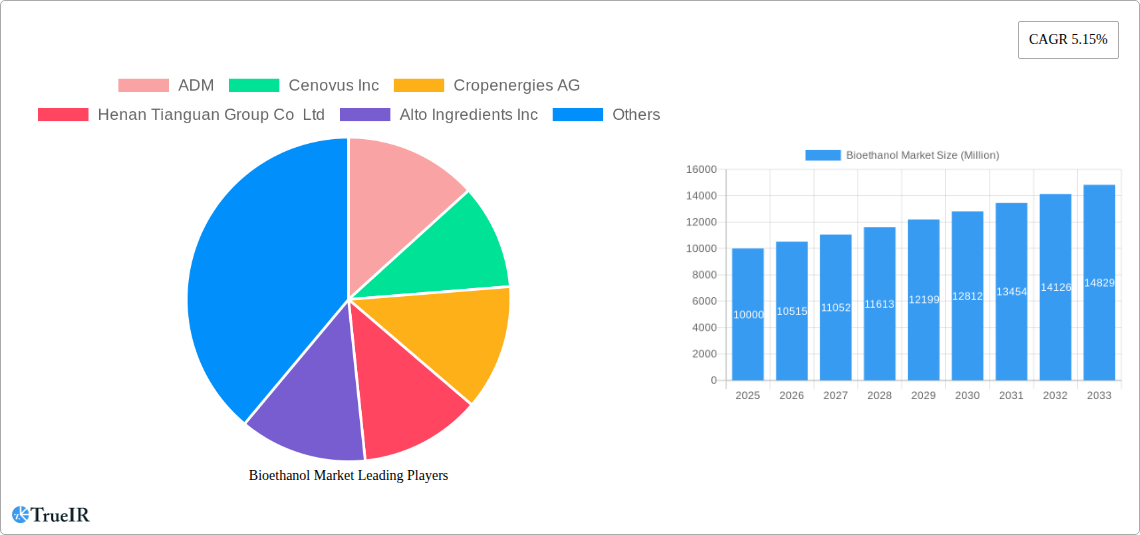
Bioethanol Market Company Market Share
Bioethanol Market Report: A Comprehensive Analysis (2019-2033)
This dynamic report provides a thorough examination of the global bioethanol market, offering invaluable insights for industry stakeholders, investors, and researchers. Leveraging extensive data analysis and expert forecasts, this report covers the historical period (2019-2024), base year (2025), and projects the market's trajectory through 2033. The study encompasses market sizing, segmentation, competitive analysis, and future growth projections, presenting a holistic view of this evolving sector.
Bioethanol Market Structure & Competitive Landscape
The bioethanol market exhibits a moderately concentrated structure, with a few major players commanding significant market share. However, the presence of numerous smaller regional producers and emerging biofuel technologies fosters a dynamic competitive landscape. The market's concentration ratio (CR4) is estimated at xx%, indicating a degree of consolidation. This is influenced by several factors.
- Innovation Drivers: Continuous innovation in feedstock utilization (e.g., cellulosic ethanol) and process efficiency drives competition. Companies are investing heavily in R&D to reduce production costs and improve yields.
- Regulatory Impacts: Government policies, including mandates for biofuel blending and incentives for renewable energy, significantly influence market dynamics. Variations in these policies across regions lead to uneven market growth.
- Product Substitutes: The market faces competition from other renewable fuels (e.g., biodiesel, biogas) and fossil fuels, particularly in the transportation sector. The competitiveness of bioethanol hinges on factors like price parity and sustainability credentials.
- End-User Segmentation: The market is segmented by application, with automotive and transportation currently dominating, followed by food and beverage, and other sectors. The growth of each segment influences overall market expansion.
- M&A Trends: The industry has witnessed a moderate level of mergers and acquisitions (M&A) activity, primarily driven by companies seeking to expand their geographical reach, product portfolios, or technological capabilities. The total value of M&A deals in the past five years is estimated at xx Million.
Bioethanol Market Trends & Opportunities
The global bioethanol market is poised for significant growth over the forecast period (2025-2033), with an estimated Compound Annual Growth Rate (CAGR) of xx%. This growth is fueled by a confluence of factors.
Market size is projected to reach xx Million by 2033 from xx Million in 2025. This expansion is driven by several factors including rising demand for renewable fuels, increasing environmental concerns, and supportive government policies promoting biofuel adoption. Technological advancements, such as the development of advanced biofuels from cellulosic feedstocks, are further enhancing the market's growth potential. Consumer preference for sustainable transportation fuels and the increasing adoption of flexible fuel vehicles also contribute to the positive market outlook. Intense competition amongst existing players will continue to drive innovation and efficiency, leading to further market growth. Market penetration rates vary significantly across regions, with higher rates in countries with established biofuel mandates.
Dominant Markets & Segments in Bioethanol Market
The automotive and transportation segment is currently the dominant application, owing to rising fuel demand and government mandates for biofuel blending. Geographically, xx is a leading market, driven by favorable government policies and readily available feedstock.
Key Growth Drivers:
- Automotive and Transportation: Stringent emission regulations and growing awareness of climate change are driving demand for renewable transportation fuels like bioethanol.
- Feedstock Availability: Regions with abundant corn, sugarcane, or other suitable feedstock enjoy a cost advantage in bioethanol production.
- Government Support: Subsidies, tax incentives, and blending mandates significantly influence market growth in specific regions.
Market Dominance Analysis:
Brazil and the US are currently the largest producers and consumers of bioethanol globally, largely due to significant sugarcane and corn production respectively. However, other regions are experiencing rapid growth as well, driven by increasing energy demands and government incentives. The corn feedstock segment holds the largest market share, followed by sugarcane and others. Growth in the other feedstocks (e.g., wheat, and cellulosic biomass) will also influence the segment dominance.
Bioethanol Market Product Analysis
Technological advancements in bioethanol production are focused on enhancing efficiency, reducing costs, and expanding feedstock options. This includes improving fermentation technologies, developing advanced biofuels from cellulosic sources, and integrating waste streams into the production process. The competitive advantage lies in optimizing the production chain, securing reliable feedstock supplies, and delivering cost-competitive bioethanol. The focus on cellulosic ethanol, particularly, positions companies for greater growth considering the future sustainability demands.
Key Drivers, Barriers & Challenges in Bioethanol Market
Key Drivers:
The bioethanol market is driven by increasing global demand for renewable energy, stringent emission regulations, growing environmental awareness, and favorable government policies promoting biofuel usage. Technological advancements in production methods and the development of more efficient and sustainable feedstocks are further propelling market growth.
Challenges & Restraints:
The bioethanol market faces challenges such as the price volatility of feedstock, competition from fossil fuels and other renewable energy sources, and the high capital investment required for new production facilities. Supply chain disruptions and the need for extensive infrastructure development can also hinder expansion. Moreover, inconsistent government policies across different countries can create uncertainty in the market and slow down investments. For instance, variations in tariffs, subsidies, and renewable portfolio standards (RPS) across various countries create a patchwork of regulatory landscape that challenges a smooth global growth.
Growth Drivers in the Bioethanol Market Market
Technological advancements such as improved fermentation technologies, wider adoption of advanced biofuel production from cellulosic biomass, and development of efficient enzymes leading to increased yields and reduced costs are key growth drivers. Additionally, favorable government policies, including mandates for biofuel blending in transportation fuels, subsidies, and tax incentives for bioethanol production and consumption, greatly support the sector's growth. The increasing consumer preference towards sustainable and environmentally friendly fuels further bolsters market expansion.
Challenges Impacting Bioethanol Market Growth
High feedstock costs and price volatility, especially regarding agricultural commodities like corn and sugarcane, pose a significant challenge. The competition from cheaper fossil fuels and other renewable energy sources also presents a hurdle. Furthermore, the extensive investment needed for new bioethanol production facilities coupled with the limitations of the existing infrastructure can pose limitations in market expansion. Finally, the complexity and inconsistencies of the regulatory environment across different regions can impact investment decisions.
Key Players Shaping the Bioethanol Market Market
- ADM
- Cenovus Inc
- Cropenergies AG
- Henan Tianguan Group Co Ltd
- Alto Ingredients Inc
- Green Plains Inc
- Suncor Energy Inc
- Valero
- Ethanol Technologies
- Verbio Vereinigte Bioenergie AG
- Abengoa
- Granbio Investimentos SA
- Sekab
- Blue Bio Fuels Inc
- Lantmannen
- Tereos
- Cristalco
- Poet LLC
- Jilin Fuel Ethanol Co Ltd
- Raizen
- KWST
Significant Bioethanol Market Industry Milestones
- May 2022: Blue Biofuels Inc. announced advancements in its Cellulose-to-Sugar (CTS) technology, signaling progress towards more efficient cellulosic ethanol production.
- September 2022: CropEnergies AG's investment in Syclus BV highlights the growing interest in utilizing bioethanol for the production of bio-based chemicals.
- January 2023: The joint venture between United Airlines, Tallgrass, Green Plains Inc., and Blue Blade Energy demonstrates the potential of bioethanol as a sustainable aviation fuel (SAF) feedstock. This is a pivotal moment reflecting the industry's expansion into new application areas.
Future Outlook for Bioethanol Market Market
The bioethanol market is expected to witness sustained growth, propelled by increasing demand for renewable fuels, supportive government policies, and technological advancements in production efficiency and feedstock utilization. Strategic partnerships and investments in research and development will play a critical role in shaping the market's future. The expansion into new application areas, like SAF, will also significantly contribute to the long-term potential of the bioethanol market.
Bioethanol Market Segmentation
-
1. Feedstock Type
- 1.1. Sugarcane
- 1.2. Corn
- 1.3. Wheat
- 1.4. Other Feedstock Types
-
2. Application
- 2.1. Automotive and Transportation
- 2.2. Food and Beverage
- 2.3. Pharmaceutical
- 2.4. Cosmetics and Personal Care
- 2.5. Other Applications
Bioethanol Market Segmentation By Geography
-
1. Asia Pacific
- 1.1. China
- 1.2. India
- 1.3. Japan
- 1.4. South Korea
- 1.5. Rest of Asia Pacific
-
2. North America
- 2.1. United States
- 2.2. Canada
- 2.3. Mexico
-
3. Europe
- 3.1. Germany
- 3.2. United Kingdom
- 3.3. France
- 3.4. Italy
- 3.5. Rest of Europe
-
4. South America
- 4.1. Brazil
- 4.2. Argentina
- 4.3. Rest of South America
-
5. Middle East and Africa
- 5.1. Saudi Arabia
- 5.2. South Africa
- 5.3. Rest of Middle East and Africa
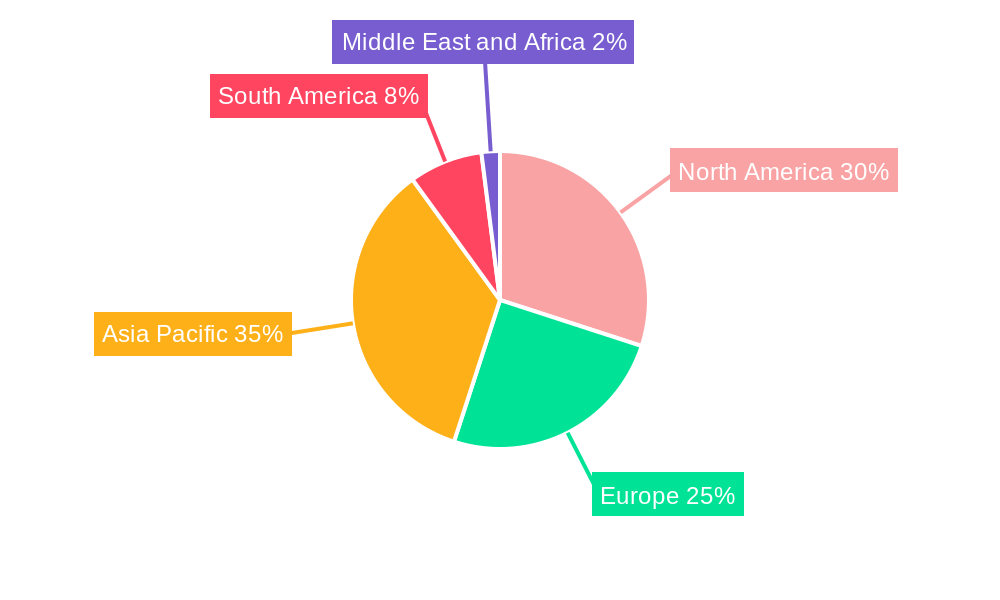
Bioethanol Market Regional Market Share
Geographic Coverage of Bioethanol Market
Bioethanol Market REPORT HIGHLIGHTS
| Aspects | Details |
|---|---|
| Study Period | 2020-2034 |
| Base Year | 2025 |
| Estimated Year | 2026 |
| Forecast Period | 2026-2034 |
| Historical Period | 2020-2025 |
| Growth Rate | CAGR of 11.7% from 2020-2034 |
| Segmentation |
|
Table of Contents
- 1. Introduction
- 1.1. Research Scope
- 1.2. Market Segmentation
- 1.3. Research Objective
- 1.4. Definitions and Assumptions
- 2. Executive Summary
- 2.1. Market Snapshot
- 3. Market Dynamics
- 3.1. Market Drivers
- 3.2. Market Restrains
- 3.3. Market Trends
- 3.4. Market Opportunities
- 4. Market Factor Analysis
- 4.1. Porters Five Forces
- 4.1.1. Bargaining Power of Suppliers
- 4.1.2. Bargaining Power of Buyers
- 4.1.3. Threat of New Entrants
- 4.1.4. Threat of Substitutes
- 4.1.5. Competitive Rivalry
- 4.2. PESTEL analysis
- 4.3. BCG Analysis
- 4.3.1. Stars (High Growth, High Market Share)
- 4.3.2. Cash Cows (Low Growth, High Market Share)
- 4.3.3. Question Mark (High Growth, Low Market Share)
- 4.3.4. Dogs (Low Growth, Low Market Share)
- 4.4. Ansoff Matrix Analysis
- 4.5. Supply Chain Analysis
- 4.6. Regulatory Landscape
- 4.7. Current Market Potential and Opportunity Assessment (TAM–SAM–SOM Framework)
- 4.8. TIR Analyst Note
- 4.1. Porters Five Forces
- 5. Market Analysis, Insights and Forecast 2021-2033
- 5.1. Market Analysis, Insights and Forecast - by Feedstock Type
- 5.1.1. Sugarcane
- 5.1.2. Corn
- 5.1.3. Wheat
- 5.1.4. Other Feedstock Types
- 5.2. Market Analysis, Insights and Forecast - by Application
- 5.2.1. Automotive and Transportation
- 5.2.2. Food and Beverage
- 5.2.3. Pharmaceutical
- 5.2.4. Cosmetics and Personal Care
- 5.2.5. Other Applications
- 5.3. Market Analysis, Insights and Forecast - by Region
- 5.3.1. Asia Pacific
- 5.3.2. North America
- 5.3.3. Europe
- 5.3.4. South America
- 5.3.5. Middle East and Africa
- 5.1. Market Analysis, Insights and Forecast - by Feedstock Type
- 6. Global Bioethanol Market Analysis, Insights and Forecast, 2021-2033
- 6.1. Market Analysis, Insights and Forecast - by Feedstock Type
- 6.1.1. Sugarcane
- 6.1.2. Corn
- 6.1.3. Wheat
- 6.1.4. Other Feedstock Types
- 6.2. Market Analysis, Insights and Forecast - by Application
- 6.2.1. Automotive and Transportation
- 6.2.2. Food and Beverage
- 6.2.3. Pharmaceutical
- 6.2.4. Cosmetics and Personal Care
- 6.2.5. Other Applications
- 6.1. Market Analysis, Insights and Forecast - by Feedstock Type
- 7. Asia Pacific Bioethanol Market Analysis, Insights and Forecast, 2020-2032
- 7.1. Market Analysis, Insights and Forecast - by Feedstock Type
- 7.1.1. Sugarcane
- 7.1.2. Corn
- 7.1.3. Wheat
- 7.1.4. Other Feedstock Types
- 7.2. Market Analysis, Insights and Forecast - by Application
- 7.2.1. Automotive and Transportation
- 7.2.2. Food and Beverage
- 7.2.3. Pharmaceutical
- 7.2.4. Cosmetics and Personal Care
- 7.2.5. Other Applications
- 7.1. Market Analysis, Insights and Forecast - by Feedstock Type
- 8. North America Bioethanol Market Analysis, Insights and Forecast, 2020-2032
- 8.1. Market Analysis, Insights and Forecast - by Feedstock Type
- 8.1.1. Sugarcane
- 8.1.2. Corn
- 8.1.3. Wheat
- 8.1.4. Other Feedstock Types
- 8.2. Market Analysis, Insights and Forecast - by Application
- 8.2.1. Automotive and Transportation
- 8.2.2. Food and Beverage
- 8.2.3. Pharmaceutical
- 8.2.4. Cosmetics and Personal Care
- 8.2.5. Other Applications
- 8.1. Market Analysis, Insights and Forecast - by Feedstock Type
- 9. Europe Bioethanol Market Analysis, Insights and Forecast, 2020-2032
- 9.1. Market Analysis, Insights and Forecast - by Feedstock Type
- 9.1.1. Sugarcane
- 9.1.2. Corn
- 9.1.3. Wheat
- 9.1.4. Other Feedstock Types
- 9.2. Market Analysis, Insights and Forecast - by Application
- 9.2.1. Automotive and Transportation
- 9.2.2. Food and Beverage
- 9.2.3. Pharmaceutical
- 9.2.4. Cosmetics and Personal Care
- 9.2.5. Other Applications
- 9.1. Market Analysis, Insights and Forecast - by Feedstock Type
- 10. South America Bioethanol Market Analysis, Insights and Forecast, 2020-2032
- 10.1. Market Analysis, Insights and Forecast - by Feedstock Type
- 10.1.1. Sugarcane
- 10.1.2. Corn
- 10.1.3. Wheat
- 10.1.4. Other Feedstock Types
- 10.2. Market Analysis, Insights and Forecast - by Application
- 10.2.1. Automotive and Transportation
- 10.2.2. Food and Beverage
- 10.2.3. Pharmaceutical
- 10.2.4. Cosmetics and Personal Care
- 10.2.5. Other Applications
- 10.1. Market Analysis, Insights and Forecast - by Feedstock Type
- 11. Middle East and Africa Bioethanol Market Analysis, Insights and Forecast, 2020-2032
- 11.1. Market Analysis, Insights and Forecast - by Feedstock Type
- 11.1.1. Sugarcane
- 11.1.2. Corn
- 11.1.3. Wheat
- 11.1.4. Other Feedstock Types
- 11.2. Market Analysis, Insights and Forecast - by Application
- 11.2.1. Automotive and Transportation
- 11.2.2. Food and Beverage
- 11.2.3. Pharmaceutical
- 11.2.4. Cosmetics and Personal Care
- 11.2.5. Other Applications
- 11.1. Market Analysis, Insights and Forecast - by Feedstock Type
- 12. Competitive Analysis
- 12.1. Company Profiles
- 12.1.1 ADM
- 12.1.1.1. Company Overview
- 12.1.1.2. Products
- 12.1.1.3. Company Financials
- 12.1.1.4. SWOT Analysis
- 12.1.2 Cenovus Inc
- 12.1.2.1. Company Overview
- 12.1.2.2. Products
- 12.1.2.3. Company Financials
- 12.1.2.4. SWOT Analysis
- 12.1.3 Cropenergies AG
- 12.1.3.1. Company Overview
- 12.1.3.2. Products
- 12.1.3.3. Company Financials
- 12.1.3.4. SWOT Analysis
- 12.1.4 Henan Tianguan Group Co Ltd
- 12.1.4.1. Company Overview
- 12.1.4.2. Products
- 12.1.4.3. Company Financials
- 12.1.4.4. SWOT Analysis
- 12.1.5 Alto Ingredients Inc
- 12.1.5.1. Company Overview
- 12.1.5.2. Products
- 12.1.5.3. Company Financials
- 12.1.5.4. SWOT Analysis
- 12.1.6 Green Plains Inc
- 12.1.6.1. Company Overview
- 12.1.6.2. Products
- 12.1.6.3. Company Financials
- 12.1.6.4. SWOT Analysis
- 12.1.7 Suncor Energy Inc
- 12.1.7.1. Company Overview
- 12.1.7.2. Products
- 12.1.7.3. Company Financials
- 12.1.7.4. SWOT Analysis
- 12.1.8 Valero
- 12.1.8.1. Company Overview
- 12.1.8.2. Products
- 12.1.8.3. Company Financials
- 12.1.8.4. SWOT Analysis
- 12.1.9 Ethanol Technologies
- 12.1.9.1. Company Overview
- 12.1.9.2. Products
- 12.1.9.3. Company Financials
- 12.1.9.4. SWOT Analysis
- 12.1.10 Verbio Vereinigte Bioenergie AG*List Not Exhaustive
- 12.1.10.1. Company Overview
- 12.1.10.2. Products
- 12.1.10.3. Company Financials
- 12.1.10.4. SWOT Analysis
- 12.1.11 Abengoa
- 12.1.11.1. Company Overview
- 12.1.11.2. Products
- 12.1.11.3. Company Financials
- 12.1.11.4. SWOT Analysis
- 12.1.12 Granbio Investimentos SA
- 12.1.12.1. Company Overview
- 12.1.12.2. Products
- 12.1.12.3. Company Financials
- 12.1.12.4. SWOT Analysis
- 12.1.13 Sekab
- 12.1.13.1. Company Overview
- 12.1.13.2. Products
- 12.1.13.3. Company Financials
- 12.1.13.4. SWOT Analysis
- 12.1.14 Blue Bio Fuels Inc
- 12.1.14.1. Company Overview
- 12.1.14.2. Products
- 12.1.14.3. Company Financials
- 12.1.14.4. SWOT Analysis
- 12.1.15 Lantmannen
- 12.1.15.1. Company Overview
- 12.1.15.2. Products
- 12.1.15.3. Company Financials
- 12.1.15.4. SWOT Analysis
- 12.1.16 Tereos
- 12.1.16.1. Company Overview
- 12.1.16.2. Products
- 12.1.16.3. Company Financials
- 12.1.16.4. SWOT Analysis
- 12.1.17 Cristalco
- 12.1.17.1. Company Overview
- 12.1.17.2. Products
- 12.1.17.3. Company Financials
- 12.1.17.4. SWOT Analysis
- 12.1.18 Poet LLC
- 12.1.18.1. Company Overview
- 12.1.18.2. Products
- 12.1.18.3. Company Financials
- 12.1.18.4. SWOT Analysis
- 12.1.19 Jilin Fuel Ethanol Co Ltd
- 12.1.19.1. Company Overview
- 12.1.19.2. Products
- 12.1.19.3. Company Financials
- 12.1.19.4. SWOT Analysis
- 12.1.20 Raizen
- 12.1.20.1. Company Overview
- 12.1.20.2. Products
- 12.1.20.3. Company Financials
- 12.1.20.4. SWOT Analysis
- 12.1.21 KWST
- 12.1.21.1. Company Overview
- 12.1.21.2. Products
- 12.1.21.3. Company Financials
- 12.1.21.4. SWOT Analysis
- 12.1.1 ADM
- 12.2. Market Entropy
- 12.2.1 Company's Key Areas Served
- 12.2.2 Recent Developments
- 12.3. Company Market Share Analysis 2025
- 12.3.1 Top 5 Companies Market Share Analysis
- 12.3.2 Top 3 Companies Market Share Analysis
- 12.4. List of Potential Customers
- 13. Research Methodology
List of Figures
- Figure 1: Global Bioethanol Market Revenue Breakdown (billion, %) by Region 2025 & 2033
- Figure 2: Global Bioethanol Market Volume Breakdown (Billion, %) by Region 2025 & 2033
- Figure 3: Asia Pacific Bioethanol Market Revenue (billion), by Feedstock Type 2025 & 2033
- Figure 4: Asia Pacific Bioethanol Market Volume (Billion), by Feedstock Type 2025 & 2033
- Figure 5: Asia Pacific Bioethanol Market Revenue Share (%), by Feedstock Type 2025 & 2033
- Figure 6: Asia Pacific Bioethanol Market Volume Share (%), by Feedstock Type 2025 & 2033
- Figure 7: Asia Pacific Bioethanol Market Revenue (billion), by Application 2025 & 2033
- Figure 8: Asia Pacific Bioethanol Market Volume (Billion), by Application 2025 & 2033
- Figure 9: Asia Pacific Bioethanol Market Revenue Share (%), by Application 2025 & 2033
- Figure 10: Asia Pacific Bioethanol Market Volume Share (%), by Application 2025 & 2033
- Figure 11: Asia Pacific Bioethanol Market Revenue (billion), by Country 2025 & 2033
- Figure 12: Asia Pacific Bioethanol Market Volume (Billion), by Country 2025 & 2033
- Figure 13: Asia Pacific Bioethanol Market Revenue Share (%), by Country 2025 & 2033
- Figure 14: Asia Pacific Bioethanol Market Volume Share (%), by Country 2025 & 2033
- Figure 15: North America Bioethanol Market Revenue (billion), by Feedstock Type 2025 & 2033
- Figure 16: North America Bioethanol Market Volume (Billion), by Feedstock Type 2025 & 2033
- Figure 17: North America Bioethanol Market Revenue Share (%), by Feedstock Type 2025 & 2033
- Figure 18: North America Bioethanol Market Volume Share (%), by Feedstock Type 2025 & 2033
- Figure 19: North America Bioethanol Market Revenue (billion), by Application 2025 & 2033
- Figure 20: North America Bioethanol Market Volume (Billion), by Application 2025 & 2033
- Figure 21: North America Bioethanol Market Revenue Share (%), by Application 2025 & 2033
- Figure 22: North America Bioethanol Market Volume Share (%), by Application 2025 & 2033
- Figure 23: North America Bioethanol Market Revenue (billion), by Country 2025 & 2033
- Figure 24: North America Bioethanol Market Volume (Billion), by Country 2025 & 2033
- Figure 25: North America Bioethanol Market Revenue Share (%), by Country 2025 & 2033
- Figure 26: North America Bioethanol Market Volume Share (%), by Country 2025 & 2033
- Figure 27: Europe Bioethanol Market Revenue (billion), by Feedstock Type 2025 & 2033
- Figure 28: Europe Bioethanol Market Volume (Billion), by Feedstock Type 2025 & 2033
- Figure 29: Europe Bioethanol Market Revenue Share (%), by Feedstock Type 2025 & 2033
- Figure 30: Europe Bioethanol Market Volume Share (%), by Feedstock Type 2025 & 2033
- Figure 31: Europe Bioethanol Market Revenue (billion), by Application 2025 & 2033
- Figure 32: Europe Bioethanol Market Volume (Billion), by Application 2025 & 2033
- Figure 33: Europe Bioethanol Market Revenue Share (%), by Application 2025 & 2033
- Figure 34: Europe Bioethanol Market Volume Share (%), by Application 2025 & 2033
- Figure 35: Europe Bioethanol Market Revenue (billion), by Country 2025 & 2033
- Figure 36: Europe Bioethanol Market Volume (Billion), by Country 2025 & 2033
- Figure 37: Europe Bioethanol Market Revenue Share (%), by Country 2025 & 2033
- Figure 38: Europe Bioethanol Market Volume Share (%), by Country 2025 & 2033
- Figure 39: South America Bioethanol Market Revenue (billion), by Feedstock Type 2025 & 2033
- Figure 40: South America Bioethanol Market Volume (Billion), by Feedstock Type 2025 & 2033
- Figure 41: South America Bioethanol Market Revenue Share (%), by Feedstock Type 2025 & 2033
- Figure 42: South America Bioethanol Market Volume Share (%), by Feedstock Type 2025 & 2033
- Figure 43: South America Bioethanol Market Revenue (billion), by Application 2025 & 2033
- Figure 44: South America Bioethanol Market Volume (Billion), by Application 2025 & 2033
- Figure 45: South America Bioethanol Market Revenue Share (%), by Application 2025 & 2033
- Figure 46: South America Bioethanol Market Volume Share (%), by Application 2025 & 2033
- Figure 47: South America Bioethanol Market Revenue (billion), by Country 2025 & 2033
- Figure 48: South America Bioethanol Market Volume (Billion), by Country 2025 & 2033
- Figure 49: South America Bioethanol Market Revenue Share (%), by Country 2025 & 2033
- Figure 50: South America Bioethanol Market Volume Share (%), by Country 2025 & 2033
- Figure 51: Middle East and Africa Bioethanol Market Revenue (billion), by Feedstock Type 2025 & 2033
- Figure 52: Middle East and Africa Bioethanol Market Volume (Billion), by Feedstock Type 2025 & 2033
- Figure 53: Middle East and Africa Bioethanol Market Revenue Share (%), by Feedstock Type 2025 & 2033
- Figure 54: Middle East and Africa Bioethanol Market Volume Share (%), by Feedstock Type 2025 & 2033
- Figure 55: Middle East and Africa Bioethanol Market Revenue (billion), by Application 2025 & 2033
- Figure 56: Middle East and Africa Bioethanol Market Volume (Billion), by Application 2025 & 2033
- Figure 57: Middle East and Africa Bioethanol Market Revenue Share (%), by Application 2025 & 2033
- Figure 58: Middle East and Africa Bioethanol Market Volume Share (%), by Application 2025 & 2033
- Figure 59: Middle East and Africa Bioethanol Market Revenue (billion), by Country 2025 & 2033
- Figure 60: Middle East and Africa Bioethanol Market Volume (Billion), by Country 2025 & 2033
- Figure 61: Middle East and Africa Bioethanol Market Revenue Share (%), by Country 2025 & 2033
- Figure 62: Middle East and Africa Bioethanol Market Volume Share (%), by Country 2025 & 2033
List of Tables
- Table 1: Global Bioethanol Market Revenue billion Forecast, by Feedstock Type 2020 & 2033
- Table 2: Global Bioethanol Market Volume Billion Forecast, by Feedstock Type 2020 & 2033
- Table 3: Global Bioethanol Market Revenue billion Forecast, by Application 2020 & 2033
- Table 4: Global Bioethanol Market Volume Billion Forecast, by Application 2020 & 2033
- Table 5: Global Bioethanol Market Revenue billion Forecast, by Region 2020 & 2033
- Table 6: Global Bioethanol Market Volume Billion Forecast, by Region 2020 & 2033
- Table 7: Global Bioethanol Market Revenue billion Forecast, by Feedstock Type 2020 & 2033
- Table 8: Global Bioethanol Market Volume Billion Forecast, by Feedstock Type 2020 & 2033
- Table 9: Global Bioethanol Market Revenue billion Forecast, by Application 2020 & 2033
- Table 10: Global Bioethanol Market Volume Billion Forecast, by Application 2020 & 2033
- Table 11: Global Bioethanol Market Revenue billion Forecast, by Country 2020 & 2033
- Table 12: Global Bioethanol Market Volume Billion Forecast, by Country 2020 & 2033
- Table 13: China Bioethanol Market Revenue (billion) Forecast, by Application 2020 & 2033
- Table 14: China Bioethanol Market Volume (Billion) Forecast, by Application 2020 & 2033
- Table 15: India Bioethanol Market Revenue (billion) Forecast, by Application 2020 & 2033
- Table 16: India Bioethanol Market Volume (Billion) Forecast, by Application 2020 & 2033
- Table 17: Japan Bioethanol Market Revenue (billion) Forecast, by Application 2020 & 2033
- Table 18: Japan Bioethanol Market Volume (Billion) Forecast, by Application 2020 & 2033
- Table 19: South Korea Bioethanol Market Revenue (billion) Forecast, by Application 2020 & 2033
- Table 20: South Korea Bioethanol Market Volume (Billion) Forecast, by Application 2020 & 2033
- Table 21: Rest of Asia Pacific Bioethanol Market Revenue (billion) Forecast, by Application 2020 & 2033
- Table 22: Rest of Asia Pacific Bioethanol Market Volume (Billion) Forecast, by Application 2020 & 2033
- Table 23: Global Bioethanol Market Revenue billion Forecast, by Feedstock Type 2020 & 2033
- Table 24: Global Bioethanol Market Volume Billion Forecast, by Feedstock Type 2020 & 2033
- Table 25: Global Bioethanol Market Revenue billion Forecast, by Application 2020 & 2033
- Table 26: Global Bioethanol Market Volume Billion Forecast, by Application 2020 & 2033
- Table 27: Global Bioethanol Market Revenue billion Forecast, by Country 2020 & 2033
- Table 28: Global Bioethanol Market Volume Billion Forecast, by Country 2020 & 2033
- Table 29: United States Bioethanol Market Revenue (billion) Forecast, by Application 2020 & 2033
- Table 30: United States Bioethanol Market Volume (Billion) Forecast, by Application 2020 & 2033
- Table 31: Canada Bioethanol Market Revenue (billion) Forecast, by Application 2020 & 2033
- Table 32: Canada Bioethanol Market Volume (Billion) Forecast, by Application 2020 & 2033
- Table 33: Mexico Bioethanol Market Revenue (billion) Forecast, by Application 2020 & 2033
- Table 34: Mexico Bioethanol Market Volume (Billion) Forecast, by Application 2020 & 2033
- Table 35: Global Bioethanol Market Revenue billion Forecast, by Feedstock Type 2020 & 2033
- Table 36: Global Bioethanol Market Volume Billion Forecast, by Feedstock Type 2020 & 2033
- Table 37: Global Bioethanol Market Revenue billion Forecast, by Application 2020 & 2033
- Table 38: Global Bioethanol Market Volume Billion Forecast, by Application 2020 & 2033
- Table 39: Global Bioethanol Market Revenue billion Forecast, by Country 2020 & 2033
- Table 40: Global Bioethanol Market Volume Billion Forecast, by Country 2020 & 2033
- Table 41: Germany Bioethanol Market Revenue (billion) Forecast, by Application 2020 & 2033
- Table 42: Germany Bioethanol Market Volume (Billion) Forecast, by Application 2020 & 2033
- Table 43: United Kingdom Bioethanol Market Revenue (billion) Forecast, by Application 2020 & 2033
- Table 44: United Kingdom Bioethanol Market Volume (Billion) Forecast, by Application 2020 & 2033
- Table 45: France Bioethanol Market Revenue (billion) Forecast, by Application 2020 & 2033
- Table 46: France Bioethanol Market Volume (Billion) Forecast, by Application 2020 & 2033
- Table 47: Italy Bioethanol Market Revenue (billion) Forecast, by Application 2020 & 2033
- Table 48: Italy Bioethanol Market Volume (Billion) Forecast, by Application 2020 & 2033
- Table 49: Rest of Europe Bioethanol Market Revenue (billion) Forecast, by Application 2020 & 2033
- Table 50: Rest of Europe Bioethanol Market Volume (Billion) Forecast, by Application 2020 & 2033
- Table 51: Global Bioethanol Market Revenue billion Forecast, by Feedstock Type 2020 & 2033
- Table 52: Global Bioethanol Market Volume Billion Forecast, by Feedstock Type 2020 & 2033
- Table 53: Global Bioethanol Market Revenue billion Forecast, by Application 2020 & 2033
- Table 54: Global Bioethanol Market Volume Billion Forecast, by Application 2020 & 2033
- Table 55: Global Bioethanol Market Revenue billion Forecast, by Country 2020 & 2033
- Table 56: Global Bioethanol Market Volume Billion Forecast, by Country 2020 & 2033
- Table 57: Brazil Bioethanol Market Revenue (billion) Forecast, by Application 2020 & 2033
- Table 58: Brazil Bioethanol Market Volume (Billion) Forecast, by Application 2020 & 2033
- Table 59: Argentina Bioethanol Market Revenue (billion) Forecast, by Application 2020 & 2033
- Table 60: Argentina Bioethanol Market Volume (Billion) Forecast, by Application 2020 & 2033
- Table 61: Rest of South America Bioethanol Market Revenue (billion) Forecast, by Application 2020 & 2033
- Table 62: Rest of South America Bioethanol Market Volume (Billion) Forecast, by Application 2020 & 2033
- Table 63: Global Bioethanol Market Revenue billion Forecast, by Feedstock Type 2020 & 2033
- Table 64: Global Bioethanol Market Volume Billion Forecast, by Feedstock Type 2020 & 2033
- Table 65: Global Bioethanol Market Revenue billion Forecast, by Application 2020 & 2033
- Table 66: Global Bioethanol Market Volume Billion Forecast, by Application 2020 & 2033
- Table 67: Global Bioethanol Market Revenue billion Forecast, by Country 2020 & 2033
- Table 68: Global Bioethanol Market Volume Billion Forecast, by Country 2020 & 2033
- Table 69: Saudi Arabia Bioethanol Market Revenue (billion) Forecast, by Application 2020 & 2033
- Table 70: Saudi Arabia Bioethanol Market Volume (Billion) Forecast, by Application 2020 & 2033
- Table 71: South Africa Bioethanol Market Revenue (billion) Forecast, by Application 2020 & 2033
- Table 72: South Africa Bioethanol Market Volume (Billion) Forecast, by Application 2020 & 2033
- Table 73: Rest of Middle East and Africa Bioethanol Market Revenue (billion) Forecast, by Application 2020 & 2033
- Table 74: Rest of Middle East and Africa Bioethanol Market Volume (Billion) Forecast, by Application 2020 & 2033
Frequently Asked Questions
1. What is the projected Compound Annual Growth Rate (CAGR) of the Bioethanol Market?
The projected CAGR is approximately 11.7%.
2. Which companies are prominent players in the Bioethanol Market?
Key companies in the market include ADM, Cenovus Inc, Cropenergies AG, Henan Tianguan Group Co Ltd, Alto Ingredients Inc, Green Plains Inc, Suncor Energy Inc, Valero, Ethanol Technologies, Verbio Vereinigte Bioenergie AG*List Not Exhaustive, Abengoa, Granbio Investimentos SA, Sekab, Blue Bio Fuels Inc, Lantmannen, Tereos, Cristalco, Poet LLC, Jilin Fuel Ethanol Co Ltd, Raizen, KWST.
3. What are the main segments of the Bioethanol Market?
The market segments include Feedstock Type, Application.
4. Can you provide details about the market size?
The market size is estimated to be USD 66.99 billion as of 2022.
5. What are some drivers contributing to market growth?
Increasing Favorable Initiatives and Blending Mandates by Regulatory Bodies; Rising Environmental Concerns by the Use of Fossil Fuels and Need for the Bio-fuels.
6. What are the notable trends driving market growth?
Increasing Usage in the Automotive and Transportation Sector.
7. Are there any restraints impacting market growth?
Phasing out of Fuel-based Vehicles Due to Rising Demand for Electric Vehicles; Shifting Focus to Bio-butanol.
8. Can you provide examples of recent developments in the market?
January 2023: United Airlines, Tallgrass, and Green Plains Inc. announced a joint venture with Blue Blade Energy to develop and commercialize a novel Sustainable Aviation Fuel (SAF) technology that uses ethanol feedstock.
9. What pricing options are available for accessing the report?
Pricing options include single-user, multi-user, and enterprise licenses priced at USD 4750, USD 5250, and USD 8750 respectively.
10. Is the market size provided in terms of value or volume?
The market size is provided in terms of value, measured in billion and volume, measured in Billion.
11. Are there any specific market keywords associated with the report?
Yes, the market keyword associated with the report is "Bioethanol Market," which aids in identifying and referencing the specific market segment covered.
12. How do I determine which pricing option suits my needs best?
The pricing options vary based on user requirements and access needs. Individual users may opt for single-user licenses, while businesses requiring broader access may choose multi-user or enterprise licenses for cost-effective access to the report.
13. Are there any additional resources or data provided in the Bioethanol Market report?
While the report offers comprehensive insights, it's advisable to review the specific contents or supplementary materials provided to ascertain if additional resources or data are available.
14. How can I stay updated on further developments or reports in the Bioethanol Market?
To stay informed about further developments, trends, and reports in the Bioethanol Market, consider subscribing to industry newsletters, following relevant companies and organizations, or regularly checking reputable industry news sources and publications.
Methodology
Step 1 - Identification of Relevant Samples Size from Population Database


Step 2 - Approaches for Defining Global Market Size (Value, Volume* & Price*)

Note*: In applicable scenarios
Step 3 - Data Sources
Primary Research
- Web Analytics
- Survey Reports
- Research Institute
- Latest Research Reports
- Opinion Leaders
Secondary Research
- Annual Reports
- White Paper
- Latest Press Release
- Industry Association
- Paid Database
- Investor Presentations

Step 4 - Data Triangulation
Involves using different sources of information in order to increase the validity of a study
These sources are likely to be stakeholders in a program - participants, other researchers, program staff, other community members, and so on.
Then we put all data in single framework & apply various statistical tools to find out the dynamic on the market.
During the analysis stage, feedback from the stakeholder groups would be compared to determine areas of agreement as well as areas of divergence