

Key Insights
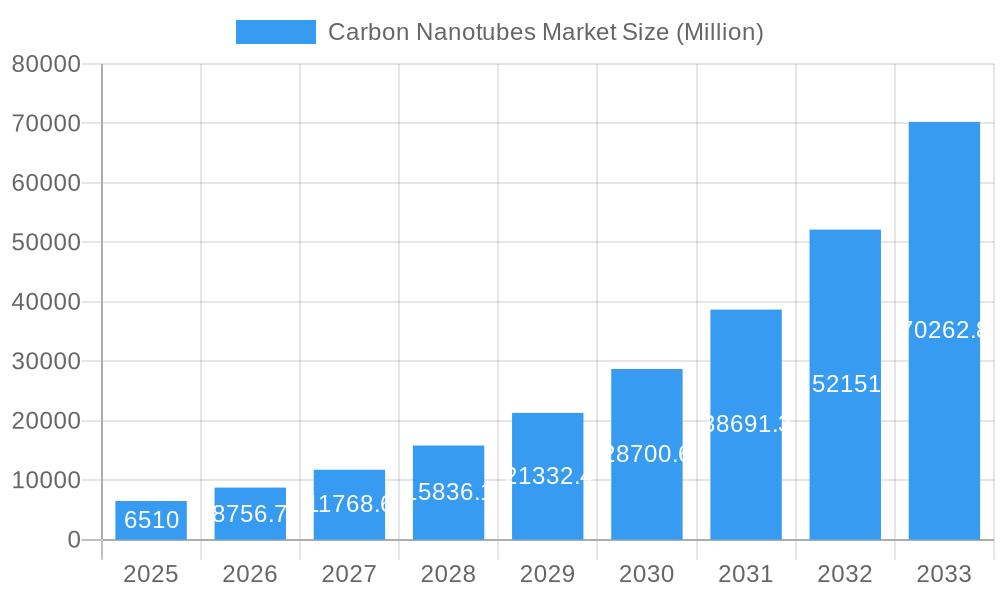
The Carbon Nanotubes (CNTs) market, valued at $6.51 billion in 2025, is experiencing robust growth, projected to expand at a Compound Annual Growth Rate (CAGR) of 34.78% from 2025 to 2033. This explosive growth is fueled by the increasing adoption of CNTs across diverse industries. The electronics sector is a primary driver, leveraging CNTs' exceptional electrical conductivity and high surface area for applications in advanced semiconductors, flexible displays, and energy storage. The aerospace and defense industries are also significant contributors, utilizing CNTs' lightweight yet high-strength properties in composite materials for lighter and more durable aircraft and spacecraft components. Furthermore, the burgeoning automotive sector is integrating CNTs into high-performance batteries and lightweight vehicle parts, contributing to improved fuel efficiency and vehicle performance. The healthcare industry is exploring the use of CNTs in drug delivery systems and biosensors, capitalizing on their biocompatibility and unique structural properties. Growth is also driven by ongoing research and development efforts focused on enhancing CNT production efficiency, improving their dispersion and functionalization, and exploring novel applications. Challenges remain, including the high cost of production and potential health concerns associated with CNT handling, but ongoing innovations are actively addressing these limitations.
Carbon Nanotubes Market Market Size (In Billion)
The market segmentation reveals a significant demand for both Multi-walled Carbon Nanotubes (MWCNTs) and Single-walled Carbon Nanotubes (SWCNTs), with MWCNTs currently holding a larger market share due to their lower production cost. However, the SWCNT segment is expected to witness faster growth due to their superior electrical and mechanical properties, making them attractive for high-performance applications. Geographically, the Asia-Pacific region, particularly China, is expected to dominate the market due to its strong manufacturing base, growing industrialization, and substantial investments in nanotechnology research. North America and Europe are also key markets, driven by robust technological advancements and stringent environmental regulations promoting the use of lightweight and sustainable materials. However, emerging economies in South America and the Middle East and Africa are poised for significant growth in the coming years as they adopt CNT technology across various sectors. The competitive landscape is marked by a mix of established players and emerging companies, fostering innovation and ensuring a dynamic market evolution.
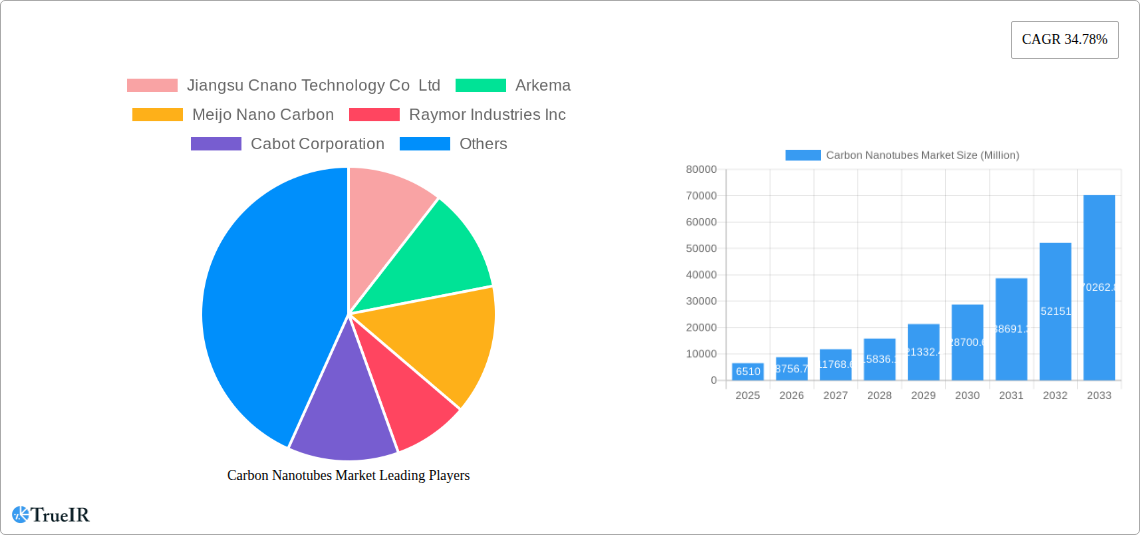
Carbon Nanotubes Market Company Market Share
Carbon Nanotubes Market Report: A Comprehensive Analysis (2019-2033)
This dynamic report provides an in-depth analysis of the Carbon Nanotubes Market, offering invaluable insights for stakeholders across the value chain. Leveraging extensive market research and data analysis from 2019-2024 (historical period), the report projects market trends and opportunities through 2033 (forecast period), with a base year of 2025 and an estimated year of 2025. The study encompasses a detailed segmentation by type (Multi-walled Carbon Nanotubes (MWCNT), Single-walled Carbon Nanotubes (SWCNT), Other Types) and end-user industry (Electronics, Aerospace and Defense, Automotive, Healthcare, Energy, Other End-user Industries), offering a granular view of this rapidly evolving market. The report is optimized for search engines and includes high-volume keywords to enhance visibility and engagement among industry professionals.
Carbon Nanotubes Market Market Structure & Competitive Landscape
The Carbon Nanotubes market is characterized by a moderately concentrated competitive landscape, with several key players dominating the global supply. While precise concentration ratios are proprietary to the full report, analysis reveals a clear trend towards consolidation, driven by both organic growth and mergers and acquisitions (M&A). The total M&A volume in the period 2019-2024 is estimated at xx Million, with a notable increase in activity observed in the last two years. Innovation remains a crucial driver, with companies continuously investing in R&D to improve nanotube production efficiency and expand applications. Stringent regulatory frameworks regarding material safety and environmental impact influence manufacturing practices and market entry. Existing product substitutes, primarily traditional materials like carbon fiber and polymers, face increasing competition due to the superior properties of carbon nanotubes in applications demanding high strength-to-weight ratios and superior conductivity.
- Market Concentration: Moderately concentrated, trending towards consolidation.
- Innovation Drivers: R&D investment in production efficiency and new applications.
- Regulatory Impacts: Stringent safety and environmental regulations impacting manufacturing.
- Product Substitutes: Carbon fiber, polymers; facing increasing competition from CNTs.
- End-User Segmentation: Diverse across electronics, aerospace, automotive, healthcare, and energy.
- M&A Trends: Significant M&A activity in recent years, estimated at xx Million (2019-2024).
Carbon Nanotubes Market Market Trends & Opportunities
The global Carbon Nanotubes market is experiencing robust growth, projected to reach xx Million by 2033, registering a CAGR of xx% during the forecast period (2025-2033). This growth is fueled by several key factors. Technological advancements are continuously improving the quality, yield, and cost-effectiveness of carbon nanotube production. Increased consumer demand for lightweight, high-performance materials in various end-user industries is driving adoption. The competitive landscape is dynamic, with existing players expanding capacities and new entrants emerging, leading to price competition and innovation. Market penetration rates vary significantly across different end-user segments, with electronics and aerospace showing high adoption rates, while others, such as construction and textiles, are poised for significant growth in the coming years. The continued development of novel applications and the ongoing shift towards sustainable materials will further fuel market expansion.
Dominant Markets & Segments in Carbon Nanotubes Market
The Asia-Pacific region, particularly China and South Korea, is currently the dominant market for carbon nanotubes, driven by robust economic growth, significant investments in infrastructure development, and a supportive regulatory environment. The Electronics sector represents the largest end-user segment, fueled by increasing demand for high-performance materials in consumer electronics, computing, and telecommunications. Within the type segment, Multi-walled Carbon Nanotubes (MWCNTs) currently hold the largest market share due to their lower cost and relative ease of production. However, Single-walled Carbon Nanotubes (SWCNTs), offering superior properties, are expected to witness significant growth in the forecast period.
- Key Growth Drivers (Asia-Pacific):
- Strong economic growth and infrastructure development.
- Supportive government policies and incentives.
- Growing domestic demand for advanced materials.
- Key Growth Drivers (Electronics):
- Increasing demand for high-performance materials in electronics and computing.
- Miniaturization of electronic devices.
- Demand for energy-efficient electronics.
- MWCNT Dominance: Currently holds the largest market share due to cost-effectiveness.
- SWCNT Growth Potential: Superior properties driving increased adoption in specialized applications.
Carbon Nanotubes Market Product Analysis
Recent innovations in carbon nanotube technology focus on improving purity, dispersion, and functionalization to enhance their performance characteristics in various applications. The development of advanced synthesis techniques and purification methods has significantly reduced production costs and improved the quality of carbon nanotubes, thereby broadening their applicability across various sectors. Key competitive advantages lie in the unique combination of high strength, electrical conductivity, and thermal conductivity, making them ideal for applications requiring lightweight, high-performance materials. The market is witnessing the introduction of specialized CNT grades tailored to specific applications, further enhancing their competitive edge.
Key Drivers, Barriers & Challenges in Carbon Nanotubes Market
Key Drivers: Technological advancements in synthesis and functionalization, rising demand from electronics and energy sectors, supportive government policies promoting sustainable materials, and increasing investment in R&D. For instance, LG Chem's expansion of CNT production capacity reflects the growing market demand.
Key Challenges: High production costs remain a barrier to widespread adoption, particularly for SWCNTs. Ensuring consistent quality and dispersing CNTs effectively in various matrices also poses challenges. Furthermore, addressing potential health and environmental concerns related to nanotube handling and disposal is crucial for sustained market growth. Supply chain disruptions and geopolitical factors can also impact market stability. The projected impact of these challenges on market growth is estimated at approximately xx Million over the forecast period.
Growth Drivers in the Carbon Nanotubes Market Market
The market is propelled by ongoing technological advancements leading to improved production efficiency and lower costs. Increasing demand from key end-use sectors, such as electronics and energy, fuels growth. Government initiatives promoting sustainable materials and investments in R&D further drive market expansion. The unique properties of CNTs, such as their high strength-to-weight ratio and electrical conductivity, provide a competitive advantage over traditional materials.
Challenges Impacting Carbon Nanotubes Market Growth
High production costs, particularly for SWCNTs, present a barrier to wider adoption. Challenges related to the consistent quality and effective dispersion of CNTs in various matrices exist. Concerns about potential health and environmental impacts require careful management and regulatory compliance. Supply chain disruptions and global economic fluctuations can also significantly impact market growth, potentially reducing the projected market size by xx Million in adverse scenarios.
Key Players Shaping the Carbon Nanotubes Market Market
- Jiangsu Cnano Technology Co Ltd
- Arkema (Arkema)
- Meijo Nano Carbon
- Raymor Industries Inc
- Cabot Corporation (Cabot Corporation)
- Nanocyl SA (Nanocyl SA)
- Showa Denko KK (Resonac Holdings Corporation) (Resonac Holdings Corporation)
- Ocsial (Ocsial)
- Hyperion Catalysis International
- LG Chem (LG Chem)
- Nano-C
- CHASM
- Chengdu Organic Chemicals Co Ltd (Timesnano)
- Kumho Petrochemical
Significant Carbon Nanotubes Market Industry Milestones
May 2023: LG Chem announced the construction of its fourth carbon nanotube (CNT) plant in South Korea, doubling its annual production capacity to 6,100 tons by 2025. This significant expansion underscores the growing demand for CNTs and reinforces LG Chem's commitment to the market.
January 2023: Showa Denko KK and Showa Denko Materials Co., Ltd. merged to form Resonac Holdings Corporation and Resonac Corporation, creating a larger and more integrated player in the carbon nanotube market, potentially leading to increased production and market share.
Future Outlook for Carbon Nanotubes Market Market
The Carbon Nanotubes market is poised for continued robust growth, driven by ongoing technological advancements, expanding applications in key industries, and supportive government policies. Strategic opportunities exist in developing high-performance, cost-effective CNTs and exploring new applications in emerging sectors like flexible electronics and sustainable energy. The market's potential is significant, promising substantial growth in the coming years, with continued innovation and strategic partnerships playing key roles in shaping its future trajectory.
Carbon Nanotubes Market Segmentation
-
1. Type
- 1.1. Multi-walled Carbon Nanotubes (MWCNT)
- 1.2. Single-walled Carbon Nanotubes (SWCNT)
- 1.3. Other Ty
-
2. End-user Industry
- 2.1. Electronics
- 2.2. Aerospace and Defense
- 2.3. Automotive
- 2.4. Healthcare
- 2.5. Energy
- 2.6. Other En
Carbon Nanotubes Market Segmentation By Geography
-
1. Asia Pacific
- 1.1. China
- 1.2. India
- 1.3. Japan
- 1.4. South Korea
- 1.5. Rest of Asia Pacific
-
2. North America
- 2.1. United States
- 2.2. Canada
- 2.3. Mexico
-
3. Europe
- 3.1. Germany
- 3.2. United Kingdom
- 3.3. Italy
- 3.4. France
- 3.5. Spain
- 3.6. Rest of Europe
-
4. South America
- 4.1. Brazil
- 4.2. Argentina
- 4.3. Rest of South America
-
5. Middle East and Africa
- 5.1. Saudi Arabia
- 5.2. South Africa
- 5.3. Rest of Middle East and Africa
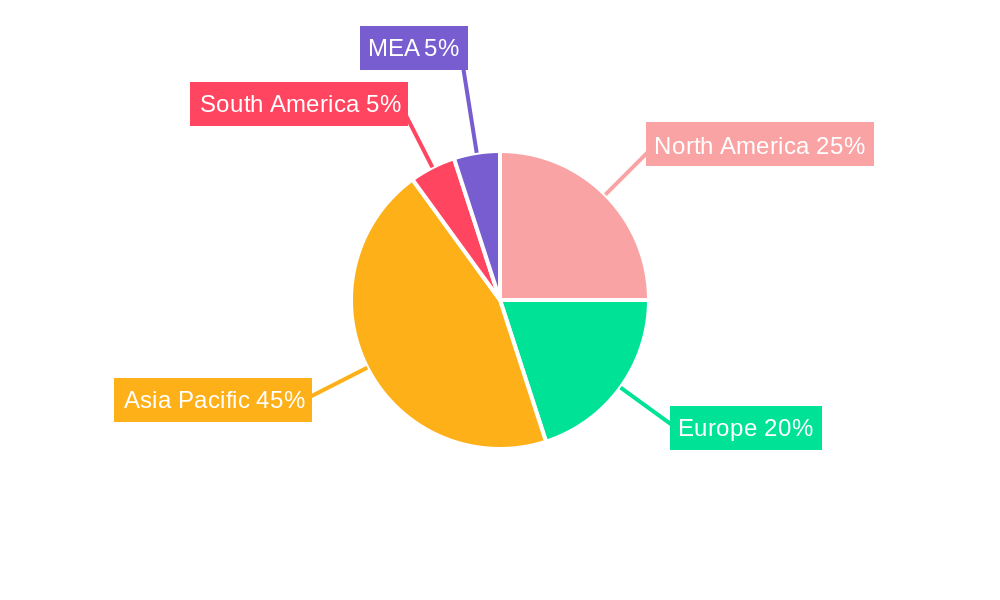
Carbon Nanotubes Market Regional Market Share
Geographic Coverage of Carbon Nanotubes Market
Carbon Nanotubes Market REPORT HIGHLIGHTS
| Aspects | Details |
|---|---|
| Study Period | 2020-2034 |
| Base Year | 2025 |
| Estimated Year | 2026 |
| Forecast Period | 2026-2034 |
| Historical Period | 2020-2025 |
| Growth Rate | CAGR of 34.78% from 2020-2034 |
| Segmentation |
|
Table of Contents
- 1. Introduction
- 1.1. Research Scope
- 1.2. Market Segmentation
- 1.3. Research Objective
- 1.4. Definitions and Assumptions
- 2. Executive Summary
- 2.1. Market Snapshot
- 3. Market Dynamics
- 3.1. Market Drivers
- 3.2. Market Restrains
- 3.3. Market Trends
- 3.4. Market Opportunities
- 4. Market Factor Analysis
- 4.1. Porters Five Forces
- 4.1.1. Bargaining Power of Suppliers
- 4.1.2. Bargaining Power of Buyers
- 4.1.3. Threat of New Entrants
- 4.1.4. Threat of Substitutes
- 4.1.5. Competitive Rivalry
- 4.2. PESTEL analysis
- 4.3. BCG Analysis
- 4.3.1. Stars (High Growth, High Market Share)
- 4.3.2. Cash Cows (Low Growth, High Market Share)
- 4.3.3. Question Mark (High Growth, Low Market Share)
- 4.3.4. Dogs (Low Growth, Low Market Share)
- 4.4. Ansoff Matrix Analysis
- 4.5. Supply Chain Analysis
- 4.6. Regulatory Landscape
- 4.7. Current Market Potential and Opportunity Assessment (TAM–SAM–SOM Framework)
- 4.8. TIR Analyst Note
- 4.1. Porters Five Forces
- 5. Market Analysis, Insights and Forecast 2021-2033
- 5.1. Market Analysis, Insights and Forecast - by Type
- 5.1.1. Multi-walled Carbon Nanotubes (MWCNT)
- 5.1.2. Single-walled Carbon Nanotubes (SWCNT)
- 5.1.3. Other Ty
- 5.2. Market Analysis, Insights and Forecast - by End-user Industry
- 5.2.1. Electronics
- 5.2.2. Aerospace and Defense
- 5.2.3. Automotive
- 5.2.4. Healthcare
- 5.2.5. Energy
- 5.2.6. Other En
- 5.3. Market Analysis, Insights and Forecast - by Region
- 5.3.1. Asia Pacific
- 5.3.2. North America
- 5.3.3. Europe
- 5.3.4. South America
- 5.3.5. Middle East and Africa
- 5.1. Market Analysis, Insights and Forecast - by Type
- 6. Global Carbon Nanotubes Market Analysis, Insights and Forecast, 2021-2033
- 6.1. Market Analysis, Insights and Forecast - by Type
- 6.1.1. Multi-walled Carbon Nanotubes (MWCNT)
- 6.1.2. Single-walled Carbon Nanotubes (SWCNT)
- 6.1.3. Other Ty
- 6.2. Market Analysis, Insights and Forecast - by End-user Industry
- 6.2.1. Electronics
- 6.2.2. Aerospace and Defense
- 6.2.3. Automotive
- 6.2.4. Healthcare
- 6.2.5. Energy
- 6.2.6. Other En
- 6.1. Market Analysis, Insights and Forecast - by Type
- 7. Asia Pacific Carbon Nanotubes Market Analysis, Insights and Forecast, 2020-2032
- 7.1. Market Analysis, Insights and Forecast - by Type
- 7.1.1. Multi-walled Carbon Nanotubes (MWCNT)
- 7.1.2. Single-walled Carbon Nanotubes (SWCNT)
- 7.1.3. Other Ty
- 7.2. Market Analysis, Insights and Forecast - by End-user Industry
- 7.2.1. Electronics
- 7.2.2. Aerospace and Defense
- 7.2.3. Automotive
- 7.2.4. Healthcare
- 7.2.5. Energy
- 7.2.6. Other En
- 7.1. Market Analysis, Insights and Forecast - by Type
- 8. North America Carbon Nanotubes Market Analysis, Insights and Forecast, 2020-2032
- 8.1. Market Analysis, Insights and Forecast - by Type
- 8.1.1. Multi-walled Carbon Nanotubes (MWCNT)
- 8.1.2. Single-walled Carbon Nanotubes (SWCNT)
- 8.1.3. Other Ty
- 8.2. Market Analysis, Insights and Forecast - by End-user Industry
- 8.2.1. Electronics
- 8.2.2. Aerospace and Defense
- 8.2.3. Automotive
- 8.2.4. Healthcare
- 8.2.5. Energy
- 8.2.6. Other En
- 8.1. Market Analysis, Insights and Forecast - by Type
- 9. Europe Carbon Nanotubes Market Analysis, Insights and Forecast, 2020-2032
- 9.1. Market Analysis, Insights and Forecast - by Type
- 9.1.1. Multi-walled Carbon Nanotubes (MWCNT)
- 9.1.2. Single-walled Carbon Nanotubes (SWCNT)
- 9.1.3. Other Ty
- 9.2. Market Analysis, Insights and Forecast - by End-user Industry
- 9.2.1. Electronics
- 9.2.2. Aerospace and Defense
- 9.2.3. Automotive
- 9.2.4. Healthcare
- 9.2.5. Energy
- 9.2.6. Other En
- 9.1. Market Analysis, Insights and Forecast - by Type
- 10. South America Carbon Nanotubes Market Analysis, Insights and Forecast, 2020-2032
- 10.1. Market Analysis, Insights and Forecast - by Type
- 10.1.1. Multi-walled Carbon Nanotubes (MWCNT)
- 10.1.2. Single-walled Carbon Nanotubes (SWCNT)
- 10.1.3. Other Ty
- 10.2. Market Analysis, Insights and Forecast - by End-user Industry
- 10.2.1. Electronics
- 10.2.2. Aerospace and Defense
- 10.2.3. Automotive
- 10.2.4. Healthcare
- 10.2.5. Energy
- 10.2.6. Other En
- 10.1. Market Analysis, Insights and Forecast - by Type
- 11. Middle East and Africa Carbon Nanotubes Market Analysis, Insights and Forecast, 2020-2032
- 11.1. Market Analysis, Insights and Forecast - by Type
- 11.1.1. Multi-walled Carbon Nanotubes (MWCNT)
- 11.1.2. Single-walled Carbon Nanotubes (SWCNT)
- 11.1.3. Other Ty
- 11.2. Market Analysis, Insights and Forecast - by End-user Industry
- 11.2.1. Electronics
- 11.2.2. Aerospace and Defense
- 11.2.3. Automotive
- 11.2.4. Healthcare
- 11.2.5. Energy
- 11.2.6. Other En
- 11.1. Market Analysis, Insights and Forecast - by Type
- 12. Competitive Analysis
- 12.1. Company Profiles
- 12.1.1 Jiangsu Cnano Technology Co Ltd
- 12.1.1.1. Company Overview
- 12.1.1.2. Products
- 12.1.1.3. Company Financials
- 12.1.1.4. SWOT Analysis
- 12.1.2 Arkema
- 12.1.2.1. Company Overview
- 12.1.2.2. Products
- 12.1.2.3. Company Financials
- 12.1.2.4. SWOT Analysis
- 12.1.3 Meijo Nano Carbon
- 12.1.3.1. Company Overview
- 12.1.3.2. Products
- 12.1.3.3. Company Financials
- 12.1.3.4. SWOT Analysis
- 12.1.4 Raymor Industries Inc
- 12.1.4.1. Company Overview
- 12.1.4.2. Products
- 12.1.4.3. Company Financials
- 12.1.4.4. SWOT Analysis
- 12.1.5 Cabot Corporation
- 12.1.5.1. Company Overview
- 12.1.5.2. Products
- 12.1.5.3. Company Financials
- 12.1.5.4. SWOT Analysis
- 12.1.6 Nanocyl SA
- 12.1.6.1. Company Overview
- 12.1.6.2. Products
- 12.1.6.3. Company Financials
- 12.1.6.4. SWOT Analysis
- 12.1.7 Showa Denko KK (Resonac Holdings Corporation)
- 12.1.7.1. Company Overview
- 12.1.7.2. Products
- 12.1.7.3. Company Financials
- 12.1.7.4. SWOT Analysis
- 12.1.8 Ocsial
- 12.1.8.1. Company Overview
- 12.1.8.2. Products
- 12.1.8.3. Company Financials
- 12.1.8.4. SWOT Analysis
- 12.1.9 Hyperion Catalysis International
- 12.1.9.1. Company Overview
- 12.1.9.2. Products
- 12.1.9.3. Company Financials
- 12.1.9.4. SWOT Analysis
- 12.1.10 LG Chem
- 12.1.10.1. Company Overview
- 12.1.10.2. Products
- 12.1.10.3. Company Financials
- 12.1.10.4. SWOT Analysis
- 12.1.11 Nano-C
- 12.1.11.1. Company Overview
- 12.1.11.2. Products
- 12.1.11.3. Company Financials
- 12.1.11.4. SWOT Analysis
- 12.1.12 CHASM
- 12.1.12.1. Company Overview
- 12.1.12.2. Products
- 12.1.12.3. Company Financials
- 12.1.12.4. SWOT Analysis
- 12.1.13 Chengdu Organic Chemicals Co Ltd (Timesnano)
- 12.1.13.1. Company Overview
- 12.1.13.2. Products
- 12.1.13.3. Company Financials
- 12.1.13.4. SWOT Analysis
- 12.1.14 Kumho Petrochemical
- 12.1.14.1. Company Overview
- 12.1.14.2. Products
- 12.1.14.3. Company Financials
- 12.1.14.4. SWOT Analysis
- 12.1.1 Jiangsu Cnano Technology Co Ltd
- 12.2. Market Entropy
- 12.2.1 Company's Key Areas Served
- 12.2.2 Recent Developments
- 12.3. Company Market Share Analysis 2025
- 12.3.1 Top 5 Companies Market Share Analysis
- 12.3.2 Top 3 Companies Market Share Analysis
- 12.4. List of Potential Customers
- 13. Research Methodology
List of Figures
- Figure 1: Global Carbon Nanotubes Market Revenue Breakdown (Million, %) by Region 2025 & 2033
- Figure 2: Global Carbon Nanotubes Market Volume Breakdown (K Tons, %) by Region 2025 & 2033
- Figure 3: Asia Pacific Carbon Nanotubes Market Revenue (Million), by Type 2025 & 2033
- Figure 4: Asia Pacific Carbon Nanotubes Market Volume (K Tons), by Type 2025 & 2033
- Figure 5: Asia Pacific Carbon Nanotubes Market Revenue Share (%), by Type 2025 & 2033
- Figure 6: Asia Pacific Carbon Nanotubes Market Volume Share (%), by Type 2025 & 2033
- Figure 7: Asia Pacific Carbon Nanotubes Market Revenue (Million), by End-user Industry 2025 & 2033
- Figure 8: Asia Pacific Carbon Nanotubes Market Volume (K Tons), by End-user Industry 2025 & 2033
- Figure 9: Asia Pacific Carbon Nanotubes Market Revenue Share (%), by End-user Industry 2025 & 2033
- Figure 10: Asia Pacific Carbon Nanotubes Market Volume Share (%), by End-user Industry 2025 & 2033
- Figure 11: Asia Pacific Carbon Nanotubes Market Revenue (Million), by Country 2025 & 2033
- Figure 12: Asia Pacific Carbon Nanotubes Market Volume (K Tons), by Country 2025 & 2033
- Figure 13: Asia Pacific Carbon Nanotubes Market Revenue Share (%), by Country 2025 & 2033
- Figure 14: Asia Pacific Carbon Nanotubes Market Volume Share (%), by Country 2025 & 2033
- Figure 15: North America Carbon Nanotubes Market Revenue (Million), by Type 2025 & 2033
- Figure 16: North America Carbon Nanotubes Market Volume (K Tons), by Type 2025 & 2033
- Figure 17: North America Carbon Nanotubes Market Revenue Share (%), by Type 2025 & 2033
- Figure 18: North America Carbon Nanotubes Market Volume Share (%), by Type 2025 & 2033
- Figure 19: North America Carbon Nanotubes Market Revenue (Million), by End-user Industry 2025 & 2033
- Figure 20: North America Carbon Nanotubes Market Volume (K Tons), by End-user Industry 2025 & 2033
- Figure 21: North America Carbon Nanotubes Market Revenue Share (%), by End-user Industry 2025 & 2033
- Figure 22: North America Carbon Nanotubes Market Volume Share (%), by End-user Industry 2025 & 2033
- Figure 23: North America Carbon Nanotubes Market Revenue (Million), by Country 2025 & 2033
- Figure 24: North America Carbon Nanotubes Market Volume (K Tons), by Country 2025 & 2033
- Figure 25: North America Carbon Nanotubes Market Revenue Share (%), by Country 2025 & 2033
- Figure 26: North America Carbon Nanotubes Market Volume Share (%), by Country 2025 & 2033
- Figure 27: Europe Carbon Nanotubes Market Revenue (Million), by Type 2025 & 2033
- Figure 28: Europe Carbon Nanotubes Market Volume (K Tons), by Type 2025 & 2033
- Figure 29: Europe Carbon Nanotubes Market Revenue Share (%), by Type 2025 & 2033
- Figure 30: Europe Carbon Nanotubes Market Volume Share (%), by Type 2025 & 2033
- Figure 31: Europe Carbon Nanotubes Market Revenue (Million), by End-user Industry 2025 & 2033
- Figure 32: Europe Carbon Nanotubes Market Volume (K Tons), by End-user Industry 2025 & 2033
- Figure 33: Europe Carbon Nanotubes Market Revenue Share (%), by End-user Industry 2025 & 2033
- Figure 34: Europe Carbon Nanotubes Market Volume Share (%), by End-user Industry 2025 & 2033
- Figure 35: Europe Carbon Nanotubes Market Revenue (Million), by Country 2025 & 2033
- Figure 36: Europe Carbon Nanotubes Market Volume (K Tons), by Country 2025 & 2033
- Figure 37: Europe Carbon Nanotubes Market Revenue Share (%), by Country 2025 & 2033
- Figure 38: Europe Carbon Nanotubes Market Volume Share (%), by Country 2025 & 2033
- Figure 39: South America Carbon Nanotubes Market Revenue (Million), by Type 2025 & 2033
- Figure 40: South America Carbon Nanotubes Market Volume (K Tons), by Type 2025 & 2033
- Figure 41: South America Carbon Nanotubes Market Revenue Share (%), by Type 2025 & 2033
- Figure 42: South America Carbon Nanotubes Market Volume Share (%), by Type 2025 & 2033
- Figure 43: South America Carbon Nanotubes Market Revenue (Million), by End-user Industry 2025 & 2033
- Figure 44: South America Carbon Nanotubes Market Volume (K Tons), by End-user Industry 2025 & 2033
- Figure 45: South America Carbon Nanotubes Market Revenue Share (%), by End-user Industry 2025 & 2033
- Figure 46: South America Carbon Nanotubes Market Volume Share (%), by End-user Industry 2025 & 2033
- Figure 47: South America Carbon Nanotubes Market Revenue (Million), by Country 2025 & 2033
- Figure 48: South America Carbon Nanotubes Market Volume (K Tons), by Country 2025 & 2033
- Figure 49: South America Carbon Nanotubes Market Revenue Share (%), by Country 2025 & 2033
- Figure 50: South America Carbon Nanotubes Market Volume Share (%), by Country 2025 & 2033
- Figure 51: Middle East and Africa Carbon Nanotubes Market Revenue (Million), by Type 2025 & 2033
- Figure 52: Middle East and Africa Carbon Nanotubes Market Volume (K Tons), by Type 2025 & 2033
- Figure 53: Middle East and Africa Carbon Nanotubes Market Revenue Share (%), by Type 2025 & 2033
- Figure 54: Middle East and Africa Carbon Nanotubes Market Volume Share (%), by Type 2025 & 2033
- Figure 55: Middle East and Africa Carbon Nanotubes Market Revenue (Million), by End-user Industry 2025 & 2033
- Figure 56: Middle East and Africa Carbon Nanotubes Market Volume (K Tons), by End-user Industry 2025 & 2033
- Figure 57: Middle East and Africa Carbon Nanotubes Market Revenue Share (%), by End-user Industry 2025 & 2033
- Figure 58: Middle East and Africa Carbon Nanotubes Market Volume Share (%), by End-user Industry 2025 & 2033
- Figure 59: Middle East and Africa Carbon Nanotubes Market Revenue (Million), by Country 2025 & 2033
- Figure 60: Middle East and Africa Carbon Nanotubes Market Volume (K Tons), by Country 2025 & 2033
- Figure 61: Middle East and Africa Carbon Nanotubes Market Revenue Share (%), by Country 2025 & 2033
- Figure 62: Middle East and Africa Carbon Nanotubes Market Volume Share (%), by Country 2025 & 2033
List of Tables
- Table 1: Global Carbon Nanotubes Market Revenue Million Forecast, by Type 2020 & 2033
- Table 2: Global Carbon Nanotubes Market Volume K Tons Forecast, by Type 2020 & 2033
- Table 3: Global Carbon Nanotubes Market Revenue Million Forecast, by End-user Industry 2020 & 2033
- Table 4: Global Carbon Nanotubes Market Volume K Tons Forecast, by End-user Industry 2020 & 2033
- Table 5: Global Carbon Nanotubes Market Revenue Million Forecast, by Region 2020 & 2033
- Table 6: Global Carbon Nanotubes Market Volume K Tons Forecast, by Region 2020 & 2033
- Table 7: Global Carbon Nanotubes Market Revenue Million Forecast, by Type 2020 & 2033
- Table 8: Global Carbon Nanotubes Market Volume K Tons Forecast, by Type 2020 & 2033
- Table 9: Global Carbon Nanotubes Market Revenue Million Forecast, by End-user Industry 2020 & 2033
- Table 10: Global Carbon Nanotubes Market Volume K Tons Forecast, by End-user Industry 2020 & 2033
- Table 11: Global Carbon Nanotubes Market Revenue Million Forecast, by Country 2020 & 2033
- Table 12: Global Carbon Nanotubes Market Volume K Tons Forecast, by Country 2020 & 2033
- Table 13: China Carbon Nanotubes Market Revenue (Million) Forecast, by Application 2020 & 2033
- Table 14: China Carbon Nanotubes Market Volume (K Tons) Forecast, by Application 2020 & 2033
- Table 15: India Carbon Nanotubes Market Revenue (Million) Forecast, by Application 2020 & 2033
- Table 16: India Carbon Nanotubes Market Volume (K Tons) Forecast, by Application 2020 & 2033
- Table 17: Japan Carbon Nanotubes Market Revenue (Million) Forecast, by Application 2020 & 2033
- Table 18: Japan Carbon Nanotubes Market Volume (K Tons) Forecast, by Application 2020 & 2033
- Table 19: South Korea Carbon Nanotubes Market Revenue (Million) Forecast, by Application 2020 & 2033
- Table 20: South Korea Carbon Nanotubes Market Volume (K Tons) Forecast, by Application 2020 & 2033
- Table 21: Rest of Asia Pacific Carbon Nanotubes Market Revenue (Million) Forecast, by Application 2020 & 2033
- Table 22: Rest of Asia Pacific Carbon Nanotubes Market Volume (K Tons) Forecast, by Application 2020 & 2033
- Table 23: Global Carbon Nanotubes Market Revenue Million Forecast, by Type 2020 & 2033
- Table 24: Global Carbon Nanotubes Market Volume K Tons Forecast, by Type 2020 & 2033
- Table 25: Global Carbon Nanotubes Market Revenue Million Forecast, by End-user Industry 2020 & 2033
- Table 26: Global Carbon Nanotubes Market Volume K Tons Forecast, by End-user Industry 2020 & 2033
- Table 27: Global Carbon Nanotubes Market Revenue Million Forecast, by Country 2020 & 2033
- Table 28: Global Carbon Nanotubes Market Volume K Tons Forecast, by Country 2020 & 2033
- Table 29: United States Carbon Nanotubes Market Revenue (Million) Forecast, by Application 2020 & 2033
- Table 30: United States Carbon Nanotubes Market Volume (K Tons) Forecast, by Application 2020 & 2033
- Table 31: Canada Carbon Nanotubes Market Revenue (Million) Forecast, by Application 2020 & 2033
- Table 32: Canada Carbon Nanotubes Market Volume (K Tons) Forecast, by Application 2020 & 2033
- Table 33: Mexico Carbon Nanotubes Market Revenue (Million) Forecast, by Application 2020 & 2033
- Table 34: Mexico Carbon Nanotubes Market Volume (K Tons) Forecast, by Application 2020 & 2033
- Table 35: Global Carbon Nanotubes Market Revenue Million Forecast, by Type 2020 & 2033
- Table 36: Global Carbon Nanotubes Market Volume K Tons Forecast, by Type 2020 & 2033
- Table 37: Global Carbon Nanotubes Market Revenue Million Forecast, by End-user Industry 2020 & 2033
- Table 38: Global Carbon Nanotubes Market Volume K Tons Forecast, by End-user Industry 2020 & 2033
- Table 39: Global Carbon Nanotubes Market Revenue Million Forecast, by Country 2020 & 2033
- Table 40: Global Carbon Nanotubes Market Volume K Tons Forecast, by Country 2020 & 2033
- Table 41: Germany Carbon Nanotubes Market Revenue (Million) Forecast, by Application 2020 & 2033
- Table 42: Germany Carbon Nanotubes Market Volume (K Tons) Forecast, by Application 2020 & 2033
- Table 43: United Kingdom Carbon Nanotubes Market Revenue (Million) Forecast, by Application 2020 & 2033
- Table 44: United Kingdom Carbon Nanotubes Market Volume (K Tons) Forecast, by Application 2020 & 2033
- Table 45: Italy Carbon Nanotubes Market Revenue (Million) Forecast, by Application 2020 & 2033
- Table 46: Italy Carbon Nanotubes Market Volume (K Tons) Forecast, by Application 2020 & 2033
- Table 47: France Carbon Nanotubes Market Revenue (Million) Forecast, by Application 2020 & 2033
- Table 48: France Carbon Nanotubes Market Volume (K Tons) Forecast, by Application 2020 & 2033
- Table 49: Spain Carbon Nanotubes Market Revenue (Million) Forecast, by Application 2020 & 2033
- Table 50: Spain Carbon Nanotubes Market Volume (K Tons) Forecast, by Application 2020 & 2033
- Table 51: Rest of Europe Carbon Nanotubes Market Revenue (Million) Forecast, by Application 2020 & 2033
- Table 52: Rest of Europe Carbon Nanotubes Market Volume (K Tons) Forecast, by Application 2020 & 2033
- Table 53: Global Carbon Nanotubes Market Revenue Million Forecast, by Type 2020 & 2033
- Table 54: Global Carbon Nanotubes Market Volume K Tons Forecast, by Type 2020 & 2033
- Table 55: Global Carbon Nanotubes Market Revenue Million Forecast, by End-user Industry 2020 & 2033
- Table 56: Global Carbon Nanotubes Market Volume K Tons Forecast, by End-user Industry 2020 & 2033
- Table 57: Global Carbon Nanotubes Market Revenue Million Forecast, by Country 2020 & 2033
- Table 58: Global Carbon Nanotubes Market Volume K Tons Forecast, by Country 2020 & 2033
- Table 59: Brazil Carbon Nanotubes Market Revenue (Million) Forecast, by Application 2020 & 2033
- Table 60: Brazil Carbon Nanotubes Market Volume (K Tons) Forecast, by Application 2020 & 2033
- Table 61: Argentina Carbon Nanotubes Market Revenue (Million) Forecast, by Application 2020 & 2033
- Table 62: Argentina Carbon Nanotubes Market Volume (K Tons) Forecast, by Application 2020 & 2033
- Table 63: Rest of South America Carbon Nanotubes Market Revenue (Million) Forecast, by Application 2020 & 2033
- Table 64: Rest of South America Carbon Nanotubes Market Volume (K Tons) Forecast, by Application 2020 & 2033
- Table 65: Global Carbon Nanotubes Market Revenue Million Forecast, by Type 2020 & 2033
- Table 66: Global Carbon Nanotubes Market Volume K Tons Forecast, by Type 2020 & 2033
- Table 67: Global Carbon Nanotubes Market Revenue Million Forecast, by End-user Industry 2020 & 2033
- Table 68: Global Carbon Nanotubes Market Volume K Tons Forecast, by End-user Industry 2020 & 2033
- Table 69: Global Carbon Nanotubes Market Revenue Million Forecast, by Country 2020 & 2033
- Table 70: Global Carbon Nanotubes Market Volume K Tons Forecast, by Country 2020 & 2033
- Table 71: Saudi Arabia Carbon Nanotubes Market Revenue (Million) Forecast, by Application 2020 & 2033
- Table 72: Saudi Arabia Carbon Nanotubes Market Volume (K Tons) Forecast, by Application 2020 & 2033
- Table 73: South Africa Carbon Nanotubes Market Revenue (Million) Forecast, by Application 2020 & 2033
- Table 74: South Africa Carbon Nanotubes Market Volume (K Tons) Forecast, by Application 2020 & 2033
- Table 75: Rest of Middle East and Africa Carbon Nanotubes Market Revenue (Million) Forecast, by Application 2020 & 2033
- Table 76: Rest of Middle East and Africa Carbon Nanotubes Market Volume (K Tons) Forecast, by Application 2020 & 2033
Frequently Asked Questions
1. What is the projected Compound Annual Growth Rate (CAGR) of the Carbon Nanotubes Market?
The projected CAGR is approximately 34.78%.
2. Which companies are prominent players in the Carbon Nanotubes Market?
Key companies in the market include Jiangsu Cnano Technology Co Ltd, Arkema, Meijo Nano Carbon, Raymor Industries Inc, Cabot Corporation, Nanocyl SA, Showa Denko KK (Resonac Holdings Corporation), Ocsial, Hyperion Catalysis International, LG Chem, Nano-C, CHASM, Chengdu Organic Chemicals Co Ltd (Timesnano), Kumho Petrochemical.
3. What are the main segments of the Carbon Nanotubes Market?
The market segments include Type, End-user Industry.
4. Can you provide details about the market size?
The market size is estimated to be USD 6.51 Million as of 2022.
5. What are some drivers contributing to market growth?
Growing Usage of Carbon Nantotubes in Electric Vehicles; Increasing Demand for Advance Materials in Numerous Applications.
6. What are the notable trends driving market growth?
Energy Segment to Dominate the Market.
7. Are there any restraints impacting market growth?
Environmental Concerns and Health Safety Issues; Other Restraints.
8. Can you provide examples of recent developments in the market?
May 2023: LG CHEM announced the construction of its fourth carbon nanotube (CNT) plant at Daesan, South Korea. The plant is slated for operation in 2025. Through the expansion, the company contributes to doubling LG Chem’s annual CNT production capability to 6,100 tons, strengthening its product portfolio.
9. What pricing options are available for accessing the report?
Pricing options include single-user, multi-user, and enterprise licenses priced at USD 4750, USD 5250, and USD 8750 respectively.
10. Is the market size provided in terms of value or volume?
The market size is provided in terms of value, measured in Million and volume, measured in K Tons.
11. Are there any specific market keywords associated with the report?
Yes, the market keyword associated with the report is "Carbon Nanotubes Market," which aids in identifying and referencing the specific market segment covered.
12. How do I determine which pricing option suits my needs best?
The pricing options vary based on user requirements and access needs. Individual users may opt for single-user licenses, while businesses requiring broader access may choose multi-user or enterprise licenses for cost-effective access to the report.
13. Are there any additional resources or data provided in the Carbon Nanotubes Market report?
While the report offers comprehensive insights, it's advisable to review the specific contents or supplementary materials provided to ascertain if additional resources or data are available.
14. How can I stay updated on further developments or reports in the Carbon Nanotubes Market?
To stay informed about further developments, trends, and reports in the Carbon Nanotubes Market, consider subscribing to industry newsletters, following relevant companies and organizations, or regularly checking reputable industry news sources and publications.
Methodology
Step 1 - Identification of Relevant Samples Size from Population Database


Step 2 - Approaches for Defining Global Market Size (Value, Volume* & Price*)

Note*: In applicable scenarios
Step 3 - Data Sources
Primary Research
- Web Analytics
- Survey Reports
- Research Institute
- Latest Research Reports
- Opinion Leaders
Secondary Research
- Annual Reports
- White Paper
- Latest Press Release
- Industry Association
- Paid Database
- Investor Presentations

Step 4 - Data Triangulation
Involves using different sources of information in order to increase the validity of a study
These sources are likely to be stakeholders in a program - participants, other researchers, program staff, other community members, and so on.
Then we put all data in single framework & apply various statistical tools to find out the dynamic on the market.
During the analysis stage, feedback from the stakeholder groups would be compared to determine areas of agreement as well as areas of divergence