

Key Insights
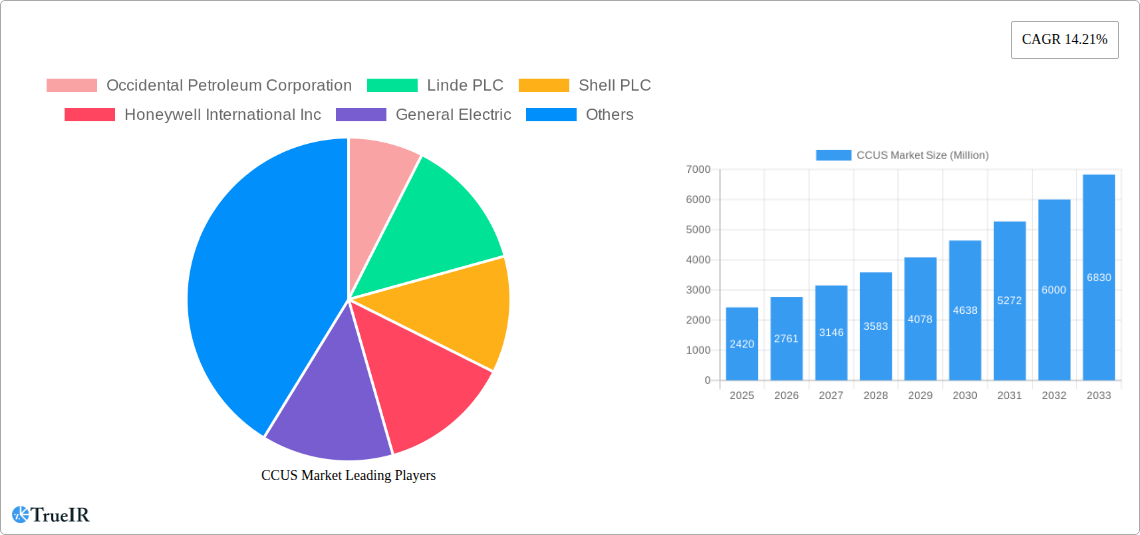
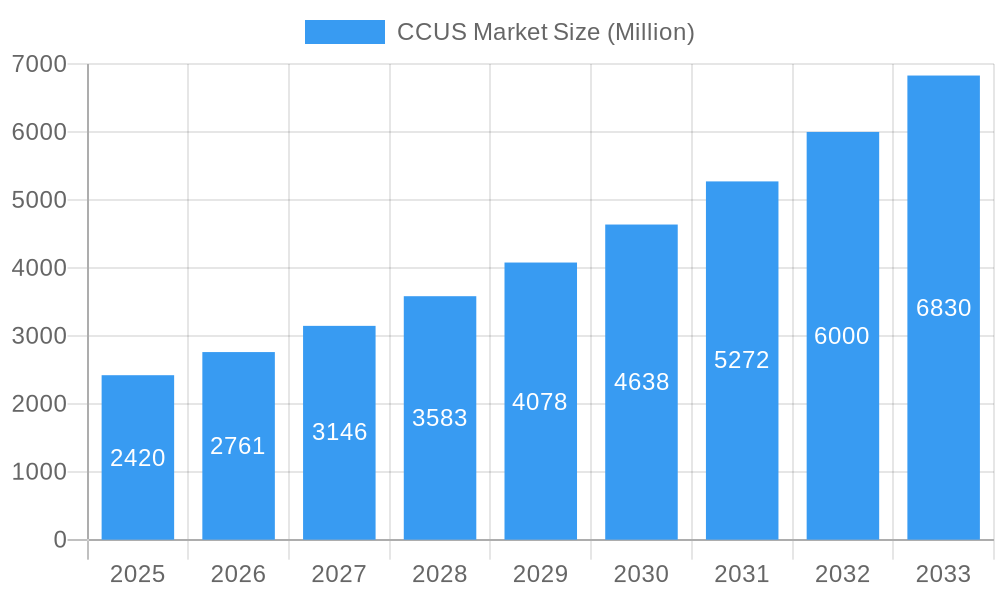
The Carbon Capture, Utilization, and Storage (CCUS) market is experiencing robust growth, projected to reach \$2.42 billion in 2025 and exhibiting a Compound Annual Growth Rate (CAGR) of 14.21% from 2025 to 2033. This expansion is fueled by increasing global concerns about climate change and stringent environmental regulations aimed at reducing greenhouse gas emissions. Key drivers include the growing adoption of renewable energy sources, coupled with a need to manage emissions from hard-to-abate sectors like oil and gas, power generation (coal and biomass), iron and steel, and cement manufacturing. Technological advancements in pre-combustion, oxy-fuel combustion, and post-combustion capture methods are further accelerating market growth. The United States, with its diverse energy landscape and established industrial base, represents a significant regional market, with sub-regions like the Northeast and Southeast showing strong potential due to existing infrastructure and policy support. While high initial capital costs and technological complexities pose challenges, ongoing government incentives, carbon pricing mechanisms, and corporate sustainability initiatives are mitigating these restraints. The market is segmented by end-user industry and technology, with post-combustion capture currently holding the largest market share due to its adaptability to existing power plants. However, pre-combustion and oxy-fuel combustion technologies are gaining traction due to their higher capture efficiency. Leading players like Occidental Petroleum, Linde PLC, Shell PLC, and others are actively investing in research and development, expanding their operational capacities, and forging strategic partnerships to capitalize on this rapidly evolving market.
CCUS Market Market Size (In Billion)
The forecast period of 2025-2033 anticipates continued market expansion, driven by further technological innovations, supportive government policies, and growing corporate commitments to reducing carbon footprints. The ongoing development of carbon utilization technologies, transforming captured CO2 into valuable products, presents a significant opportunity for future growth. The geographic expansion of CCUS projects into emerging markets will also contribute to the market's overall trajectory. However, the successful long-term growth of the CCUS market depends on overcoming the challenges of cost-effectiveness, scalability, and public acceptance. Continuous innovation, policy support, and industry collaboration will be crucial for realizing the full potential of CCUS in mitigating climate change and fostering a sustainable energy future.
CCUS Market Company Market Share
CCUS Market Report: A Comprehensive Analysis (2019-2033)
This dynamic report provides a comprehensive overview of the Carbon Capture, Utilization, and Storage (CCUS) market, offering invaluable insights for investors, industry professionals, and policymakers. We delve into market size, growth projections, technological advancements, competitive landscapes, and key regulatory developments, offering a detailed forecast from 2025 to 2033. The report leverages extensive data from the historical period (2019-2024) and uses 2025 as its base and estimated year. The study period covers 2019-2033.
CCUS Market Structure & Competitive Landscape
The CCUS market is characterized by a moderately concentrated landscape, with several multinational corporations holding significant market share. Key players include Occidental Petroleum Corporation, Linde PLC, Shell PLC, Honeywell International Inc, General Electric, Exxon Mobil Corporation, Japan CCS Co Ltd, SLB, Fluor Corporation, Baker Hughes Company, Halliburton, Aker Solutions, Dakota Gasification Company, JX Nippon Oil & Gas Exploration Corporation, Siemens Energy, Air Liquide, and Mitsubishi Heavy Industries Ltd. However, the list is not exhaustive, and several smaller players are emerging, particularly in niche technologies.
- Market Concentration: The Herfindahl-Hirschman Index (HHI) is estimated at xx, indicating a moderately concentrated market.
- Innovation Drivers: Technological advancements in carbon capture technologies, particularly post-combustion capture and direct air capture, are driving market growth.
- Regulatory Impacts: Stringent environmental regulations globally are pushing adoption of CCUS technologies. Carbon pricing mechanisms and government subsidies are key incentives.
- Product Substitutes: While no direct substitutes for CCUS exist, alternative emission reduction strategies such as renewable energy adoption and energy efficiency improvements represent indirect competition.
- End-user Segmentation: The market is segmented by end-user industry (oil and gas, coal and biomass power plants, iron and steel, chemical, cement) and by technology (pre-combustion, oxy-fuel combustion, post-combustion capture).
- M&A Trends: The past five years have witnessed xx Million in M&A activity, largely driven by established players acquiring smaller technology providers and project developers.
CCUS Market Trends & Opportunities
The global CCUS market is experiencing substantial growth, driven by the increasing urgency to mitigate climate change and meet stringent emission reduction targets. The market size is projected to reach xx Million by 2033, exhibiting a CAGR of xx% during the forecast period (2025-2033). Technological advancements are continuously improving the efficiency and cost-effectiveness of CCUS technologies, making them more attractive to a wider range of industries. Consumer preferences are shifting towards environmentally friendly products and services, further fueling demand for CCUS solutions. This trend is amplified by supportive government policies and incentives. The competitive landscape is dynamic, with companies continuously innovating to enhance their market positions. The increasing integration of CCUS with other clean energy technologies presents significant opportunities for market expansion. Market penetration rates are expected to increase significantly, driven by factors including the growing awareness of climate change and the increasing pressure on industries to reduce their carbon footprint.
Dominant Markets & Segments in CCUS Market
The Oil and Gas sector currently spearheads the CCUS market, holding a substantial market share. However, the Coal and Biomass Power Plant segment is poised for remarkable expansion in the coming years, propelled by increasingly stringent government regulations and attractive incentive schemes. Geographically, North America and Europe continue to lead, representing a significant portion of the global market value. Nevertheless, the Asia-Pacific region is anticipated to experience rapid growth due to accelerating industrialization and a heightened awareness of environmental sustainability.
- Key Growth Drivers (Oil & Gas): Leveraging existing infrastructure, the potential for enhanced oil recovery (EOR) applications, and robust government support for emission reduction initiatives are critical drivers.
- Key Growth Drivers (Coal & Biomass Power Plants): The impetus to comply with rigorous emission regulations, the necessity to meet carbon pricing mechanisms, and the availability of substantial government subsidies are fueling growth in this segment.
- Key Growth Drivers (Asia-Pacific): Rapid industrialization, significant investments in energy infrastructure development, and a growing societal emphasis on environmental protection are the primary catalysts for expansion in this dynamic region.
CCUS Market Product Analysis
Substantial technological advancements are the bedrock of the expanding CCUS market. Innovations are sharply focused on elevating capture efficiency, minimizing energy consumption, and improving the cost-effectiveness of diverse carbon capture and storage (CCS) methodologies. The development of novel materials and sophisticated processes for CO2 separation and transportation represents another pivotal area of innovation. These enhancements are instrumental in facilitating broader adoption across a spectrum of industries and applications, thereby extending the market reach of CCUS products and fortifying their competitive edge.
Key Drivers, Barriers & Challenges in CCUS Market
Key Drivers: Stringent environmental regulations, growing awareness of climate change, the potential for carbon trading and pricing mechanisms, and technological advancements in carbon capture and storage technologies. Government incentives and subsidies are also playing a crucial role in accelerating market growth.
Challenges: High capital costs associated with CCUS projects, technological limitations related to capture efficiency and storage security, potential risks associated with CO2 leakage, and complex regulatory frameworks. Supply chain constraints for specific components and skilled labor shortages are also significant barriers to growth. The limited availability of suitable geological storage sites poses another challenge.
Growth Drivers in the CCUS Market
Technological advancements, supportive government policies, and the increasing pressure to reduce carbon emissions are primary growth drivers. Economies of scale, and the potential to integrate CCUS with other clean energy technologies such as hydrogen production, are further enhancing market prospects.
Challenges Impacting CCUS Market Growth
The CCUS market faces considerable hurdles, including substantial capital expenditures, ongoing technological limitations, and a degree of regulatory uncertainty. The imperative for large-scale infrastructure development, the potential for CO2 leakage risks, and the inherent complexity in managing the entire CCUS value chain present significant challenges that could influence the market's growth trajectory.
Key Players Shaping the CCUS Market
- Occidental Petroleum Corporation
- Linde PLC
- Shell PLC
- Honeywell International Inc
- General Electric
- Exxon Mobil Corporation
- Japan CCS Co Ltd
- SLB
- Fluor Corporation
- Baker Hughes Company
- Halliburton
- Aker Solutions
- Dakota Gasification Company
- JX Nippon Oil & Gas Exploration Corporation
- Siemens Energy
- Air Liquide
- Mitsubishi Heavy Industries Ltd
Significant CCUS Market Industry Milestones
- March 2024: JX Nippon Oil & Gas Exploration Corporation and Chevron New Energies have forged a memorandum of understanding to explore the feasibility of exporting CO2 from Japan to CCS initiatives in Australia and other Asia-Pacific nations. This strategic move is set to considerably broaden JX Nippon's market influence.
- March 2024: Shell and ONGC have initiated a collaborative effort focusing on a storage study and an enhanced oil recovery (EOR) assessment in India. This project aims to utilize depleted oil and gas fields and saline aquifers for CCS implementation and EOR strategies, positioning CCS as a vital tool for emissions mitigation while simultaneously enhancing oil production.
- February 2024: Fluor Corporation and Chevron New Energies have entered into a license agreement, granting Chevron access to Fluor's proprietary Econamine FG PlusSM technology. This technology is designed to effectively reduce CO2 emissions at Chevron's Eastridge Cogeneration facility, underscoring the increasing adoption of proven and efficient carbon capture solutions.
Future Outlook for CCUS Market
The CCUS market is poised for significant growth, driven by escalating climate change concerns and stricter environmental regulations. Strategic partnerships, technological innovation, and supportive government policies will continue to propel market expansion. The integration of CCUS with other clean energy solutions presents vast opportunities for creating a sustainable and low-carbon energy future. The market is expected to see robust growth throughout the forecast period, with significant opportunities for investment and innovation.
CCUS Market Segmentation
-
1. Technology
- 1.1. Pre-combustion Capture
- 1.2. Oxy-fuel Combustion Capture
- 1.3. Post-combustion Capture
-
2. End-user Industry
- 2.1. Oil and Gas
- 2.2. Coal and Biomass Power Plant
- 2.3. Iron and Steel
- 2.4. Chemical
- 2.5. Cement
CCUS Market Segmentation By Geography
-
1. Asia Pacific
- 1.1. China
- 1.2. India
- 1.3. Japan
- 1.4. Australia
- 1.5. Rest of Asia Pacific
-
2. North America
- 2.1. United States
- 2.2. Canada
- 2.3. Mexico
-
3. Europe
- 3.1. Germany
- 3.2. United Kingdom
- 3.3. France
- 3.4. Norway
- 3.5. Netherlands
- 3.6. Rest of Europe
- 4. Rest of the World
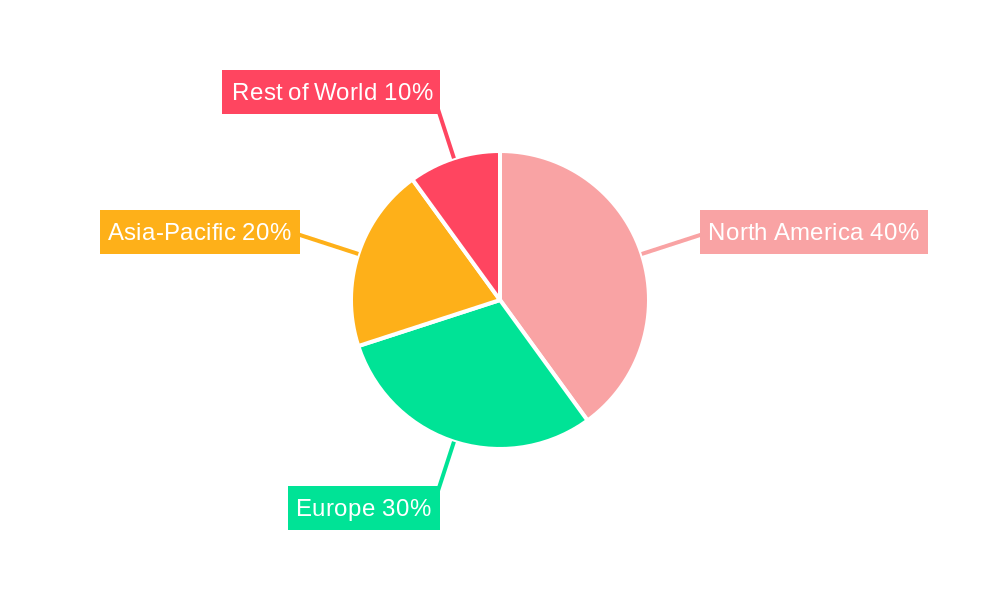
CCUS Market Regional Market Share
Geographic Coverage of CCUS Market
CCUS Market REPORT HIGHLIGHTS
| Aspects | Details |
|---|---|
| Study Period | 2020-2034 |
| Base Year | 2025 |
| Estimated Year | 2026 |
| Forecast Period | 2026-2034 |
| Historical Period | 2020-2025 |
| Growth Rate | CAGR of 14.21% from 2020-2034 |
| Segmentation |
|
Table of Contents
- 1. Introduction
- 1.1. Research Scope
- 1.2. Market Segmentation
- 1.3. Research Objective
- 1.4. Definitions and Assumptions
- 2. Executive Summary
- 2.1. Market Snapshot
- 3. Market Dynamics
- 3.1. Market Drivers
- 3.2. Market Restrains
- 3.3. Market Trends
- 3.4. Market Opportunities
- 4. Market Factor Analysis
- 4.1. Porters Five Forces
- 4.1.1. Bargaining Power of Suppliers
- 4.1.2. Bargaining Power of Buyers
- 4.1.3. Threat of New Entrants
- 4.1.4. Threat of Substitutes
- 4.1.5. Competitive Rivalry
- 4.2. PESTEL analysis
- 4.3. BCG Analysis
- 4.3.1. Stars (High Growth, High Market Share)
- 4.3.2. Cash Cows (Low Growth, High Market Share)
- 4.3.3. Question Mark (High Growth, Low Market Share)
- 4.3.4. Dogs (Low Growth, Low Market Share)
- 4.4. Ansoff Matrix Analysis
- 4.5. Supply Chain Analysis
- 4.6. Regulatory Landscape
- 4.7. Current Market Potential and Opportunity Assessment (TAM–SAM–SOM Framework)
- 4.8. TIR Analyst Note
- 4.1. Porters Five Forces
- 5. Market Analysis, Insights and Forecast 2021-2033
- 5.1. Market Analysis, Insights and Forecast - by Technology
- 5.1.1. Pre-combustion Capture
- 5.1.2. Oxy-fuel Combustion Capture
- 5.1.3. Post-combustion Capture
- 5.2. Market Analysis, Insights and Forecast - by End-user Industry
- 5.2.1. Oil and Gas
- 5.2.2. Coal and Biomass Power Plant
- 5.2.3. Iron and Steel
- 5.2.4. Chemical
- 5.2.5. Cement
- 5.3. Market Analysis, Insights and Forecast - by Region
- 5.3.1. Asia Pacific
- 5.3.2. North America
- 5.3.3. Europe
- 5.3.4. Rest of the World
- 5.1. Market Analysis, Insights and Forecast - by Technology
- 6. CCUS Market Analysis, Insights and Forecast, 2021-2033
- 6.1. Market Analysis, Insights and Forecast - by Technology
- 6.1.1. Pre-combustion Capture
- 6.1.2. Oxy-fuel Combustion Capture
- 6.1.3. Post-combustion Capture
- 6.2. Market Analysis, Insights and Forecast - by End-user Industry
- 6.2.1. Oil and Gas
- 6.2.2. Coal and Biomass Power Plant
- 6.2.3. Iron and Steel
- 6.2.4. Chemical
- 6.2.5. Cement
- 6.1. Market Analysis, Insights and Forecast - by Technology
- 7. Asia Pacific CCUS Market Analysis, Insights and Forecast, 2020-2032
- 7.1. Market Analysis, Insights and Forecast - by Technology
- 7.1.1. Pre-combustion Capture
- 7.1.2. Oxy-fuel Combustion Capture
- 7.1.3. Post-combustion Capture
- 7.2. Market Analysis, Insights and Forecast - by End-user Industry
- 7.2.1. Oil and Gas
- 7.2.2. Coal and Biomass Power Plant
- 7.2.3. Iron and Steel
- 7.2.4. Chemical
- 7.2.5. Cement
- 7.1. Market Analysis, Insights and Forecast - by Technology
- 8. North America CCUS Market Analysis, Insights and Forecast, 2020-2032
- 8.1. Market Analysis, Insights and Forecast - by Technology
- 8.1.1. Pre-combustion Capture
- 8.1.2. Oxy-fuel Combustion Capture
- 8.1.3. Post-combustion Capture
- 8.2. Market Analysis, Insights and Forecast - by End-user Industry
- 8.2.1. Oil and Gas
- 8.2.2. Coal and Biomass Power Plant
- 8.2.3. Iron and Steel
- 8.2.4. Chemical
- 8.2.5. Cement
- 8.1. Market Analysis, Insights and Forecast - by Technology
- 9. Europe CCUS Market Analysis, Insights and Forecast, 2020-2032
- 9.1. Market Analysis, Insights and Forecast - by Technology
- 9.1.1. Pre-combustion Capture
- 9.1.2. Oxy-fuel Combustion Capture
- 9.1.3. Post-combustion Capture
- 9.2. Market Analysis, Insights and Forecast - by End-user Industry
- 9.2.1. Oil and Gas
- 9.2.2. Coal and Biomass Power Plant
- 9.2.3. Iron and Steel
- 9.2.4. Chemical
- 9.2.5. Cement
- 9.1. Market Analysis, Insights and Forecast - by Technology
- 10. Rest of the World CCUS Market Analysis, Insights and Forecast, 2020-2032
- 10.1. Market Analysis, Insights and Forecast - by Technology
- 10.1.1. Pre-combustion Capture
- 10.1.2. Oxy-fuel Combustion Capture
- 10.1.3. Post-combustion Capture
- 10.2. Market Analysis, Insights and Forecast - by End-user Industry
- 10.2.1. Oil and Gas
- 10.2.2. Coal and Biomass Power Plant
- 10.2.3. Iron and Steel
- 10.2.4. Chemical
- 10.2.5. Cement
- 10.1. Market Analysis, Insights and Forecast - by Technology
- 11. Competitive Analysis
- 11.1. Company Profiles
- 11.1.1 Occidental Petroleum Corporation
- 11.1.1.1. Company Overview
- 11.1.1.2. Products
- 11.1.1.3. Company Financials
- 11.1.1.4. SWOT Analysis
- 11.1.2 Linde PLC
- 11.1.2.1. Company Overview
- 11.1.2.2. Products
- 11.1.2.3. Company Financials
- 11.1.2.4. SWOT Analysis
- 11.1.3 Shell PLC
- 11.1.3.1. Company Overview
- 11.1.3.2. Products
- 11.1.3.3. Company Financials
- 11.1.3.4. SWOT Analysis
- 11.1.4 Honeywell International Inc
- 11.1.4.1. Company Overview
- 11.1.4.2. Products
- 11.1.4.3. Company Financials
- 11.1.4.4. SWOT Analysis
- 11.1.5 General Electric
- 11.1.5.1. Company Overview
- 11.1.5.2. Products
- 11.1.5.3. Company Financials
- 11.1.5.4. SWOT Analysis
- 11.1.6 Exxon Mobil Corporation
- 11.1.6.1. Company Overview
- 11.1.6.2. Products
- 11.1.6.3. Company Financials
- 11.1.6.4. SWOT Analysis
- 11.1.7 Japan CCS Co Ltd
- 11.1.7.1. Company Overview
- 11.1.7.2. Products
- 11.1.7.3. Company Financials
- 11.1.7.4. SWOT Analysis
- 11.1.8 SLB*List Not Exhaustive
- 11.1.8.1. Company Overview
- 11.1.8.2. Products
- 11.1.8.3. Company Financials
- 11.1.8.4. SWOT Analysis
- 11.1.9 Fluor Corporation
- 11.1.9.1. Company Overview
- 11.1.9.2. Products
- 11.1.9.3. Company Financials
- 11.1.9.4. SWOT Analysis
- 11.1.10 Baker Hughes Company
- 11.1.10.1. Company Overview
- 11.1.10.2. Products
- 11.1.10.3. Company Financials
- 11.1.10.4. SWOT Analysis
- 11.1.11 Halliburton
- 11.1.11.1. Company Overview
- 11.1.11.2. Products
- 11.1.11.3. Company Financials
- 11.1.11.4. SWOT Analysis
- 11.1.12 Aker Solutions
- 11.1.12.1. Company Overview
- 11.1.12.2. Products
- 11.1.12.3. Company Financials
- 11.1.12.4. SWOT Analysis
- 11.1.13 Dakota Gasification Company
- 11.1.13.1. Company Overview
- 11.1.13.2. Products
- 11.1.13.3. Company Financials
- 11.1.13.4. SWOT Analysis
- 11.1.14 JX Nippon Oil & Gas Exploration Corporation
- 11.1.14.1. Company Overview
- 11.1.14.2. Products
- 11.1.14.3. Company Financials
- 11.1.14.4. SWOT Analysis
- 11.1.15 Siemens Energy
- 11.1.15.1. Company Overview
- 11.1.15.2. Products
- 11.1.15.3. Company Financials
- 11.1.15.4. SWOT Analysis
- 11.1.16 Air Liquide
- 11.1.16.1. Company Overview
- 11.1.16.2. Products
- 11.1.16.3. Company Financials
- 11.1.16.4. SWOT Analysis
- 11.1.17 Mitsubishi Heavy Industries Ltd
- 11.1.17.1. Company Overview
- 11.1.17.2. Products
- 11.1.17.3. Company Financials
- 11.1.17.4. SWOT Analysis
- 11.1.1 Occidental Petroleum Corporation
- 11.2. Market Entropy
- 11.2.1 Company's Key Areas Served
- 11.2.2 Recent Developments
- 11.3. Company Market Share Analysis 2025
- 11.3.1 Top 5 Companies Market Share Analysis
- 11.3.2 Top 3 Companies Market Share Analysis
- 11.4. List of Potential Customers
- 12. Research Methodology
List of Figures
- Figure 1: CCUS Market Revenue Breakdown (Million, %) by Product 2025 & 2033
- Figure 2: CCUS Market Share (%) by Company 2025
List of Tables
- Table 1: CCUS Market Revenue Million Forecast, by Technology 2020 & 2033
- Table 2: CCUS Market Volume K Tons Forecast, by Technology 2020 & 2033
- Table 3: CCUS Market Revenue Million Forecast, by End-user Industry 2020 & 2033
- Table 4: CCUS Market Volume K Tons Forecast, by End-user Industry 2020 & 2033
- Table 5: CCUS Market Revenue Million Forecast, by Region 2020 & 2033
- Table 6: CCUS Market Volume K Tons Forecast, by Region 2020 & 2033
- Table 7: CCUS Market Revenue Million Forecast, by Technology 2020 & 2033
- Table 8: CCUS Market Volume K Tons Forecast, by Technology 2020 & 2033
- Table 9: CCUS Market Revenue Million Forecast, by End-user Industry 2020 & 2033
- Table 10: CCUS Market Volume K Tons Forecast, by End-user Industry 2020 & 2033
- Table 11: CCUS Market Revenue Million Forecast, by Country 2020 & 2033
- Table 12: CCUS Market Volume K Tons Forecast, by Country 2020 & 2033
- Table 13: China CCUS Market Revenue (Million) Forecast, by Application 2020 & 2033
- Table 14: China CCUS Market Volume (K Tons) Forecast, by Application 2020 & 2033
- Table 15: India CCUS Market Revenue (Million) Forecast, by Application 2020 & 2033
- Table 16: India CCUS Market Volume (K Tons) Forecast, by Application 2020 & 2033
- Table 17: Japan CCUS Market Revenue (Million) Forecast, by Application 2020 & 2033
- Table 18: Japan CCUS Market Volume (K Tons) Forecast, by Application 2020 & 2033
- Table 19: Australia CCUS Market Revenue (Million) Forecast, by Application 2020 & 2033
- Table 20: Australia CCUS Market Volume (K Tons) Forecast, by Application 2020 & 2033
- Table 21: Rest of Asia Pacific CCUS Market Revenue (Million) Forecast, by Application 2020 & 2033
- Table 22: Rest of Asia Pacific CCUS Market Volume (K Tons) Forecast, by Application 2020 & 2033
- Table 23: CCUS Market Revenue Million Forecast, by Technology 2020 & 2033
- Table 24: CCUS Market Volume K Tons Forecast, by Technology 2020 & 2033
- Table 25: CCUS Market Revenue Million Forecast, by End-user Industry 2020 & 2033
- Table 26: CCUS Market Volume K Tons Forecast, by End-user Industry 2020 & 2033
- Table 27: CCUS Market Revenue Million Forecast, by Country 2020 & 2033
- Table 28: CCUS Market Volume K Tons Forecast, by Country 2020 & 2033
- Table 29: United States CCUS Market Revenue (Million) Forecast, by Application 2020 & 2033
- Table 30: United States CCUS Market Volume (K Tons) Forecast, by Application 2020 & 2033
- Table 31: Canada CCUS Market Revenue (Million) Forecast, by Application 2020 & 2033
- Table 32: Canada CCUS Market Volume (K Tons) Forecast, by Application 2020 & 2033
- Table 33: Mexico CCUS Market Revenue (Million) Forecast, by Application 2020 & 2033
- Table 34: Mexico CCUS Market Volume (K Tons) Forecast, by Application 2020 & 2033
- Table 35: CCUS Market Revenue Million Forecast, by Technology 2020 & 2033
- Table 36: CCUS Market Volume K Tons Forecast, by Technology 2020 & 2033
- Table 37: CCUS Market Revenue Million Forecast, by End-user Industry 2020 & 2033
- Table 38: CCUS Market Volume K Tons Forecast, by End-user Industry 2020 & 2033
- Table 39: CCUS Market Revenue Million Forecast, by Country 2020 & 2033
- Table 40: CCUS Market Volume K Tons Forecast, by Country 2020 & 2033
- Table 41: Germany CCUS Market Revenue (Million) Forecast, by Application 2020 & 2033
- Table 42: Germany CCUS Market Volume (K Tons) Forecast, by Application 2020 & 2033
- Table 43: United Kingdom CCUS Market Revenue (Million) Forecast, by Application 2020 & 2033
- Table 44: United Kingdom CCUS Market Volume (K Tons) Forecast, by Application 2020 & 2033
- Table 45: France CCUS Market Revenue (Million) Forecast, by Application 2020 & 2033
- Table 46: France CCUS Market Volume (K Tons) Forecast, by Application 2020 & 2033
- Table 47: Norway CCUS Market Revenue (Million) Forecast, by Application 2020 & 2033
- Table 48: Norway CCUS Market Volume (K Tons) Forecast, by Application 2020 & 2033
- Table 49: Netherlands CCUS Market Revenue (Million) Forecast, by Application 2020 & 2033
- Table 50: Netherlands CCUS Market Volume (K Tons) Forecast, by Application 2020 & 2033
- Table 51: Rest of Europe CCUS Market Revenue (Million) Forecast, by Application 2020 & 2033
- Table 52: Rest of Europe CCUS Market Volume (K Tons) Forecast, by Application 2020 & 2033
- Table 53: CCUS Market Revenue Million Forecast, by Technology 2020 & 2033
- Table 54: CCUS Market Volume K Tons Forecast, by Technology 2020 & 2033
- Table 55: CCUS Market Revenue Million Forecast, by End-user Industry 2020 & 2033
- Table 56: CCUS Market Volume K Tons Forecast, by End-user Industry 2020 & 2033
- Table 57: CCUS Market Revenue Million Forecast, by Country 2020 & 2033
- Table 58: CCUS Market Volume K Tons Forecast, by Country 2020 & 2033
Frequently Asked Questions
1. What is the projected Compound Annual Growth Rate (CAGR) of the CCUS Market?
The projected CAGR is approximately 14.21%.
2. Which companies are prominent players in the CCUS Market?
Key companies in the market include Occidental Petroleum Corporation, Linde PLC, Shell PLC, Honeywell International Inc, General Electric, Exxon Mobil Corporation, Japan CCS Co Ltd, SLB*List Not Exhaustive, Fluor Corporation, Baker Hughes Company, Halliburton, Aker Solutions, Dakota Gasification Company, JX Nippon Oil & Gas Exploration Corporation, Siemens Energy, Air Liquide, Mitsubishi Heavy Industries Ltd.
3. What are the main segments of the CCUS Market?
The market segments include Technology, End-user Industry.
4. Can you provide details about the market size?
The market size is estimated to be USD 2.42 Million as of 2022.
5. What are some drivers contributing to market growth?
Emerging Demand for CO2 Injection Technique for Enhanced Oil Recovery (EOR); Strict Government Norms Toward GHG Emissions.
6. What are the notable trends driving market growth?
Oil and Gas Segment to Dominate the Market.
7. Are there any restraints impacting market growth?
Huge CCS Technology Implementation Costs; Growth in Shale Investments.
8. Can you provide examples of recent developments in the market?
March 2024: JX Nippon Oil & Gas Exploration Corporation and Chevron New Energies, a division of Chevron U.S.A. Inc., entered into a memorandum of understanding aimed at assessing the potential export of carbon dioxide from Japan to carbon capture and storage (CCS) initiatives situated in Australia and other nations across Asia-Pacific. This agreement enhances the company's market footprint.
9. What pricing options are available for accessing the report?
Pricing options include single-user, multi-user, and enterprise licenses priced at USD 4750, USD 5250, and USD 8750 respectively.
10. Is the market size provided in terms of value or volume?
The market size is provided in terms of value, measured in Million and volume, measured in K Tons.
11. Are there any specific market keywords associated with the report?
Yes, the market keyword associated with the report is "CCUS Market," which aids in identifying and referencing the specific market segment covered.
12. How do I determine which pricing option suits my needs best?
The pricing options vary based on user requirements and access needs. Individual users may opt for single-user licenses, while businesses requiring broader access may choose multi-user or enterprise licenses for cost-effective access to the report.
13. Are there any additional resources or data provided in the CCUS Market report?
While the report offers comprehensive insights, it's advisable to review the specific contents or supplementary materials provided to ascertain if additional resources or data are available.
14. How can I stay updated on further developments or reports in the CCUS Market?
To stay informed about further developments, trends, and reports in the CCUS Market, consider subscribing to industry newsletters, following relevant companies and organizations, or regularly checking reputable industry news sources and publications.
Methodology
Step 1 - Identification of Relevant Samples Size from Population Database


Step 2 - Approaches for Defining Global Market Size (Value, Volume* & Price*)

Note*: In applicable scenarios
Step 3 - Data Sources
Primary Research
- Web Analytics
- Survey Reports
- Research Institute
- Latest Research Reports
- Opinion Leaders
Secondary Research
- Annual Reports
- White Paper
- Latest Press Release
- Industry Association
- Paid Database
- Investor Presentations

Step 4 - Data Triangulation
Involves using different sources of information in order to increase the validity of a study
These sources are likely to be stakeholders in a program - participants, other researchers, program staff, other community members, and so on.
Then we put all data in single framework & apply various statistical tools to find out the dynamic on the market.
During the analysis stage, feedback from the stakeholder groups would be compared to determine areas of agreement as well as areas of divergence