

Key Insights
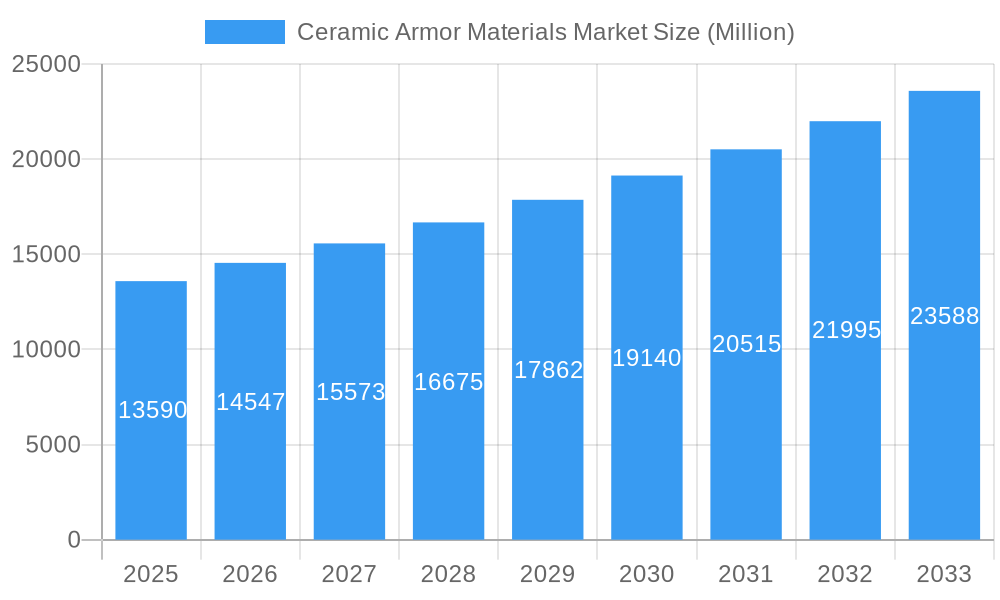
The Ceramic Armor Materials market is experiencing robust growth, projected to reach \$13.59 billion in 2025 and maintain a Compound Annual Growth Rate (CAGR) of 7.03% from 2025 to 2033. This expansion is driven by increasing demand for lightweight yet highly protective armor solutions across diverse sectors. The rising adoption of ceramic armor in military applications, particularly body armor and vehicle protection systems, is a primary growth catalyst. Furthermore, the growing civil infrastructure protection needs, encompassing applications like civil armor and marine armor, are significantly contributing to market expansion. Technological advancements leading to enhanced ceramic composites with superior ballistic performance and improved fracture toughness are further fueling market growth. The Asia-Pacific region, especially China and India, is anticipated to dominate the market due to significant military spending and increasing investments in infrastructure development. However, the high cost of manufacturing advanced ceramic materials and the potential for alternative material development could pose challenges to the market's continued expansion.
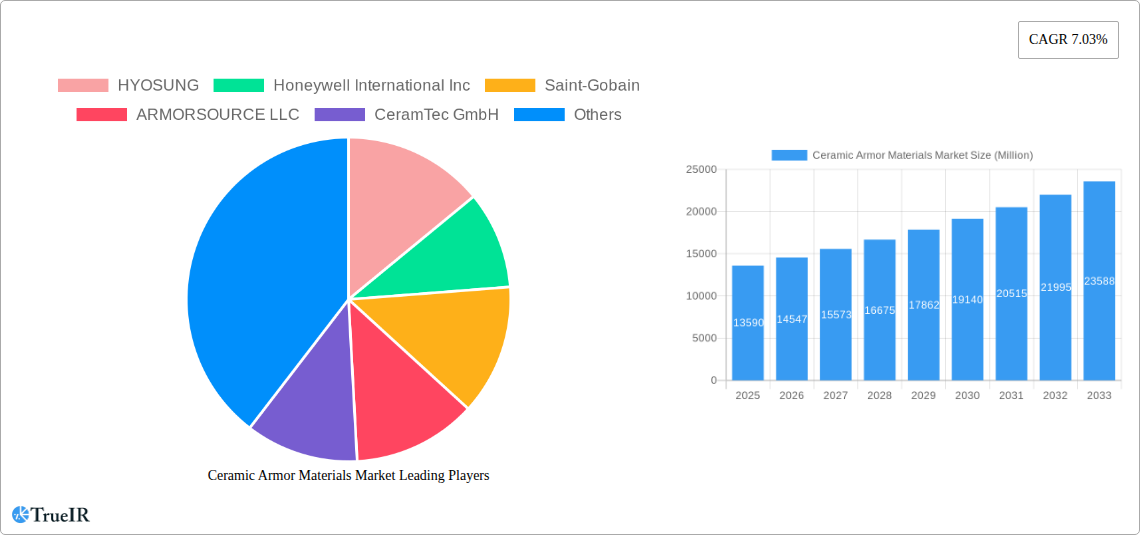
Ceramic Armor Materials Market Market Size (In Billion)
The market segmentation reveals a diverse landscape. Metal and alloy-based ceramic composites, owing to their excellent strength-to-weight ratio, constitute a significant portion of the market. The aerospace segment's demand for lightweight and high-performance armor materials contributes significantly to the overall market value. While specific market share figures for each segment aren't provided, a logical estimation, based on market trends and existing reports, suggests that the aerospace and body armor segments likely hold the largest shares. The competitive landscape is characterized by a mix of established players like Honeywell International, Saint-Gobain, and 3M, alongside specialized companies such as ArmorSource LLC and CeramTec GmbH, each contributing to innovation and technological advancement within the sector. The continued focus on research and development within the industry is poised to unlock new opportunities for enhanced ceramic armor materials in the years to come, leading to greater protection and lighter weight applications.
Ceramic Armor Materials Market Company Market Share
Ceramic Armor Materials Market: A Comprehensive Market Report (2019-2033)
This dynamic report provides a detailed analysis of the Ceramic Armor Materials market, offering invaluable insights for businesses, investors, and researchers. With a comprehensive study period spanning 2019-2033 (Base Year: 2025, Estimated Year: 2025, Forecast Period: 2025-2033, Historical Period: 2019-2024), this report leverages extensive data and expert analysis to uncover key trends, challenges, and opportunities within this rapidly evolving sector. The market is expected to reach xx Million by 2033, exhibiting a robust CAGR of xx% during the forecast period.
Ceramic Armor Materials Market Market Structure & Competitive Landscape
The Ceramic Armor Materials market exhibits a moderately concentrated structure, with several key players holding significant market share. However, the presence of numerous smaller companies, particularly in niche segments, fosters innovation and competition. The market is characterized by ongoing mergers and acquisitions (M&A) activity, reflecting consolidation efforts and expansion strategies. The concentration ratio (CR4) for 2024 is estimated at xx%, indicating moderate market concentration. Innovation is a major driver, fueled by advancements in materials science, manufacturing processes, and application-specific design. Stringent regulatory frameworks concerning safety and performance standards influence product development and market entry. Product substitutes, such as advanced composites and polymers, pose a level of competitive pressure. End-user segmentation is diverse, encompassing aerospace, defense, and commercial applications, each with distinct requirements and purchasing dynamics.
- Market Concentration: CR4 (2024) estimated at xx%.
- Innovation Drivers: Advancements in materials science, manufacturing technology.
- Regulatory Impacts: Stringent safety and performance standards.
- Product Substitutes: Advanced composites, polymers.
- End-User Segmentation: Aerospace, defense, commercial sectors.
- M&A Trends: Moderate activity, indicating market consolidation. Estimated M&A volume in 2024: xx Million.
Ceramic Armor Materials Market Market Trends & Opportunities
The Ceramic Armor Materials market is experiencing robust growth, driven by increasing demand from diverse sectors. Technological advancements, notably in lightweight yet highly protective materials, are reshaping market dynamics. Consumer preferences are shifting towards enhanced performance, durability, and cost-effectiveness. The market exhibits a complex competitive landscape, characterized by intense rivalry amongst established players and the emergence of innovative entrants. Key trends include the rising adoption of advanced ceramic composites, the growing focus on lightweight armor solutions, and increasing demand for specialized armor in civilian applications. The market size is projected to grow at a CAGR of xx% from 2025 to 2033, driven primarily by increasing military spending and growing awareness of civilian protection needs. Market penetration rates vary across regions and applications, with the highest penetration observed in the defense and aerospace segments.
Dominant Markets & Segments in Ceramic Armor Materials Market
The North American region currently holds the largest market share, driven by strong defense spending and a technologically advanced manufacturing base. However, Asia-Pacific is projected to witness the highest growth rate due to increasing defense budgets and urbanization in developing economies. Within product types, Ceramic and Composite materials command the highest market share due to their superior protection capabilities. The Body Armor application segment dominates overall demand, followed by Vehicle Armor. Growth is propelled by factors like modernization of military equipment, escalating terrorist threats, and rising demand for enhanced security in civilian infrastructure.
- Key Growth Drivers (North America): High defense spending, technologically advanced manufacturing.
- Key Growth Drivers (Asia-Pacific): Increasing defense budgets, urbanization.
- Dominant Product Type: Ceramic and Composite materials.
- Dominant Application: Body Armor, followed by Vehicle Armor.
Ceramic Armor Materials Market Product Analysis
Recent innovations focus on enhancing the strength-to-weight ratio of ceramic armor materials, improving flexibility, and incorporating advanced functionalities such as energy absorption and impact resistance. The market sees a shift towards lighter, more flexible armor solutions to meet the demands of various applications, from lightweight body armor to advanced vehicle protection systems. This focus on improved performance, coupled with enhanced manufacturing techniques, is driving market growth and competition.
Key Drivers, Barriers & Challenges in Ceramic Armor Materials Market
Key Drivers: Increased defense budgets globally, rising demand for enhanced security in civilian applications, technological advancements leading to lighter and stronger materials. For example, the development of advanced ceramic composites has significantly improved the performance of body armor.
Key Challenges: High production costs for advanced materials, stringent regulatory requirements, potential supply chain disruptions impacting availability of raw materials. These factors can significantly impact production costs and time-to-market, making the market competitive.
Growth Drivers in the Ceramic Armor Materials Market Market
The increasing demand for lightweight and high-performance armor solutions, driven by both military and civilian applications, is a primary growth driver. Advancements in materials science and manufacturing processes are continually improving the properties of ceramic armor, expanding its applications. Government regulations and policies promoting national security also stimulate market growth.
Challenges Impacting Ceramic Armor Materials Market Growth
High raw material costs and fluctuating supply chains pose significant challenges. Stringent safety and regulatory requirements add complexity and increase production costs. Intense competition and technological disruptions also impact market dynamics. These factors can limit market growth and profitability.
Key Players Shaping the Ceramic Armor Materials Market Market
- HYOSUNG
- Honeywell International Inc (Honeywell International Inc)
- Saint-Gobain (Saint-Gobain)
- ARMORSOURCE LLC
- CeramTec GmbH
- Teijin Aramid B V
- 3M (3M)
- Tata Steel (Tata Steel)
- PPG Industries Inc (PPG Industries Inc)
- ATI
- CoorsTek Inc
- Morgan Advanced Materials
- Schunk Carbon Technology
- DSM
- DuPont (DuPont)
- JPS Composite Materials
- SAFEGUARDARMOR COM
- TenCate Protective Fabrics
- NP Aerospace
Significant Ceramic Armor Materials Market Industry Milestones
- April 2023: DuPont launched Kevlar and EXO aramid fiber, enhancing body armor performance.
- April 2023: NP Aerospace expanded its business units, boosting personal protection and platform armor production.
Future Outlook for Ceramic Armor Materials Market Market
The Ceramic Armor Materials market is poised for continued growth, driven by technological innovation and increasing demand across various sectors. Strategic partnerships, investments in R&D, and expansion into new applications will shape future market dynamics. The market presents substantial opportunities for companies with a focus on developing lightweight, high-performance, and cost-effective solutions.
Ceramic Armor Materials Market Segmentation
-
1. Product Type
- 1.1. Metal and Alloy
- 1.2. Ceramic and Composite
- 1.3. Para-aramid Fiber
- 1.4. Ultra-high-molecular-weight Polyethylene
- 1.5. Other Product Types (Including Fiber Glass, etc.)
-
2. Application
- 2.1. Aerospace
- 2.2. Body Armor
- 2.3. Civil Armor
- 2.4. Marine Armor
- 2.5. Vehicle Armor
Ceramic Armor Materials Market Segmentation By Geography
-
1. Asia Pacific
- 1.1. China
- 1.2. India
- 1.3. Japan
- 1.4. South Korea
- 1.5. Rest of Asia Pacific
-
2. North America
- 2.1. United States
- 2.2. Canada
- 2.3. Mexico
-
3. Europe
- 3.1. Germany
- 3.2. United Kingdom
- 3.3. France
- 3.4. Italy
- 3.5. Rest of Europe
-
4. South America
- 4.1. Brazil
- 4.2. Argentina
- 4.3. Rest of South America
-
5. Middle East and Africa
- 5.1. South Africa
- 5.2. Saudi Arabia
- 5.3. Rest of Middle East and Africa
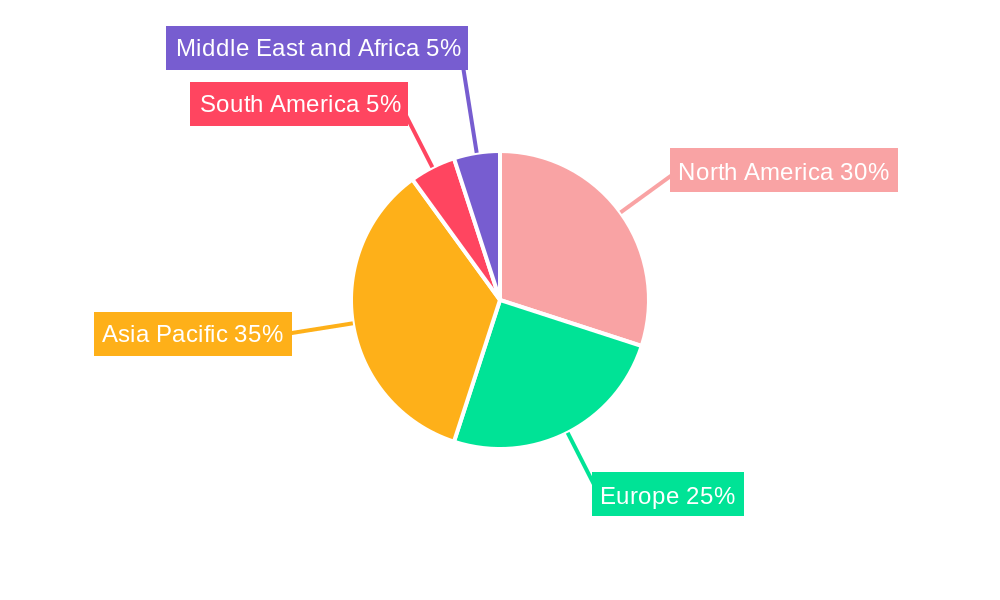
Ceramic Armor Materials Market Regional Market Share
Geographic Coverage of Ceramic Armor Materials Market
Ceramic Armor Materials Market REPORT HIGHLIGHTS
| Aspects | Details |
|---|---|
| Study Period | 2020-2034 |
| Base Year | 2025 |
| Estimated Year | 2026 |
| Forecast Period | 2026-2034 |
| Historical Period | 2020-2025 |
| Growth Rate | CAGR of 7.03% from 2020-2034 |
| Segmentation |
|
Table of Contents
- 1. Introduction
- 1.1. Research Scope
- 1.2. Market Segmentation
- 1.3. Research Objective
- 1.4. Definitions and Assumptions
- 2. Executive Summary
- 2.1. Market Snapshot
- 3. Market Dynamics
- 3.1. Market Drivers
- 3.2. Market Restrains
- 3.3. Market Trends
- 3.4. Market Opportunities
- 4. Market Factor Analysis
- 4.1. Porters Five Forces
- 4.1.1. Bargaining Power of Suppliers
- 4.1.2. Bargaining Power of Buyers
- 4.1.3. Threat of New Entrants
- 4.1.4. Threat of Substitutes
- 4.1.5. Competitive Rivalry
- 4.2. PESTEL analysis
- 4.3. BCG Analysis
- 4.3.1. Stars (High Growth, High Market Share)
- 4.3.2. Cash Cows (Low Growth, High Market Share)
- 4.3.3. Question Mark (High Growth, Low Market Share)
- 4.3.4. Dogs (Low Growth, Low Market Share)
- 4.4. Ansoff Matrix Analysis
- 4.5. Supply Chain Analysis
- 4.6. Regulatory Landscape
- 4.7. Current Market Potential and Opportunity Assessment (TAM–SAM–SOM Framework)
- 4.8. TIR Analyst Note
- 4.1. Porters Five Forces
- 5. Market Analysis, Insights and Forecast 2021-2033
- 5.1. Market Analysis, Insights and Forecast - by Product Type
- 5.1.1. Metal and Alloy
- 5.1.2. Ceramic and Composite
- 5.1.3. Para-aramid Fiber
- 5.1.4. Ultra-high-molecular-weight Polyethylene
- 5.1.5. Other Product Types (Including Fiber Glass, etc.)
- 5.2. Market Analysis, Insights and Forecast - by Application
- 5.2.1. Aerospace
- 5.2.2. Body Armor
- 5.2.3. Civil Armor
- 5.2.4. Marine Armor
- 5.2.5. Vehicle Armor
- 5.3. Market Analysis, Insights and Forecast - by Region
- 5.3.1. Asia Pacific
- 5.3.2. North America
- 5.3.3. Europe
- 5.3.4. South America
- 5.3.5. Middle East and Africa
- 5.1. Market Analysis, Insights and Forecast - by Product Type
- 6. Global Ceramic Armor Materials Market Analysis, Insights and Forecast, 2021-2033
- 6.1. Market Analysis, Insights and Forecast - by Product Type
- 6.1.1. Metal and Alloy
- 6.1.2. Ceramic and Composite
- 6.1.3. Para-aramid Fiber
- 6.1.4. Ultra-high-molecular-weight Polyethylene
- 6.1.5. Other Product Types (Including Fiber Glass, etc.)
- 6.2. Market Analysis, Insights and Forecast - by Application
- 6.2.1. Aerospace
- 6.2.2. Body Armor
- 6.2.3. Civil Armor
- 6.2.4. Marine Armor
- 6.2.5. Vehicle Armor
- 6.1. Market Analysis, Insights and Forecast - by Product Type
- 7. Asia Pacific Ceramic Armor Materials Market Analysis, Insights and Forecast, 2020-2032
- 7.1. Market Analysis, Insights and Forecast - by Product Type
- 7.1.1. Metal and Alloy
- 7.1.2. Ceramic and Composite
- 7.1.3. Para-aramid Fiber
- 7.1.4. Ultra-high-molecular-weight Polyethylene
- 7.1.5. Other Product Types (Including Fiber Glass, etc.)
- 7.2. Market Analysis, Insights and Forecast - by Application
- 7.2.1. Aerospace
- 7.2.2. Body Armor
- 7.2.3. Civil Armor
- 7.2.4. Marine Armor
- 7.2.5. Vehicle Armor
- 7.1. Market Analysis, Insights and Forecast - by Product Type
- 8. North America Ceramic Armor Materials Market Analysis, Insights and Forecast, 2020-2032
- 8.1. Market Analysis, Insights and Forecast - by Product Type
- 8.1.1. Metal and Alloy
- 8.1.2. Ceramic and Composite
- 8.1.3. Para-aramid Fiber
- 8.1.4. Ultra-high-molecular-weight Polyethylene
- 8.1.5. Other Product Types (Including Fiber Glass, etc.)
- 8.2. Market Analysis, Insights and Forecast - by Application
- 8.2.1. Aerospace
- 8.2.2. Body Armor
- 8.2.3. Civil Armor
- 8.2.4. Marine Armor
- 8.2.5. Vehicle Armor
- 8.1. Market Analysis, Insights and Forecast - by Product Type
- 9. Europe Ceramic Armor Materials Market Analysis, Insights and Forecast, 2020-2032
- 9.1. Market Analysis, Insights and Forecast - by Product Type
- 9.1.1. Metal and Alloy
- 9.1.2. Ceramic and Composite
- 9.1.3. Para-aramid Fiber
- 9.1.4. Ultra-high-molecular-weight Polyethylene
- 9.1.5. Other Product Types (Including Fiber Glass, etc.)
- 9.2. Market Analysis, Insights and Forecast - by Application
- 9.2.1. Aerospace
- 9.2.2. Body Armor
- 9.2.3. Civil Armor
- 9.2.4. Marine Armor
- 9.2.5. Vehicle Armor
- 9.1. Market Analysis, Insights and Forecast - by Product Type
- 10. South America Ceramic Armor Materials Market Analysis, Insights and Forecast, 2020-2032
- 10.1. Market Analysis, Insights and Forecast - by Product Type
- 10.1.1. Metal and Alloy
- 10.1.2. Ceramic and Composite
- 10.1.3. Para-aramid Fiber
- 10.1.4. Ultra-high-molecular-weight Polyethylene
- 10.1.5. Other Product Types (Including Fiber Glass, etc.)
- 10.2. Market Analysis, Insights and Forecast - by Application
- 10.2.1. Aerospace
- 10.2.2. Body Armor
- 10.2.3. Civil Armor
- 10.2.4. Marine Armor
- 10.2.5. Vehicle Armor
- 10.1. Market Analysis, Insights and Forecast - by Product Type
- 11. Middle East and Africa Ceramic Armor Materials Market Analysis, Insights and Forecast, 2020-2032
- 11.1. Market Analysis, Insights and Forecast - by Product Type
- 11.1.1. Metal and Alloy
- 11.1.2. Ceramic and Composite
- 11.1.3. Para-aramid Fiber
- 11.1.4. Ultra-high-molecular-weight Polyethylene
- 11.1.5. Other Product Types (Including Fiber Glass, etc.)
- 11.2. Market Analysis, Insights and Forecast - by Application
- 11.2.1. Aerospace
- 11.2.2. Body Armor
- 11.2.3. Civil Armor
- 11.2.4. Marine Armor
- 11.2.5. Vehicle Armor
- 11.1. Market Analysis, Insights and Forecast - by Product Type
- 12. Competitive Analysis
- 12.1. Company Profiles
- 12.1.1 HYOSUNG
- 12.1.1.1. Company Overview
- 12.1.1.2. Products
- 12.1.1.3. Company Financials
- 12.1.1.4. SWOT Analysis
- 12.1.2 Honeywell International Inc
- 12.1.2.1. Company Overview
- 12.1.2.2. Products
- 12.1.2.3. Company Financials
- 12.1.2.4. SWOT Analysis
- 12.1.3 Saint-Gobain
- 12.1.3.1. Company Overview
- 12.1.3.2. Products
- 12.1.3.3. Company Financials
- 12.1.3.4. SWOT Analysis
- 12.1.4 ARMORSOURCE LLC
- 12.1.4.1. Company Overview
- 12.1.4.2. Products
- 12.1.4.3. Company Financials
- 12.1.4.4. SWOT Analysis
- 12.1.5 CeramTec GmbH
- 12.1.5.1. Company Overview
- 12.1.5.2. Products
- 12.1.5.3. Company Financials
- 12.1.5.4. SWOT Analysis
- 12.1.6 Teijin Aramid B V *List Not Exhaustive
- 12.1.6.1. Company Overview
- 12.1.6.2. Products
- 12.1.6.3. Company Financials
- 12.1.6.4. SWOT Analysis
- 12.1.7 3M
- 12.1.7.1. Company Overview
- 12.1.7.2. Products
- 12.1.7.3. Company Financials
- 12.1.7.4. SWOT Analysis
- 12.1.8 Tata Steel
- 12.1.8.1. Company Overview
- 12.1.8.2. Products
- 12.1.8.3. Company Financials
- 12.1.8.4. SWOT Analysis
- 12.1.9 PPG Industries Inc
- 12.1.9.1. Company Overview
- 12.1.9.2. Products
- 12.1.9.3. Company Financials
- 12.1.9.4. SWOT Analysis
- 12.1.10 ATI
- 12.1.10.1. Company Overview
- 12.1.10.2. Products
- 12.1.10.3. Company Financials
- 12.1.10.4. SWOT Analysis
- 12.1.11 CoorsTek Inc
- 12.1.11.1. Company Overview
- 12.1.11.2. Products
- 12.1.11.3. Company Financials
- 12.1.11.4. SWOT Analysis
- 12.1.12 Morgan Advanced Materials
- 12.1.12.1. Company Overview
- 12.1.12.2. Products
- 12.1.12.3. Company Financials
- 12.1.12.4. SWOT Analysis
- 12.1.13 Schunk Carbon Technology
- 12.1.13.1. Company Overview
- 12.1.13.2. Products
- 12.1.13.3. Company Financials
- 12.1.13.4. SWOT Analysis
- 12.1.14 DSM
- 12.1.14.1. Company Overview
- 12.1.14.2. Products
- 12.1.14.3. Company Financials
- 12.1.14.4. SWOT Analysis
- 12.1.15 DuPont
- 12.1.15.1. Company Overview
- 12.1.15.2. Products
- 12.1.15.3. Company Financials
- 12.1.15.4. SWOT Analysis
- 12.1.16 JPS Composite Materials
- 12.1.16.1. Company Overview
- 12.1.16.2. Products
- 12.1.16.3. Company Financials
- 12.1.16.4. SWOT Analysis
- 12.1.17 SAFEGUARDARMOR COM
- 12.1.17.1. Company Overview
- 12.1.17.2. Products
- 12.1.17.3. Company Financials
- 12.1.17.4. SWOT Analysis
- 12.1.18 TenCate Protective Fabrics
- 12.1.18.1. Company Overview
- 12.1.18.2. Products
- 12.1.18.3. Company Financials
- 12.1.18.4. SWOT Analysis
- 12.1.19 NP Aerospace
- 12.1.19.1. Company Overview
- 12.1.19.2. Products
- 12.1.19.3. Company Financials
- 12.1.19.4. SWOT Analysis
- 12.1.1 HYOSUNG
- 12.2. Market Entropy
- 12.2.1 Company's Key Areas Served
- 12.2.2 Recent Developments
- 12.3. Company Market Share Analysis 2025
- 12.3.1 Top 5 Companies Market Share Analysis
- 12.3.2 Top 3 Companies Market Share Analysis
- 12.4. List of Potential Customers
- 13. Research Methodology
List of Figures
- Figure 1: Global Ceramic Armor Materials Market Revenue Breakdown (Million, %) by Region 2025 & 2033
- Figure 2: Asia Pacific Ceramic Armor Materials Market Revenue (Million), by Product Type 2025 & 2033
- Figure 3: Asia Pacific Ceramic Armor Materials Market Revenue Share (%), by Product Type 2025 & 2033
- Figure 4: Asia Pacific Ceramic Armor Materials Market Revenue (Million), by Application 2025 & 2033
- Figure 5: Asia Pacific Ceramic Armor Materials Market Revenue Share (%), by Application 2025 & 2033
- Figure 6: Asia Pacific Ceramic Armor Materials Market Revenue (Million), by Country 2025 & 2033
- Figure 7: Asia Pacific Ceramic Armor Materials Market Revenue Share (%), by Country 2025 & 2033
- Figure 8: North America Ceramic Armor Materials Market Revenue (Million), by Product Type 2025 & 2033
- Figure 9: North America Ceramic Armor Materials Market Revenue Share (%), by Product Type 2025 & 2033
- Figure 10: North America Ceramic Armor Materials Market Revenue (Million), by Application 2025 & 2033
- Figure 11: North America Ceramic Armor Materials Market Revenue Share (%), by Application 2025 & 2033
- Figure 12: North America Ceramic Armor Materials Market Revenue (Million), by Country 2025 & 2033
- Figure 13: North America Ceramic Armor Materials Market Revenue Share (%), by Country 2025 & 2033
- Figure 14: Europe Ceramic Armor Materials Market Revenue (Million), by Product Type 2025 & 2033
- Figure 15: Europe Ceramic Armor Materials Market Revenue Share (%), by Product Type 2025 & 2033
- Figure 16: Europe Ceramic Armor Materials Market Revenue (Million), by Application 2025 & 2033
- Figure 17: Europe Ceramic Armor Materials Market Revenue Share (%), by Application 2025 & 2033
- Figure 18: Europe Ceramic Armor Materials Market Revenue (Million), by Country 2025 & 2033
- Figure 19: Europe Ceramic Armor Materials Market Revenue Share (%), by Country 2025 & 2033
- Figure 20: South America Ceramic Armor Materials Market Revenue (Million), by Product Type 2025 & 2033
- Figure 21: South America Ceramic Armor Materials Market Revenue Share (%), by Product Type 2025 & 2033
- Figure 22: South America Ceramic Armor Materials Market Revenue (Million), by Application 2025 & 2033
- Figure 23: South America Ceramic Armor Materials Market Revenue Share (%), by Application 2025 & 2033
- Figure 24: South America Ceramic Armor Materials Market Revenue (Million), by Country 2025 & 2033
- Figure 25: South America Ceramic Armor Materials Market Revenue Share (%), by Country 2025 & 2033
- Figure 26: Middle East and Africa Ceramic Armor Materials Market Revenue (Million), by Product Type 2025 & 2033
- Figure 27: Middle East and Africa Ceramic Armor Materials Market Revenue Share (%), by Product Type 2025 & 2033
- Figure 28: Middle East and Africa Ceramic Armor Materials Market Revenue (Million), by Application 2025 & 2033
- Figure 29: Middle East and Africa Ceramic Armor Materials Market Revenue Share (%), by Application 2025 & 2033
- Figure 30: Middle East and Africa Ceramic Armor Materials Market Revenue (Million), by Country 2025 & 2033
- Figure 31: Middle East and Africa Ceramic Armor Materials Market Revenue Share (%), by Country 2025 & 2033
List of Tables
- Table 1: Global Ceramic Armor Materials Market Revenue Million Forecast, by Product Type 2020 & 2033
- Table 2: Global Ceramic Armor Materials Market Revenue Million Forecast, by Application 2020 & 2033
- Table 3: Global Ceramic Armor Materials Market Revenue Million Forecast, by Region 2020 & 2033
- Table 4: Global Ceramic Armor Materials Market Revenue Million Forecast, by Product Type 2020 & 2033
- Table 5: Global Ceramic Armor Materials Market Revenue Million Forecast, by Application 2020 & 2033
- Table 6: Global Ceramic Armor Materials Market Revenue Million Forecast, by Country 2020 & 2033
- Table 7: China Ceramic Armor Materials Market Revenue (Million) Forecast, by Application 2020 & 2033
- Table 8: India Ceramic Armor Materials Market Revenue (Million) Forecast, by Application 2020 & 2033
- Table 9: Japan Ceramic Armor Materials Market Revenue (Million) Forecast, by Application 2020 & 2033
- Table 10: South Korea Ceramic Armor Materials Market Revenue (Million) Forecast, by Application 2020 & 2033
- Table 11: Rest of Asia Pacific Ceramic Armor Materials Market Revenue (Million) Forecast, by Application 2020 & 2033
- Table 12: Global Ceramic Armor Materials Market Revenue Million Forecast, by Product Type 2020 & 2033
- Table 13: Global Ceramic Armor Materials Market Revenue Million Forecast, by Application 2020 & 2033
- Table 14: Global Ceramic Armor Materials Market Revenue Million Forecast, by Country 2020 & 2033
- Table 15: United States Ceramic Armor Materials Market Revenue (Million) Forecast, by Application 2020 & 2033
- Table 16: Canada Ceramic Armor Materials Market Revenue (Million) Forecast, by Application 2020 & 2033
- Table 17: Mexico Ceramic Armor Materials Market Revenue (Million) Forecast, by Application 2020 & 2033
- Table 18: Global Ceramic Armor Materials Market Revenue Million Forecast, by Product Type 2020 & 2033
- Table 19: Global Ceramic Armor Materials Market Revenue Million Forecast, by Application 2020 & 2033
- Table 20: Global Ceramic Armor Materials Market Revenue Million Forecast, by Country 2020 & 2033
- Table 21: Germany Ceramic Armor Materials Market Revenue (Million) Forecast, by Application 2020 & 2033
- Table 22: United Kingdom Ceramic Armor Materials Market Revenue (Million) Forecast, by Application 2020 & 2033
- Table 23: France Ceramic Armor Materials Market Revenue (Million) Forecast, by Application 2020 & 2033
- Table 24: Italy Ceramic Armor Materials Market Revenue (Million) Forecast, by Application 2020 & 2033
- Table 25: Rest of Europe Ceramic Armor Materials Market Revenue (Million) Forecast, by Application 2020 & 2033
- Table 26: Global Ceramic Armor Materials Market Revenue Million Forecast, by Product Type 2020 & 2033
- Table 27: Global Ceramic Armor Materials Market Revenue Million Forecast, by Application 2020 & 2033
- Table 28: Global Ceramic Armor Materials Market Revenue Million Forecast, by Country 2020 & 2033
- Table 29: Brazil Ceramic Armor Materials Market Revenue (Million) Forecast, by Application 2020 & 2033
- Table 30: Argentina Ceramic Armor Materials Market Revenue (Million) Forecast, by Application 2020 & 2033
- Table 31: Rest of South America Ceramic Armor Materials Market Revenue (Million) Forecast, by Application 2020 & 2033
- Table 32: Global Ceramic Armor Materials Market Revenue Million Forecast, by Product Type 2020 & 2033
- Table 33: Global Ceramic Armor Materials Market Revenue Million Forecast, by Application 2020 & 2033
- Table 34: Global Ceramic Armor Materials Market Revenue Million Forecast, by Country 2020 & 2033
- Table 35: South Africa Ceramic Armor Materials Market Revenue (Million) Forecast, by Application 2020 & 2033
- Table 36: Saudi Arabia Ceramic Armor Materials Market Revenue (Million) Forecast, by Application 2020 & 2033
- Table 37: Rest of Middle East and Africa Ceramic Armor Materials Market Revenue (Million) Forecast, by Application 2020 & 2033
Frequently Asked Questions
1. What is the projected Compound Annual Growth Rate (CAGR) of the Ceramic Armor Materials Market?
The projected CAGR is approximately 7.03%.
2. Which companies are prominent players in the Ceramic Armor Materials Market?
Key companies in the market include HYOSUNG, Honeywell International Inc, Saint-Gobain, ARMORSOURCE LLC, CeramTec GmbH, Teijin Aramid B V *List Not Exhaustive, 3M, Tata Steel, PPG Industries Inc, ATI, CoorsTek Inc, Morgan Advanced Materials, Schunk Carbon Technology, DSM, DuPont, JPS Composite Materials, SAFEGUARDARMOR COM, TenCate Protective Fabrics, NP Aerospace.
3. What are the main segments of the Ceramic Armor Materials Market?
The market segments include Product Type, Application.
4. Can you provide details about the market size?
The market size is estimated to be USD 13.59 Million as of 2022.
5. What are some drivers contributing to market growth?
Development of Body Armor and Advanced Weapons; Increasing Homeland Security Concerns; Other Drivers.
6. What are the notable trends driving market growth?
Body Armors Application expected to lead the Market.
7. Are there any restraints impacting market growth?
High Cost Of Production Of Defense Products; Others.
8. Can you provide examples of recent developments in the market?
In April 2023, DuPont launched its innovative products Kevlar, and EXO aramid fibre, which is developed to serve endless applications in body armour where performance and protection is required in the midst of intense and demanding conditions. These products offer an unprecedented combination of lightness, flexibility and protection.
9. What pricing options are available for accessing the report?
Pricing options include single-user, multi-user, and enterprise licenses priced at USD 4750, USD 5250, and USD 8750 respectively.
10. Is the market size provided in terms of value or volume?
The market size is provided in terms of value, measured in Million.
11. Are there any specific market keywords associated with the report?
Yes, the market keyword associated with the report is "Ceramic Armor Materials Market," which aids in identifying and referencing the specific market segment covered.
12. How do I determine which pricing option suits my needs best?
The pricing options vary based on user requirements and access needs. Individual users may opt for single-user licenses, while businesses requiring broader access may choose multi-user or enterprise licenses for cost-effective access to the report.
13. Are there any additional resources or data provided in the Ceramic Armor Materials Market report?
While the report offers comprehensive insights, it's advisable to review the specific contents or supplementary materials provided to ascertain if additional resources or data are available.
14. How can I stay updated on further developments or reports in the Ceramic Armor Materials Market?
To stay informed about further developments, trends, and reports in the Ceramic Armor Materials Market, consider subscribing to industry newsletters, following relevant companies and organizations, or regularly checking reputable industry news sources and publications.
Methodology
Step 1 - Identification of Relevant Samples Size from Population Database


Step 2 - Approaches for Defining Global Market Size (Value, Volume* & Price*)

Note*: In applicable scenarios
Step 3 - Data Sources
Primary Research
- Web Analytics
- Survey Reports
- Research Institute
- Latest Research Reports
- Opinion Leaders
Secondary Research
- Annual Reports
- White Paper
- Latest Press Release
- Industry Association
- Paid Database
- Investor Presentations

Step 4 - Data Triangulation
Involves using different sources of information in order to increase the validity of a study
These sources are likely to be stakeholders in a program - participants, other researchers, program staff, other community members, and so on.
Then we put all data in single framework & apply various statistical tools to find out the dynamic on the market.
During the analysis stage, feedback from the stakeholder groups would be compared to determine areas of agreement as well as areas of divergence