

Key Insights
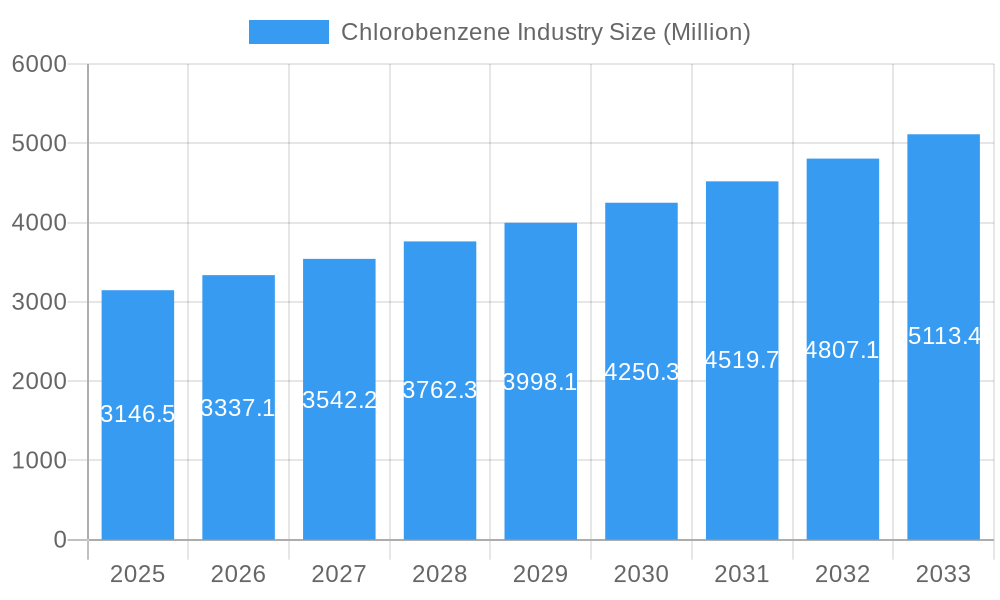
The global chlorobenzene market, valued at $3,146.5 million in 2025, is poised for significant expansion. Projected to grow at a Compound Annual Growth Rate (CAGR) of 3.5% from 2025 to 2033, this growth is underpinned by escalating demand across key industrial sectors. Primary drivers include the increasing requirement for chlorobenzene derivatives in manufacturing pesticides, pharmaceuticals, and advanced polymers such as polyphenylene sulfide (PPS) and polysulfone. While moth control remains a notable application, particularly in household and industrial contexts, the market faces constraints from stringent environmental regulations regarding chlorobenzene handling and disposal. The emergence of eco-friendly alternatives in specific applications, like bio-based pesticides, may temper long-term growth. Geographically, Asia-Pacific, led by China and India, is expected to be the fastest-growing region due to rapid industrialization and robust downstream industry demand. North America and Europe will exhibit steady expansion, supported by established industrial infrastructure and key market participants. Monochlorobenzene currently dominates market segmentation by type, followed by other dichlorobenzene isomers. The competitive environment features a mix of multinational corporations and regional entities, with strategies focused on cost optimization, product portfolio expansion, and technological innovation.
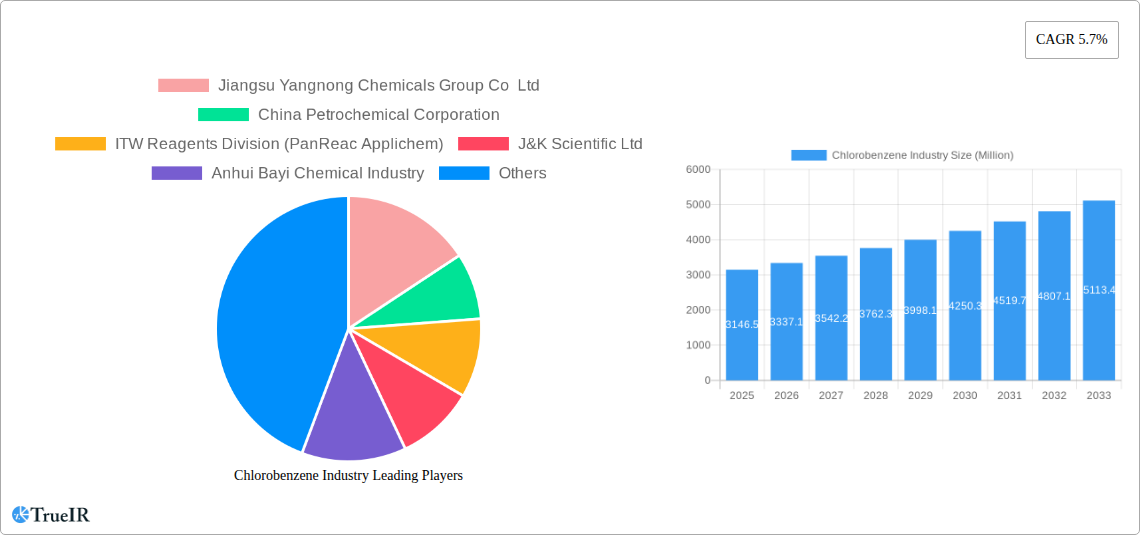
Chlorobenzene Industry Market Size (In Billion)
The forecast period (2025-2033) indicates sustained market growth, reflecting the projected increase in market value. Strategic collaborations, mergers, and acquisitions are anticipated as major players aim to consolidate market share. Innovations in production processes that enhance efficiency and minimize environmental impact will be crucial for long-term profitability. Furthermore, the development of specialized chlorobenzene derivatives for high-growth sectors like electronics and advanced materials will shape market dynamics. Navigating regulatory challenges and embracing sustainable practices will be essential for market access and investor confidence. The chlorobenzene market presents substantial opportunities, contingent upon adept regulatory management and continuous technological adaptation.
Chlorobenzene Industry Company Market Share
Chlorobenzene Industry Market Report: 2019-2033
This comprehensive report provides an in-depth analysis of the global chlorobenzene industry, offering valuable insights into market dynamics, competitive landscape, and future growth prospects. Covering the period from 2019 to 2033, with a focus on 2025, this report is essential for businesses, investors, and researchers seeking to understand and navigate this dynamic market. The report leverages extensive primary and secondary research to deliver precise market sizing and forecasting, crucial for strategic decision-making.
Chlorobenzene Industry Market Structure & Competitive Landscape
The global chlorobenzene market is characterized by a moderately concentrated structure, with key players such as Jiangsu Yangnong Chemicals Group Co Ltd, China Petrochemical Corporation, ITW Reagents Division (PanReac Applichem), J&K Scientific Ltd, Anhui Bayi Chemical Industry, Chemada Fine Chemicals, Kureha Corporation, Tianjin Bohai Chemical Industry Co Ltd, Meryer (Shanghai) Chemical Technology Co Ltd, and Lanxess holding significant market share. The industry's concentration ratio (CR4) is estimated at xx% in 2025, indicating a moderate level of competition. Innovation in production processes, particularly focusing on sustainability and efficiency, remains a key driver. Stringent environmental regulations, especially concerning the disposal of chlorinated byproducts, significantly impact market players. Product substitution pressures from alternative solvents and materials are also present, although limited due to chlorobenzene's unique properties in specific applications. The end-user segmentation is broad, spanning agriculture, textiles, pharmaceuticals, chemicals, paints & coatings, cosmetics & personal care, and other industries. M&A activity in the industry has been relatively moderate in recent years, with an estimated xx Million USD in deal value during 2019-2024. This activity primarily focuses on acquiring specialized production capabilities or expanding geographic reach.
Chlorobenzene Industry Market Trends & Opportunities
The global chlorobenzene market is projected to experience significant growth during the forecast period (2025-2033), with a CAGR of xx%. This growth is driven by several factors, including rising demand from key application sectors like solvents, pesticides, and polymers. Technological advancements in manufacturing processes are increasing production efficiency and reducing costs. Consumer preferences for environmentally friendly products are leading to innovation in sustainable chlorobenzene production methods, though this trend remains nascent. Competitive dynamics are mainly shaped by pricing strategies, production capacities, and access to raw materials. Market penetration rates vary significantly across regions and applications, with the highest penetration observed in established markets with extensive chemical manufacturing sectors. The increasing demand for various consumer and industrial products will drive the growth of the chlorobenzene market.
Dominant Markets & Segments in Chlorobenzene Industry
The chlorobenzene market displays strong regional variations, with xx (region) and xx (country) emerging as dominant markets. This dominance is attributed to several key growth drivers:
- Established chemical manufacturing infrastructure: The presence of mature chemical production facilities lowers production costs.
- Favorable government policies: Supportive regulatory frameworks promote industry growth.
- Strong demand from downstream industries: Significant consumption in application sectors such as solvents and pesticides.
Within the segment breakdown, monochlorobenzene demonstrates the largest market share due to its widespread use as an intermediate in the production of numerous chemicals and its application as a solvent. However, the growth of other segments, such as p-dichlorobenzene (driven by its use in mothballs and deodorants), is also noteworthy. The solvents and pharmaceutical applications are significant contributors to the total market demand. The chemical industry and paint and coating sectors account for the majority of demand, representing xx Million USD and xx Million USD in 2025 respectively.
Chlorobenzene Industry Product Analysis
Significant advancements are focused on improving the efficiency and safety of chlorobenzene production and reducing its environmental footprint. This includes the development of more selective catalysts and improved waste management techniques. The competitiveness of individual chlorobenzene products is primarily driven by cost-effectiveness, purity, and delivery capabilities. Newer product formulations aim to meet growing demand for specific applications, such as in high-performance polymers and specialized solvents.
Key Drivers, Barriers & Challenges in Chlorobenzene Industry
Key Drivers: The primary drivers include the increasing demand from downstream industries such as pharmaceuticals and polymers, ongoing technological advancements leading to improved production efficiency, and the presence of established chemical industry infrastructure in several regions.
Challenges: Key challenges encompass stringent environmental regulations restricting chlorobenzene's use, volatility in raw material prices (especially benzene), and the competitive pressure from alternative solvents. These factors, coupled with the complex supply chain dynamics, can lead to price fluctuations and production bottlenecks, potentially impacting market stability. The stringent environmental regulations in some regions are also limiting the growth of the chlorobenzene market.
Growth Drivers in the Chlorobenzene Industry Market
The chlorobenzene market's growth is fueled by rising demand from diverse sectors, including agriculture (pesticides), pharmaceuticals, and plastics. Technological advancements improving production efficiency and reducing costs are major contributors. Additionally, supportive government policies in some regions are encouraging market expansion.
Challenges Impacting Chlorobenzene Industry Growth
The industry faces significant hurdles, including strict environmental regulations leading to higher production costs and limited applications, fluctuating raw material prices impacting profitability, and increasing competition from alternative chemical substances.
Key Players Shaping the Chlorobenzene Industry Market
- Jiangsu Yangnong Chemicals Group Co Ltd
- China Petrochemical Corporation
- ITW Reagents Division (PanReac Applichem)
- J&K Scientific Ltd
- Anhui Bayi Chemical Industry
- Chemada Fine Chemicals
- Kureha Corporation
- Tianjin Bohai Chemical Industry Co Ltd
- Meryer (Shanghai) Chemical Technology Co Ltd
- Lanxess
Significant Chlorobenzene Industry Milestones
- 2021: Kureha Corporation announced a significant expansion of its chlorobenzene production capacity.
- 2022: New environmental regulations implemented in xx region leading to industry restructuring.
- 2023: Several companies invested in R&D for sustainable chlorobenzene production methods. (Specific examples require further information)
Future Outlook for Chlorobenzene Industry Market
The chlorobenzene market is poised for continued growth, driven by increasing demand from key application sectors and ongoing technological advancements in production methods. Strategic opportunities exist in developing sustainable and cost-effective production processes, exploring new applications for chlorobenzene derivatives, and expanding into high-growth markets. However, careful consideration of environmental regulations and competitive pressures will remain crucial for success.
Chlorobenzene Industry Segmentation
-
1. Type
- 1.1. Monochlorobenzene
- 1.2. o-dichlorobenzene
- 1.3. p-dichlorobenzene
- 1.4. m-Dichlorobenzene
- 1.5. Other Types
-
2. Application
- 2.1. Moth Control
- 2.2. Nitrochlorobenzenes
- 2.3. Polyphenylene Sulfide
- 2.4. Polysulfone Polymers
- 2.5. Solvents
- 2.6. Room and Sanitary Deodorants
- 2.7. Other Applications
Chlorobenzene Industry Segmentation By Geography
-
1. Asia Pacific
- 1.1. China
- 1.2. India
- 1.3. Japan
- 1.4. South Korea
- 1.5. Malaysia
- 1.6. Thailand
- 1.7. Indonesia
- 1.8. Vietnam
- 1.9. Rest of Asia Pacific
-
2. North America
- 2.1. United States
- 2.2. Canada
- 2.3. Mexico
-
3. Europe
- 3.1. Germany
- 3.2. United Kingdom
- 3.3. France
- 3.4. Italy
- 3.5. Spain
- 3.6. Nordic
- 3.7. Turkey
- 3.8. Russia
- 3.9. Rest of Europe
-
4. South America
- 4.1. Brazil
- 4.2. Argentina
- 4.3. Colombia
- 4.4. Rest of South America
- 5. Middle East
-
6. Saudi Arabia
- 6.1. South Africa
- 6.2. Nigeria
- 6.3. Qatar
- 6.4. Egypt
- 6.5. United Arab Emirates
- 6.6. Rest of Middle East
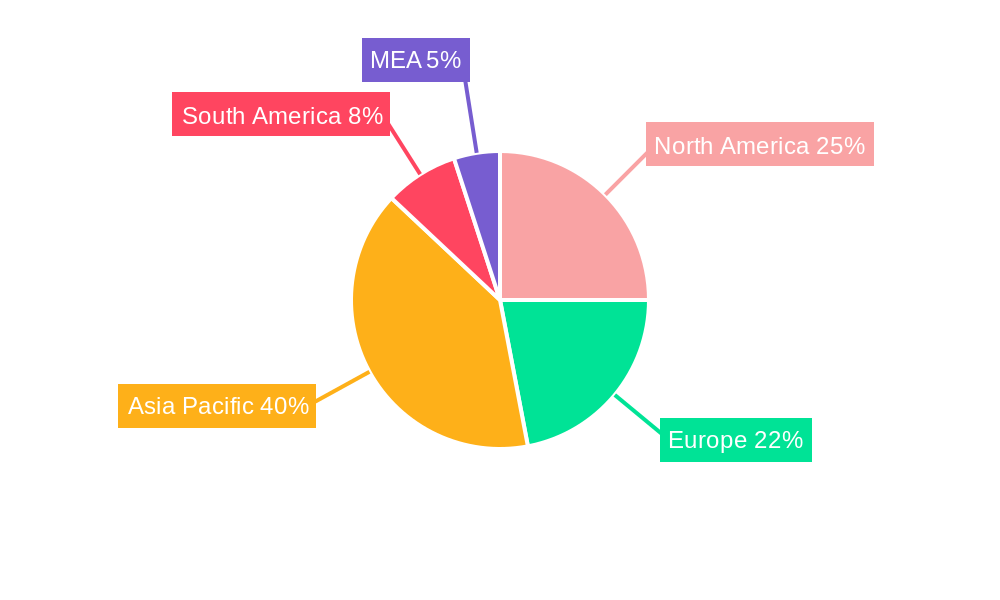
Chlorobenzene Industry Regional Market Share
Geographic Coverage of Chlorobenzene Industry
Chlorobenzene Industry REPORT HIGHLIGHTS
| Aspects | Details |
|---|---|
| Study Period | 2020-2034 |
| Base Year | 2025 |
| Estimated Year | 2026 |
| Forecast Period | 2026-2034 |
| Historical Period | 2020-2025 |
| Growth Rate | CAGR of 3.5% from 2020-2034 |
| Segmentation |
|
Table of Contents
- 1. Introduction
- 1.1. Research Scope
- 1.2. Market Segmentation
- 1.3. Research Objective
- 1.4. Definitions and Assumptions
- 2. Executive Summary
- 2.1. Market Snapshot
- 3. Market Dynamics
- 3.1. Market Drivers
- 3.2. Market Restrains
- 3.3. Market Trends
- 3.4. Market Opportunities
- 4. Market Factor Analysis
- 4.1. Porters Five Forces
- 4.1.1. Bargaining Power of Suppliers
- 4.1.2. Bargaining Power of Buyers
- 4.1.3. Threat of New Entrants
- 4.1.4. Threat of Substitutes
- 4.1.5. Competitive Rivalry
- 4.2. PESTEL analysis
- 4.3. BCG Analysis
- 4.3.1. Stars (High Growth, High Market Share)
- 4.3.2. Cash Cows (Low Growth, High Market Share)
- 4.3.3. Question Mark (High Growth, Low Market Share)
- 4.3.4. Dogs (Low Growth, Low Market Share)
- 4.4. Ansoff Matrix Analysis
- 4.5. Supply Chain Analysis
- 4.6. Regulatory Landscape
- 4.7. Current Market Potential and Opportunity Assessment (TAM–SAM–SOM Framework)
- 4.8. TIR Analyst Note
- 4.1. Porters Five Forces
- 5. Market Analysis, Insights and Forecast 2021-2033
- 5.1. Market Analysis, Insights and Forecast - by Type
- 5.1.1. Monochlorobenzene
- 5.1.2. o-dichlorobenzene
- 5.1.3. p-dichlorobenzene
- 5.1.4. m-Dichlorobenzene
- 5.1.5. Other Types
- 5.2. Market Analysis, Insights and Forecast - by Application
- 5.2.1. Moth Control
- 5.2.2. Nitrochlorobenzenes
- 5.2.3. Polyphenylene Sulfide
- 5.2.4. Polysulfone Polymers
- 5.2.5. Solvents
- 5.2.6. Room and Sanitary Deodorants
- 5.2.7. Other Applications
- 5.3. Market Analysis, Insights and Forecast - by Region
- 5.3.1. Asia Pacific
- 5.3.2. North America
- 5.3.3. Europe
- 5.3.4. South America
- 5.3.5. Middle East
- 5.3.6. Saudi Arabia
- 5.1. Market Analysis, Insights and Forecast - by Type
- 6. Global Chlorobenzene Industry Analysis, Insights and Forecast, 2021-2033
- 6.1. Market Analysis, Insights and Forecast - by Type
- 6.1.1. Monochlorobenzene
- 6.1.2. o-dichlorobenzene
- 6.1.3. p-dichlorobenzene
- 6.1.4. m-Dichlorobenzene
- 6.1.5. Other Types
- 6.2. Market Analysis, Insights and Forecast - by Application
- 6.2.1. Moth Control
- 6.2.2. Nitrochlorobenzenes
- 6.2.3. Polyphenylene Sulfide
- 6.2.4. Polysulfone Polymers
- 6.2.5. Solvents
- 6.2.6. Room and Sanitary Deodorants
- 6.2.7. Other Applications
- 6.1. Market Analysis, Insights and Forecast - by Type
- 7. Asia Pacific Chlorobenzene Industry Analysis, Insights and Forecast, 2020-2032
- 7.1. Market Analysis, Insights and Forecast - by Type
- 7.1.1. Monochlorobenzene
- 7.1.2. o-dichlorobenzene
- 7.1.3. p-dichlorobenzene
- 7.1.4. m-Dichlorobenzene
- 7.1.5. Other Types
- 7.2. Market Analysis, Insights and Forecast - by Application
- 7.2.1. Moth Control
- 7.2.2. Nitrochlorobenzenes
- 7.2.3. Polyphenylene Sulfide
- 7.2.4. Polysulfone Polymers
- 7.2.5. Solvents
- 7.2.6. Room and Sanitary Deodorants
- 7.2.7. Other Applications
- 7.1. Market Analysis, Insights and Forecast - by Type
- 8. North America Chlorobenzene Industry Analysis, Insights and Forecast, 2020-2032
- 8.1. Market Analysis, Insights and Forecast - by Type
- 8.1.1. Monochlorobenzene
- 8.1.2. o-dichlorobenzene
- 8.1.3. p-dichlorobenzene
- 8.1.4. m-Dichlorobenzene
- 8.1.5. Other Types
- 8.2. Market Analysis, Insights and Forecast - by Application
- 8.2.1. Moth Control
- 8.2.2. Nitrochlorobenzenes
- 8.2.3. Polyphenylene Sulfide
- 8.2.4. Polysulfone Polymers
- 8.2.5. Solvents
- 8.2.6. Room and Sanitary Deodorants
- 8.2.7. Other Applications
- 8.1. Market Analysis, Insights and Forecast - by Type
- 9. Europe Chlorobenzene Industry Analysis, Insights and Forecast, 2020-2032
- 9.1. Market Analysis, Insights and Forecast - by Type
- 9.1.1. Monochlorobenzene
- 9.1.2. o-dichlorobenzene
- 9.1.3. p-dichlorobenzene
- 9.1.4. m-Dichlorobenzene
- 9.1.5. Other Types
- 9.2. Market Analysis, Insights and Forecast - by Application
- 9.2.1. Moth Control
- 9.2.2. Nitrochlorobenzenes
- 9.2.3. Polyphenylene Sulfide
- 9.2.4. Polysulfone Polymers
- 9.2.5. Solvents
- 9.2.6. Room and Sanitary Deodorants
- 9.2.7. Other Applications
- 9.1. Market Analysis, Insights and Forecast - by Type
- 10. South America Chlorobenzene Industry Analysis, Insights and Forecast, 2020-2032
- 10.1. Market Analysis, Insights and Forecast - by Type
- 10.1.1. Monochlorobenzene
- 10.1.2. o-dichlorobenzene
- 10.1.3. p-dichlorobenzene
- 10.1.4. m-Dichlorobenzene
- 10.1.5. Other Types
- 10.2. Market Analysis, Insights and Forecast - by Application
- 10.2.1. Moth Control
- 10.2.2. Nitrochlorobenzenes
- 10.2.3. Polyphenylene Sulfide
- 10.2.4. Polysulfone Polymers
- 10.2.5. Solvents
- 10.2.6. Room and Sanitary Deodorants
- 10.2.7. Other Applications
- 10.1. Market Analysis, Insights and Forecast - by Type
- 11. Middle East Chlorobenzene Industry Analysis, Insights and Forecast, 2020-2032
- 11.1. Market Analysis, Insights and Forecast - by Type
- 11.1.1. Monochlorobenzene
- 11.1.2. o-dichlorobenzene
- 11.1.3. p-dichlorobenzene
- 11.1.4. m-Dichlorobenzene
- 11.1.5. Other Types
- 11.2. Market Analysis, Insights and Forecast - by Application
- 11.2.1. Moth Control
- 11.2.2. Nitrochlorobenzenes
- 11.2.3. Polyphenylene Sulfide
- 11.2.4. Polysulfone Polymers
- 11.2.5. Solvents
- 11.2.6. Room and Sanitary Deodorants
- 11.2.7. Other Applications
- 11.1. Market Analysis, Insights and Forecast - by Type
- 12. Saudi Arabia Chlorobenzene Industry Analysis, Insights and Forecast, 2020-2032
- 12.1. Market Analysis, Insights and Forecast - by Type
- 12.1.1. Monochlorobenzene
- 12.1.2. o-dichlorobenzene
- 12.1.3. p-dichlorobenzene
- 12.1.4. m-Dichlorobenzene
- 12.1.5. Other Types
- 12.2. Market Analysis, Insights and Forecast - by Application
- 12.2.1. Moth Control
- 12.2.2. Nitrochlorobenzenes
- 12.2.3. Polyphenylene Sulfide
- 12.2.4. Polysulfone Polymers
- 12.2.5. Solvents
- 12.2.6. Room and Sanitary Deodorants
- 12.2.7. Other Applications
- 12.1. Market Analysis, Insights and Forecast - by Type
- 13. Competitive Analysis
- 13.1. Company Profiles
- 13.1.1 Jiangsu Yangnong Chemicals Group Co Ltd
- 13.1.1.1. Company Overview
- 13.1.1.2. Products
- 13.1.1.3. Company Financials
- 13.1.1.4. SWOT Analysis
- 13.1.2 China Petrochemical Corporation
- 13.1.2.1. Company Overview
- 13.1.2.2. Products
- 13.1.2.3. Company Financials
- 13.1.2.4. SWOT Analysis
- 13.1.3 ITW Reagents Division (PanReac Applichem)
- 13.1.3.1. Company Overview
- 13.1.3.2. Products
- 13.1.3.3. Company Financials
- 13.1.3.4. SWOT Analysis
- 13.1.4 J&K Scientific Ltd
- 13.1.4.1. Company Overview
- 13.1.4.2. Products
- 13.1.4.3. Company Financials
- 13.1.4.4. SWOT Analysis
- 13.1.5 Anhui Bayi Chemical Industry
- 13.1.5.1. Company Overview
- 13.1.5.2. Products
- 13.1.5.3. Company Financials
- 13.1.5.4. SWOT Analysis
- 13.1.6 Chemada Fine Chemicals
- 13.1.6.1. Company Overview
- 13.1.6.2. Products
- 13.1.6.3. Company Financials
- 13.1.6.4. SWOT Analysis
- 13.1.7 Kureha Corporation
- 13.1.7.1. Company Overview
- 13.1.7.2. Products
- 13.1.7.3. Company Financials
- 13.1.7.4. SWOT Analysis
- 13.1.8 Tianjin Bohai Chemical Industry Co Ltd
- 13.1.8.1. Company Overview
- 13.1.8.2. Products
- 13.1.8.3. Company Financials
- 13.1.8.4. SWOT Analysis
- 13.1.9 Meryer (Shanghai) Chemical Technology Co Ltd
- 13.1.9.1. Company Overview
- 13.1.9.2. Products
- 13.1.9.3. Company Financials
- 13.1.9.4. SWOT Analysis
- 13.1.10 Lanxess
- 13.1.10.1. Company Overview
- 13.1.10.2. Products
- 13.1.10.3. Company Financials
- 13.1.10.4. SWOT Analysis
- 13.1.1 Jiangsu Yangnong Chemicals Group Co Ltd
- 13.2. Market Entropy
- 13.2.1 Company's Key Areas Served
- 13.2.2 Recent Developments
- 13.3. Company Market Share Analysis 2025
- 13.3.1 Top 5 Companies Market Share Analysis
- 13.3.2 Top 3 Companies Market Share Analysis
- 13.4. List of Potential Customers
- 14. Research Methodology
List of Figures
- Figure 1: Global Chlorobenzene Industry Revenue Breakdown (million, %) by Region 2025 & 2033
- Figure 2: Global Chlorobenzene Industry Volume Breakdown (K Tons, %) by Region 2025 & 2033
- Figure 3: Asia Pacific Chlorobenzene Industry Revenue (million), by Type 2025 & 2033
- Figure 4: Asia Pacific Chlorobenzene Industry Volume (K Tons), by Type 2025 & 2033
- Figure 5: Asia Pacific Chlorobenzene Industry Revenue Share (%), by Type 2025 & 2033
- Figure 6: Asia Pacific Chlorobenzene Industry Volume Share (%), by Type 2025 & 2033
- Figure 7: Asia Pacific Chlorobenzene Industry Revenue (million), by Application 2025 & 2033
- Figure 8: Asia Pacific Chlorobenzene Industry Volume (K Tons), by Application 2025 & 2033
- Figure 9: Asia Pacific Chlorobenzene Industry Revenue Share (%), by Application 2025 & 2033
- Figure 10: Asia Pacific Chlorobenzene Industry Volume Share (%), by Application 2025 & 2033
- Figure 11: Asia Pacific Chlorobenzene Industry Revenue (million), by Country 2025 & 2033
- Figure 12: Asia Pacific Chlorobenzene Industry Volume (K Tons), by Country 2025 & 2033
- Figure 13: Asia Pacific Chlorobenzene Industry Revenue Share (%), by Country 2025 & 2033
- Figure 14: Asia Pacific Chlorobenzene Industry Volume Share (%), by Country 2025 & 2033
- Figure 15: North America Chlorobenzene Industry Revenue (million), by Type 2025 & 2033
- Figure 16: North America Chlorobenzene Industry Volume (K Tons), by Type 2025 & 2033
- Figure 17: North America Chlorobenzene Industry Revenue Share (%), by Type 2025 & 2033
- Figure 18: North America Chlorobenzene Industry Volume Share (%), by Type 2025 & 2033
- Figure 19: North America Chlorobenzene Industry Revenue (million), by Application 2025 & 2033
- Figure 20: North America Chlorobenzene Industry Volume (K Tons), by Application 2025 & 2033
- Figure 21: North America Chlorobenzene Industry Revenue Share (%), by Application 2025 & 2033
- Figure 22: North America Chlorobenzene Industry Volume Share (%), by Application 2025 & 2033
- Figure 23: North America Chlorobenzene Industry Revenue (million), by Country 2025 & 2033
- Figure 24: North America Chlorobenzene Industry Volume (K Tons), by Country 2025 & 2033
- Figure 25: North America Chlorobenzene Industry Revenue Share (%), by Country 2025 & 2033
- Figure 26: North America Chlorobenzene Industry Volume Share (%), by Country 2025 & 2033
- Figure 27: Europe Chlorobenzene Industry Revenue (million), by Type 2025 & 2033
- Figure 28: Europe Chlorobenzene Industry Volume (K Tons), by Type 2025 & 2033
- Figure 29: Europe Chlorobenzene Industry Revenue Share (%), by Type 2025 & 2033
- Figure 30: Europe Chlorobenzene Industry Volume Share (%), by Type 2025 & 2033
- Figure 31: Europe Chlorobenzene Industry Revenue (million), by Application 2025 & 2033
- Figure 32: Europe Chlorobenzene Industry Volume (K Tons), by Application 2025 & 2033
- Figure 33: Europe Chlorobenzene Industry Revenue Share (%), by Application 2025 & 2033
- Figure 34: Europe Chlorobenzene Industry Volume Share (%), by Application 2025 & 2033
- Figure 35: Europe Chlorobenzene Industry Revenue (million), by Country 2025 & 2033
- Figure 36: Europe Chlorobenzene Industry Volume (K Tons), by Country 2025 & 2033
- Figure 37: Europe Chlorobenzene Industry Revenue Share (%), by Country 2025 & 2033
- Figure 38: Europe Chlorobenzene Industry Volume Share (%), by Country 2025 & 2033
- Figure 39: South America Chlorobenzene Industry Revenue (million), by Type 2025 & 2033
- Figure 40: South America Chlorobenzene Industry Volume (K Tons), by Type 2025 & 2033
- Figure 41: South America Chlorobenzene Industry Revenue Share (%), by Type 2025 & 2033
- Figure 42: South America Chlorobenzene Industry Volume Share (%), by Type 2025 & 2033
- Figure 43: South America Chlorobenzene Industry Revenue (million), by Application 2025 & 2033
- Figure 44: South America Chlorobenzene Industry Volume (K Tons), by Application 2025 & 2033
- Figure 45: South America Chlorobenzene Industry Revenue Share (%), by Application 2025 & 2033
- Figure 46: South America Chlorobenzene Industry Volume Share (%), by Application 2025 & 2033
- Figure 47: South America Chlorobenzene Industry Revenue (million), by Country 2025 & 2033
- Figure 48: South America Chlorobenzene Industry Volume (K Tons), by Country 2025 & 2033
- Figure 49: South America Chlorobenzene Industry Revenue Share (%), by Country 2025 & 2033
- Figure 50: South America Chlorobenzene Industry Volume Share (%), by Country 2025 & 2033
- Figure 51: Middle East Chlorobenzene Industry Revenue (million), by Type 2025 & 2033
- Figure 52: Middle East Chlorobenzene Industry Volume (K Tons), by Type 2025 & 2033
- Figure 53: Middle East Chlorobenzene Industry Revenue Share (%), by Type 2025 & 2033
- Figure 54: Middle East Chlorobenzene Industry Volume Share (%), by Type 2025 & 2033
- Figure 55: Middle East Chlorobenzene Industry Revenue (million), by Application 2025 & 2033
- Figure 56: Middle East Chlorobenzene Industry Volume (K Tons), by Application 2025 & 2033
- Figure 57: Middle East Chlorobenzene Industry Revenue Share (%), by Application 2025 & 2033
- Figure 58: Middle East Chlorobenzene Industry Volume Share (%), by Application 2025 & 2033
- Figure 59: Middle East Chlorobenzene Industry Revenue (million), by Country 2025 & 2033
- Figure 60: Middle East Chlorobenzene Industry Volume (K Tons), by Country 2025 & 2033
- Figure 61: Middle East Chlorobenzene Industry Revenue Share (%), by Country 2025 & 2033
- Figure 62: Middle East Chlorobenzene Industry Volume Share (%), by Country 2025 & 2033
- Figure 63: Saudi Arabia Chlorobenzene Industry Revenue (million), by Type 2025 & 2033
- Figure 64: Saudi Arabia Chlorobenzene Industry Volume (K Tons), by Type 2025 & 2033
- Figure 65: Saudi Arabia Chlorobenzene Industry Revenue Share (%), by Type 2025 & 2033
- Figure 66: Saudi Arabia Chlorobenzene Industry Volume Share (%), by Type 2025 & 2033
- Figure 67: Saudi Arabia Chlorobenzene Industry Revenue (million), by Application 2025 & 2033
- Figure 68: Saudi Arabia Chlorobenzene Industry Volume (K Tons), by Application 2025 & 2033
- Figure 69: Saudi Arabia Chlorobenzene Industry Revenue Share (%), by Application 2025 & 2033
- Figure 70: Saudi Arabia Chlorobenzene Industry Volume Share (%), by Application 2025 & 2033
- Figure 71: Saudi Arabia Chlorobenzene Industry Revenue (million), by Country 2025 & 2033
- Figure 72: Saudi Arabia Chlorobenzene Industry Volume (K Tons), by Country 2025 & 2033
- Figure 73: Saudi Arabia Chlorobenzene Industry Revenue Share (%), by Country 2025 & 2033
- Figure 74: Saudi Arabia Chlorobenzene Industry Volume Share (%), by Country 2025 & 2033
List of Tables
- Table 1: Global Chlorobenzene Industry Revenue million Forecast, by Type 2020 & 2033
- Table 2: Global Chlorobenzene Industry Volume K Tons Forecast, by Type 2020 & 2033
- Table 3: Global Chlorobenzene Industry Revenue million Forecast, by Application 2020 & 2033
- Table 4: Global Chlorobenzene Industry Volume K Tons Forecast, by Application 2020 & 2033
- Table 5: Global Chlorobenzene Industry Revenue million Forecast, by Region 2020 & 2033
- Table 6: Global Chlorobenzene Industry Volume K Tons Forecast, by Region 2020 & 2033
- Table 7: Global Chlorobenzene Industry Revenue million Forecast, by Type 2020 & 2033
- Table 8: Global Chlorobenzene Industry Volume K Tons Forecast, by Type 2020 & 2033
- Table 9: Global Chlorobenzene Industry Revenue million Forecast, by Application 2020 & 2033
- Table 10: Global Chlorobenzene Industry Volume K Tons Forecast, by Application 2020 & 2033
- Table 11: Global Chlorobenzene Industry Revenue million Forecast, by Country 2020 & 2033
- Table 12: Global Chlorobenzene Industry Volume K Tons Forecast, by Country 2020 & 2033
- Table 13: China Chlorobenzene Industry Revenue (million) Forecast, by Application 2020 & 2033
- Table 14: China Chlorobenzene Industry Volume (K Tons) Forecast, by Application 2020 & 2033
- Table 15: India Chlorobenzene Industry Revenue (million) Forecast, by Application 2020 & 2033
- Table 16: India Chlorobenzene Industry Volume (K Tons) Forecast, by Application 2020 & 2033
- Table 17: Japan Chlorobenzene Industry Revenue (million) Forecast, by Application 2020 & 2033
- Table 18: Japan Chlorobenzene Industry Volume (K Tons) Forecast, by Application 2020 & 2033
- Table 19: South Korea Chlorobenzene Industry Revenue (million) Forecast, by Application 2020 & 2033
- Table 20: South Korea Chlorobenzene Industry Volume (K Tons) Forecast, by Application 2020 & 2033
- Table 21: Malaysia Chlorobenzene Industry Revenue (million) Forecast, by Application 2020 & 2033
- Table 22: Malaysia Chlorobenzene Industry Volume (K Tons) Forecast, by Application 2020 & 2033
- Table 23: Thailand Chlorobenzene Industry Revenue (million) Forecast, by Application 2020 & 2033
- Table 24: Thailand Chlorobenzene Industry Volume (K Tons) Forecast, by Application 2020 & 2033
- Table 25: Indonesia Chlorobenzene Industry Revenue (million) Forecast, by Application 2020 & 2033
- Table 26: Indonesia Chlorobenzene Industry Volume (K Tons) Forecast, by Application 2020 & 2033
- Table 27: Vietnam Chlorobenzene Industry Revenue (million) Forecast, by Application 2020 & 2033
- Table 28: Vietnam Chlorobenzene Industry Volume (K Tons) Forecast, by Application 2020 & 2033
- Table 29: Rest of Asia Pacific Chlorobenzene Industry Revenue (million) Forecast, by Application 2020 & 2033
- Table 30: Rest of Asia Pacific Chlorobenzene Industry Volume (K Tons) Forecast, by Application 2020 & 2033
- Table 31: Global Chlorobenzene Industry Revenue million Forecast, by Type 2020 & 2033
- Table 32: Global Chlorobenzene Industry Volume K Tons Forecast, by Type 2020 & 2033
- Table 33: Global Chlorobenzene Industry Revenue million Forecast, by Application 2020 & 2033
- Table 34: Global Chlorobenzene Industry Volume K Tons Forecast, by Application 2020 & 2033
- Table 35: Global Chlorobenzene Industry Revenue million Forecast, by Country 2020 & 2033
- Table 36: Global Chlorobenzene Industry Volume K Tons Forecast, by Country 2020 & 2033
- Table 37: United States Chlorobenzene Industry Revenue (million) Forecast, by Application 2020 & 2033
- Table 38: United States Chlorobenzene Industry Volume (K Tons) Forecast, by Application 2020 & 2033
- Table 39: Canada Chlorobenzene Industry Revenue (million) Forecast, by Application 2020 & 2033
- Table 40: Canada Chlorobenzene Industry Volume (K Tons) Forecast, by Application 2020 & 2033
- Table 41: Mexico Chlorobenzene Industry Revenue (million) Forecast, by Application 2020 & 2033
- Table 42: Mexico Chlorobenzene Industry Volume (K Tons) Forecast, by Application 2020 & 2033
- Table 43: Global Chlorobenzene Industry Revenue million Forecast, by Type 2020 & 2033
- Table 44: Global Chlorobenzene Industry Volume K Tons Forecast, by Type 2020 & 2033
- Table 45: Global Chlorobenzene Industry Revenue million Forecast, by Application 2020 & 2033
- Table 46: Global Chlorobenzene Industry Volume K Tons Forecast, by Application 2020 & 2033
- Table 47: Global Chlorobenzene Industry Revenue million Forecast, by Country 2020 & 2033
- Table 48: Global Chlorobenzene Industry Volume K Tons Forecast, by Country 2020 & 2033
- Table 49: Germany Chlorobenzene Industry Revenue (million) Forecast, by Application 2020 & 2033
- Table 50: Germany Chlorobenzene Industry Volume (K Tons) Forecast, by Application 2020 & 2033
- Table 51: United Kingdom Chlorobenzene Industry Revenue (million) Forecast, by Application 2020 & 2033
- Table 52: United Kingdom Chlorobenzene Industry Volume (K Tons) Forecast, by Application 2020 & 2033
- Table 53: France Chlorobenzene Industry Revenue (million) Forecast, by Application 2020 & 2033
- Table 54: France Chlorobenzene Industry Volume (K Tons) Forecast, by Application 2020 & 2033
- Table 55: Italy Chlorobenzene Industry Revenue (million) Forecast, by Application 2020 & 2033
- Table 56: Italy Chlorobenzene Industry Volume (K Tons) Forecast, by Application 2020 & 2033
- Table 57: Spain Chlorobenzene Industry Revenue (million) Forecast, by Application 2020 & 2033
- Table 58: Spain Chlorobenzene Industry Volume (K Tons) Forecast, by Application 2020 & 2033
- Table 59: Nordic Chlorobenzene Industry Revenue (million) Forecast, by Application 2020 & 2033
- Table 60: Nordic Chlorobenzene Industry Volume (K Tons) Forecast, by Application 2020 & 2033
- Table 61: Turkey Chlorobenzene Industry Revenue (million) Forecast, by Application 2020 & 2033
- Table 62: Turkey Chlorobenzene Industry Volume (K Tons) Forecast, by Application 2020 & 2033
- Table 63: Russia Chlorobenzene Industry Revenue (million) Forecast, by Application 2020 & 2033
- Table 64: Russia Chlorobenzene Industry Volume (K Tons) Forecast, by Application 2020 & 2033
- Table 65: Rest of Europe Chlorobenzene Industry Revenue (million) Forecast, by Application 2020 & 2033
- Table 66: Rest of Europe Chlorobenzene Industry Volume (K Tons) Forecast, by Application 2020 & 2033
- Table 67: Global Chlorobenzene Industry Revenue million Forecast, by Type 2020 & 2033
- Table 68: Global Chlorobenzene Industry Volume K Tons Forecast, by Type 2020 & 2033
- Table 69: Global Chlorobenzene Industry Revenue million Forecast, by Application 2020 & 2033
- Table 70: Global Chlorobenzene Industry Volume K Tons Forecast, by Application 2020 & 2033
- Table 71: Global Chlorobenzene Industry Revenue million Forecast, by Country 2020 & 2033
- Table 72: Global Chlorobenzene Industry Volume K Tons Forecast, by Country 2020 & 2033
- Table 73: Brazil Chlorobenzene Industry Revenue (million) Forecast, by Application 2020 & 2033
- Table 74: Brazil Chlorobenzene Industry Volume (K Tons) Forecast, by Application 2020 & 2033
- Table 75: Argentina Chlorobenzene Industry Revenue (million) Forecast, by Application 2020 & 2033
- Table 76: Argentina Chlorobenzene Industry Volume (K Tons) Forecast, by Application 2020 & 2033
- Table 77: Colombia Chlorobenzene Industry Revenue (million) Forecast, by Application 2020 & 2033
- Table 78: Colombia Chlorobenzene Industry Volume (K Tons) Forecast, by Application 2020 & 2033
- Table 79: Rest of South America Chlorobenzene Industry Revenue (million) Forecast, by Application 2020 & 2033
- Table 80: Rest of South America Chlorobenzene Industry Volume (K Tons) Forecast, by Application 2020 & 2033
- Table 81: Global Chlorobenzene Industry Revenue million Forecast, by Type 2020 & 2033
- Table 82: Global Chlorobenzene Industry Volume K Tons Forecast, by Type 2020 & 2033
- Table 83: Global Chlorobenzene Industry Revenue million Forecast, by Application 2020 & 2033
- Table 84: Global Chlorobenzene Industry Volume K Tons Forecast, by Application 2020 & 2033
- Table 85: Global Chlorobenzene Industry Revenue million Forecast, by Country 2020 & 2033
- Table 86: Global Chlorobenzene Industry Volume K Tons Forecast, by Country 2020 & 2033
- Table 87: Global Chlorobenzene Industry Revenue million Forecast, by Type 2020 & 2033
- Table 88: Global Chlorobenzene Industry Volume K Tons Forecast, by Type 2020 & 2033
- Table 89: Global Chlorobenzene Industry Revenue million Forecast, by Application 2020 & 2033
- Table 90: Global Chlorobenzene Industry Volume K Tons Forecast, by Application 2020 & 2033
- Table 91: Global Chlorobenzene Industry Revenue million Forecast, by Country 2020 & 2033
- Table 92: Global Chlorobenzene Industry Volume K Tons Forecast, by Country 2020 & 2033
- Table 93: South Africa Chlorobenzene Industry Revenue (million) Forecast, by Application 2020 & 2033
- Table 94: South Africa Chlorobenzene Industry Volume (K Tons) Forecast, by Application 2020 & 2033
- Table 95: Nigeria Chlorobenzene Industry Revenue (million) Forecast, by Application 2020 & 2033
- Table 96: Nigeria Chlorobenzene Industry Volume (K Tons) Forecast, by Application 2020 & 2033
- Table 97: Qatar Chlorobenzene Industry Revenue (million) Forecast, by Application 2020 & 2033
- Table 98: Qatar Chlorobenzene Industry Volume (K Tons) Forecast, by Application 2020 & 2033
- Table 99: Egypt Chlorobenzene Industry Revenue (million) Forecast, by Application 2020 & 2033
- Table 100: Egypt Chlorobenzene Industry Volume (K Tons) Forecast, by Application 2020 & 2033
- Table 101: United Arab Emirates Chlorobenzene Industry Revenue (million) Forecast, by Application 2020 & 2033
- Table 102: United Arab Emirates Chlorobenzene Industry Volume (K Tons) Forecast, by Application 2020 & 2033
- Table 103: Rest of Middle East Chlorobenzene Industry Revenue (million) Forecast, by Application 2020 & 2033
- Table 104: Rest of Middle East Chlorobenzene Industry Volume (K Tons) Forecast, by Application 2020 & 2033
Frequently Asked Questions
1. What is the projected Compound Annual Growth Rate (CAGR) of the Chlorobenzene Industry?
The projected CAGR is approximately 3.5%.
2. Which companies are prominent players in the Chlorobenzene Industry?
Key companies in the market include Jiangsu Yangnong Chemicals Group Co Ltd, China Petrochemical Corporation, ITW Reagents Division (PanReac Applichem), J&K Scientific Ltd, Anhui Bayi Chemical Industry, Chemada Fine Chemicals, Kureha Corporation, Tianjin Bohai Chemical Industry Co Ltd , Meryer (Shanghai) Chemical Technology Co Ltd, Lanxess.
3. What are the main segments of the Chlorobenzene Industry?
The market segments include Type, Application.
4. Can you provide details about the market size?
The market size is estimated to be USD 2357 million as of 2022.
5. What are some drivers contributing to market growth?
Rising demand for Nitrochlorobenzene; Surging Application in the Chemical Industry; Other Drivers.
6. What are the notable trends driving market growth?
Nitrochlorobenzenes to Dominate the Market.
7. Are there any restraints impacting market growth?
Detrimental Effects of Chlorobenzene Exposure; Other Restraints.
8. Can you provide examples of recent developments in the market?
N/A
9. What pricing options are available for accessing the report?
Pricing options include single-user, multi-user, and enterprise licenses priced at USD 4750, USD 5250, and USD 8750 respectively.
10. Is the market size provided in terms of value or volume?
The market size is provided in terms of value, measured in million and volume, measured in K Tons.
11. Are there any specific market keywords associated with the report?
Yes, the market keyword associated with the report is "Chlorobenzene Industry," which aids in identifying and referencing the specific market segment covered.
12. How do I determine which pricing option suits my needs best?
The pricing options vary based on user requirements and access needs. Individual users may opt for single-user licenses, while businesses requiring broader access may choose multi-user or enterprise licenses for cost-effective access to the report.
13. Are there any additional resources or data provided in the Chlorobenzene Industry report?
While the report offers comprehensive insights, it's advisable to review the specific contents or supplementary materials provided to ascertain if additional resources or data are available.
14. How can I stay updated on further developments or reports in the Chlorobenzene Industry?
To stay informed about further developments, trends, and reports in the Chlorobenzene Industry, consider subscribing to industry newsletters, following relevant companies and organizations, or regularly checking reputable industry news sources and publications.
Methodology
Step 1 - Identification of Relevant Samples Size from Population Database


Step 2 - Approaches for Defining Global Market Size (Value, Volume* & Price*)

Note*: In applicable scenarios
Step 3 - Data Sources
Primary Research
- Web Analytics
- Survey Reports
- Research Institute
- Latest Research Reports
- Opinion Leaders
Secondary Research
- Annual Reports
- White Paper
- Latest Press Release
- Industry Association
- Paid Database
- Investor Presentations

Step 4 - Data Triangulation
Involves using different sources of information in order to increase the validity of a study
These sources are likely to be stakeholders in a program - participants, other researchers, program staff, other community members, and so on.
Then we put all data in single framework & apply various statistical tools to find out the dynamic on the market.
During the analysis stage, feedback from the stakeholder groups would be compared to determine areas of agreement as well as areas of divergence