

Key Insights
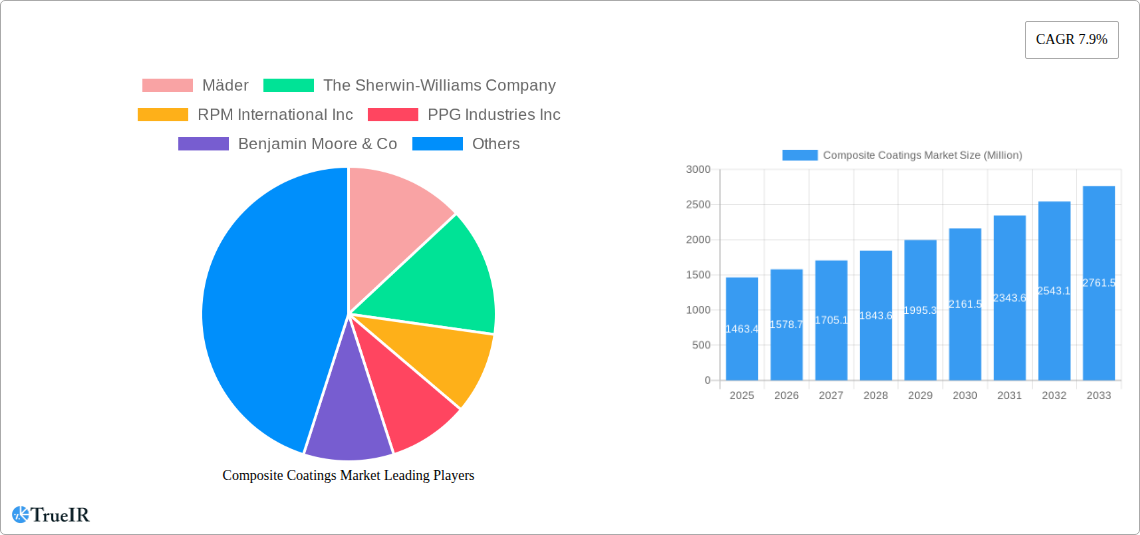
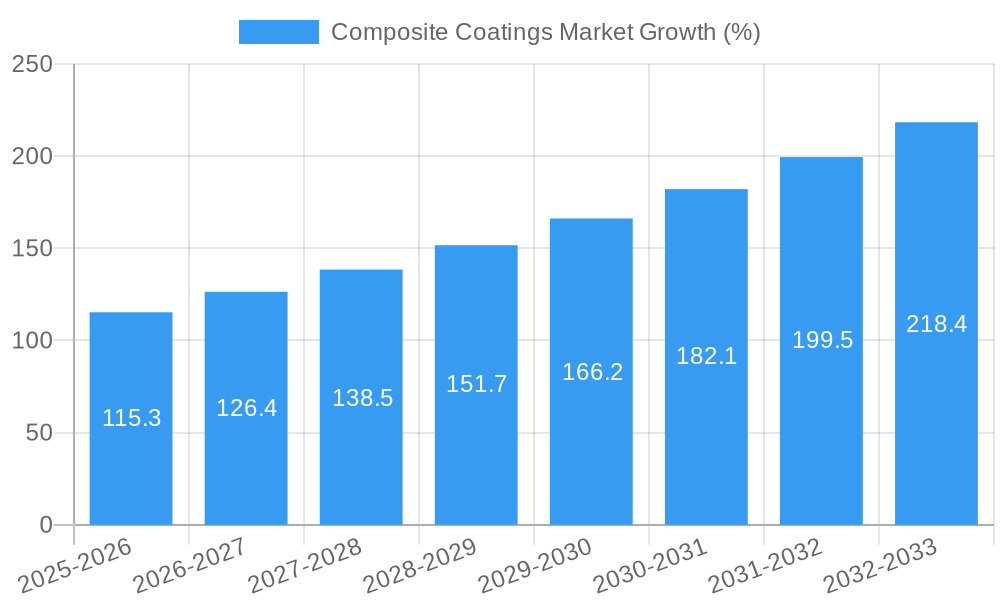
The global composite coatings market, valued at $1463.4 million in 2025, is projected to experience robust growth, exhibiting a compound annual growth rate (CAGR) of 7.9% from 2025 to 2033. This expansion is driven by several key factors. The increasing demand for lightweight yet high-strength materials in diverse sectors like automotive and marine industries fuels the adoption of composite materials, consequently boosting the demand for protective and performance-enhancing coatings. Technological advancements in coating techniques, such as laser-melt injection and electroless plating, are improving the durability and functionality of these coatings, further driving market growth. The rising focus on infrastructure development globally, particularly in emerging economies, presents significant opportunities for composite coatings in applications like bridge decks and pipelines, providing corrosion protection and extending the lifespan of these structures. The growth is also fueled by stringent environmental regulations promoting the use of eco-friendly coatings and the increasing adoption of advanced composite materials in the oil and gas industry to withstand harsh operational conditions.
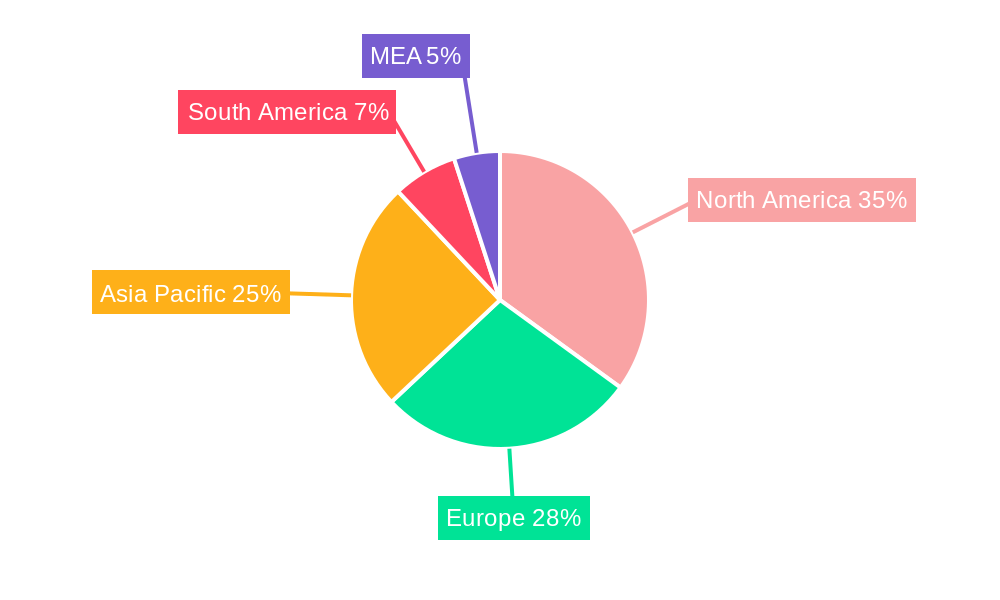
However, certain restraints are expected to influence market growth. High initial investment costs associated with advanced coating technologies and the complexity of applying these coatings to complex composite structures might hinder market penetration, especially among smaller companies. Furthermore, the availability of skilled labor to apply these specialized coatings and the potential environmental concerns associated with certain coating materials remain challenges that need to be addressed. Despite these limitations, the market is segmented by resin type (polyester, polyamide, epoxy, and others), application technique (laser-melt injection, electroless plating, brazing, and others), and end-user industry (marine, automotive, infrastructure, oil and gas, and others including medical). Regional analysis indicates strong growth across North America, Europe, and Asia Pacific, driven by significant industrial activity and infrastructure projects. The market is characterized by several key players, including Mäder, Sherwin-Williams, RPM International, PPG Industries, and AkzoNobel, constantly innovating and expanding their product portfolios to cater to the evolving needs of various industries.
Dynamic Composite Coatings Market Report: 2019-2033
This comprehensive report provides an in-depth analysis of the global Composite Coatings Market, offering invaluable insights for businesses, investors, and researchers. With a detailed study period spanning 2019-2033 (Base Year: 2025, Estimated Year: 2025, Forecast Period: 2025-2033, Historical Period: 2019-2024), this report meticulously examines market trends, competitive dynamics, and future growth potential. The market is projected to reach xx Million by 2033, exhibiting a robust CAGR of xx%.
Composite Coatings Market Market Structure & Competitive Landscape
The Composite Coatings Market exhibits a moderately consolidated structure, with key players like Mäder, The Sherwin-Williams Company (Sherwin-Williams), RPM International Inc (RPM International), PPG Industries Inc (PPG Industries), Benjamin Moore & Co (Benjamin Moore), AkzoNobel NV (AkzoNobel), FUSION MINERAL PAINT, KEIM Mineral Coatings of America Inc, K C Jones Plating Company, and BEECK Mineral Paints holding significant market share. The Herfindahl-Hirschman Index (HHI) is estimated at xx, indicating a moderately concentrated market.
Innovation in resin types (Polyester, Polyamide, Epoxy, and Others) and application techniques (Laser-melt Injection, Electroless Plating, Brazing, and Others) are key drivers of market growth. Stringent environmental regulations concerning volatile organic compounds (VOCs) are influencing product development towards more sustainable options. The market witnesses continuous product substitution, with newer, high-performance coatings replacing older technologies. End-user segmentation across Marine, Automotive and Other Transportation, Infrastructure, Oil and Gas, and Others (Including Medical) presents diverse growth opportunities. Mergers and acquisitions (M&A) activity within the last five years has been moderate, with approximately xx deals reported, primarily focused on expanding product portfolios and geographical reach.
Composite Coatings Market Market Trends & Opportunities
The global Composite Coatings Market is experiencing substantial growth, driven by increasing demand from diverse end-use industries. The market size was valued at xx Million in 2024 and is projected to reach xx Million by 2033, exhibiting a CAGR of xx%. Technological advancements, such as the development of nanotechnology-based coatings with enhanced durability and corrosion resistance, are significantly impacting market dynamics. Consumer preference for aesthetically pleasing and environmentally friendly coatings is shaping product development strategies. Intense competition among established players and emerging market entrants is fostering innovation and driving down prices. Market penetration rates for advanced composite coatings are steadily increasing, particularly in the automotive and infrastructure sectors. Specific regional markets, such as [mention specific region showing high growth] are demonstrating particularly high growth rates, driven by [mention specific factors driving growth in that region].
Dominant Markets & Segments in Composite Coatings Market
The Automotive and Other Transportation segment currently dominates the Composite Coatings Market, accounting for approximately xx% of the total market share in 2025. This is primarily driven by the increasing demand for lightweight, high-performance vehicles and the rising adoption of advanced materials in automotive manufacturing.
- Key Growth Drivers for Automotive & Transportation:
- Increasing demand for lightweight vehicles to improve fuel efficiency.
- Growing adoption of advanced composite materials in automotive manufacturing.
- Stringent emission regulations driving the need for corrosion-resistant coatings.
The Polyester resin type holds the largest share within the resin segment due to its cost-effectiveness and versatility. Geographically, [mention dominant region/country] is currently the leading market, driven by strong industrial growth and supportive government policies. The Infrastructure sector is also poised for significant growth, driven by increasing investments in infrastructure development projects globally. The adoption of Electroless Plating technique is experiencing significant growth due to its ability to provide uniform and durable coatings on complex shapes.
Composite Coatings Market Product Analysis
Recent product innovations focus on enhancing the durability, corrosion resistance, and aesthetic appeal of composite coatings. The market is seeing a surge in eco-friendly, low-VOC coatings that meet stringent environmental regulations. Key competitive advantages include superior performance characteristics, longer lifespan, and cost-effectiveness. Technological advancements, such as nanotechnology and bio-based coatings, are leading to a new generation of high-performance products. These advancements contribute to better market fit by addressing the growing demand for sustainable and high-performing solutions across diverse applications.
Key Drivers, Barriers & Challenges in Composite Coatings Market
Key Drivers: The market is propelled by increasing demand from various sectors such as automotive, marine, and infrastructure, driven by the need for lightweight, durable, and corrosion-resistant materials. Government regulations promoting the use of sustainable and eco-friendly coatings also stimulate market growth. Technological advancements, such as nanotechnology and the development of novel resin systems, further contribute to market expansion.
Challenges & Restraints: Fluctuations in raw material prices pose a significant challenge. Supply chain disruptions can lead to production delays and increased costs, impacting profitability. Stringent environmental regulations and compliance requirements necessitate considerable investments in research and development of eco-friendly alternatives. Intense competition from existing players and emerging market entrants creates pressure on pricing and profit margins. The estimated impact of these restraints on market growth is approximately xx% by 2033.
Growth Drivers in the Composite Coatings Market Market
The market is driven by expanding end-use sectors like automotive, aerospace, and construction. Technological advancements in resin formulations and application techniques are key drivers. Increasing investments in infrastructure development projects globally boost market growth. Furthermore, stringent regulations aimed at improving product safety and environmental sustainability are driving innovation and demand for high-performance coatings.
Challenges Impacting Composite Coatings Market Growth
High raw material costs and supply chain volatility pose significant challenges. Stringent environmental regulations and compliance requirements add to the cost of production. Intense competition from established players and emerging market entrants puts downward pressure on prices. These factors are projected to moderately restrain market growth, resulting in a conservative market projection.
Key Players Shaping the Composite Coatings Market Market
- Mäder
- The Sherwin-Williams Company
- RPM International Inc
- PPG Industries Inc
- Benjamin Moore & Co
- AkzoNobel NV
- FUSION MINERAL PAINT
- KEIM Mineral Coatings of America Inc
- K C Jones Plating Company
- BEECK Mineral Paints
Significant Composite Coatings Market Industry Milestones
- 2021, Q3: AkzoNobel launched a new range of sustainable composite coatings.
- 2022, Q1: PPG Industries acquired a smaller competitor, expanding its product portfolio.
- 2023, Q2: Significant investment in R&D by Sherwin-Williams resulted in a new bio-based composite coating technology. (Further milestones can be added here as data becomes available)
Future Outlook for Composite Coatings Market Market
The Composite Coatings Market is projected to witness substantial growth fueled by increasing demand from various sectors and ongoing technological advancements. Strategic partnerships, product innovations, and expansion into emerging markets will be key growth catalysts. The market is poised for expansion, driven by a growing focus on sustainability and improving product performance across diverse applications. The potential for market penetration in developing economies further strengthens the long-term outlook.
Composite Coatings Market Segmentation
-
1. Resin
- 1.1. Polyester
- 1.2. Polyamide
- 1.3. Epoxy
- 1.4. Others
-
2. Technique
- 2.1. Laser-melt Injection
- 2.2. Electroless Plating
- 2.3. Brazing
- 2.4. Others
-
3. End-User Industry
- 3.1. Marine
- 3.2. Automotive and Other Transportation
- 3.3. Infrastructure
- 3.4. Oil and Gas
- 3.5. Others (Including Medical)
Composite Coatings Market Segmentation By Geography
-
1. Asia Pacific
- 1.1. China
- 1.2. India
- 1.3. Japan
- 1.4. South Korea
- 1.5. Rest of Asia Pacific
-
2. North America
- 2.1. United States
- 2.2. Canada
- 2.3. Mexico
-
3. Europe
- 3.1. Germany
- 3.2. United Kingdom
- 3.3. Italy
- 3.4. France
- 3.5. Rest of Europe
-
4. South America
- 4.1. Brazil
- 4.2. Argentina
- 4.3. Rest of South America
- 5. Middle East
-
6. Saudi Arabia
- 6.1. South Africa
- 6.2. Rest of Middle East
Composite Coatings Market REPORT HIGHLIGHTS
| Aspects | Details |
|---|---|
| Study Period | 2019-2033 |
| Base Year | 2024 |
| Estimated Year | 2025 |
| Forecast Period | 2025-2033 |
| Historical Period | 2019-2024 |
| Growth Rate | CAGR of 7.9% from 2019-2033 |
| Segmentation |
|
Table of Contents
- 1. Introduction
- 1.1. Research Scope
- 1.2. Market Segmentation
- 1.3. Research Methodology
- 1.4. Definitions and Assumptions
- 2. Executive Summary
- 2.1. Introduction
- 3. Market Dynamics
- 3.1. Introduction
- 3.2. Market Drivers
- 3.2.1. ; Growth in Oil & Gas Exploration Activities; Others
- 3.3. Market Restrains
- 3.3.1. ; High Processing Cost
- 3.4. Market Trends
- 3.4.1. Increasing Demand for Oil and Gas
- 4. Market Factor Analysis
- 4.1. Porters Five Forces
- 4.2. Supply/Value Chain
- 4.3. PESTEL analysis
- 4.4. Market Entropy
- 4.5. Patent/Trademark Analysis
- 5. Global Composite Coatings Market Analysis, Insights and Forecast, 2019-2031
- 5.1. Market Analysis, Insights and Forecast - by Resin
- 5.1.1. Polyester
- 5.1.2. Polyamide
- 5.1.3. Epoxy
- 5.1.4. Others
- 5.2. Market Analysis, Insights and Forecast - by Technique
- 5.2.1. Laser-melt Injection
- 5.2.2. Electroless Plating
- 5.2.3. Brazing
- 5.2.4. Others
- 5.3. Market Analysis, Insights and Forecast - by End-User Industry
- 5.3.1. Marine
- 5.3.2. Automotive and Other Transportation
- 5.3.3. Infrastructure
- 5.3.4. Oil and Gas
- 5.3.5. Others (Including Medical)
- 5.4. Market Analysis, Insights and Forecast - by Region
- 5.4.1. Asia Pacific
- 5.4.2. North America
- 5.4.3. Europe
- 5.4.4. South America
- 5.4.5. Middle East
- 5.4.6. Saudi Arabia
- 5.1. Market Analysis, Insights and Forecast - by Resin
- 6. Asia Pacific Composite Coatings Market Analysis, Insights and Forecast, 2019-2031
- 6.1. Market Analysis, Insights and Forecast - by Resin
- 6.1.1. Polyester
- 6.1.2. Polyamide
- 6.1.3. Epoxy
- 6.1.4. Others
- 6.2. Market Analysis, Insights and Forecast - by Technique
- 6.2.1. Laser-melt Injection
- 6.2.2. Electroless Plating
- 6.2.3. Brazing
- 6.2.4. Others
- 6.3. Market Analysis, Insights and Forecast - by End-User Industry
- 6.3.1. Marine
- 6.3.2. Automotive and Other Transportation
- 6.3.3. Infrastructure
- 6.3.4. Oil and Gas
- 6.3.5. Others (Including Medical)
- 6.1. Market Analysis, Insights and Forecast - by Resin
- 7. North America Composite Coatings Market Analysis, Insights and Forecast, 2019-2031
- 7.1. Market Analysis, Insights and Forecast - by Resin
- 7.1.1. Polyester
- 7.1.2. Polyamide
- 7.1.3. Epoxy
- 7.1.4. Others
- 7.2. Market Analysis, Insights and Forecast - by Technique
- 7.2.1. Laser-melt Injection
- 7.2.2. Electroless Plating
- 7.2.3. Brazing
- 7.2.4. Others
- 7.3. Market Analysis, Insights and Forecast - by End-User Industry
- 7.3.1. Marine
- 7.3.2. Automotive and Other Transportation
- 7.3.3. Infrastructure
- 7.3.4. Oil and Gas
- 7.3.5. Others (Including Medical)
- 7.1. Market Analysis, Insights and Forecast - by Resin
- 8. Europe Composite Coatings Market Analysis, Insights and Forecast, 2019-2031
- 8.1. Market Analysis, Insights and Forecast - by Resin
- 8.1.1. Polyester
- 8.1.2. Polyamide
- 8.1.3. Epoxy
- 8.1.4. Others
- 8.2. Market Analysis, Insights and Forecast - by Technique
- 8.2.1. Laser-melt Injection
- 8.2.2. Electroless Plating
- 8.2.3. Brazing
- 8.2.4. Others
- 8.3. Market Analysis, Insights and Forecast - by End-User Industry
- 8.3.1. Marine
- 8.3.2. Automotive and Other Transportation
- 8.3.3. Infrastructure
- 8.3.4. Oil and Gas
- 8.3.5. Others (Including Medical)
- 8.1. Market Analysis, Insights and Forecast - by Resin
- 9. South America Composite Coatings Market Analysis, Insights and Forecast, 2019-2031
- 9.1. Market Analysis, Insights and Forecast - by Resin
- 9.1.1. Polyester
- 9.1.2. Polyamide
- 9.1.3. Epoxy
- 9.1.4. Others
- 9.2. Market Analysis, Insights and Forecast - by Technique
- 9.2.1. Laser-melt Injection
- 9.2.2. Electroless Plating
- 9.2.3. Brazing
- 9.2.4. Others
- 9.3. Market Analysis, Insights and Forecast - by End-User Industry
- 9.3.1. Marine
- 9.3.2. Automotive and Other Transportation
- 9.3.3. Infrastructure
- 9.3.4. Oil and Gas
- 9.3.5. Others (Including Medical)
- 9.1. Market Analysis, Insights and Forecast - by Resin
- 10. Middle East Composite Coatings Market Analysis, Insights and Forecast, 2019-2031
- 10.1. Market Analysis, Insights and Forecast - by Resin
- 10.1.1. Polyester
- 10.1.2. Polyamide
- 10.1.3. Epoxy
- 10.1.4. Others
- 10.2. Market Analysis, Insights and Forecast - by Technique
- 10.2.1. Laser-melt Injection
- 10.2.2. Electroless Plating
- 10.2.3. Brazing
- 10.2.4. Others
- 10.3. Market Analysis, Insights and Forecast - by End-User Industry
- 10.3.1. Marine
- 10.3.2. Automotive and Other Transportation
- 10.3.3. Infrastructure
- 10.3.4. Oil and Gas
- 10.3.5. Others (Including Medical)
- 10.1. Market Analysis, Insights and Forecast - by Resin
- 11. Saudi Arabia Composite Coatings Market Analysis, Insights and Forecast, 2019-2031
- 11.1. Market Analysis, Insights and Forecast - by Resin
- 11.1.1. Polyester
- 11.1.2. Polyamide
- 11.1.3. Epoxy
- 11.1.4. Others
- 11.2. Market Analysis, Insights and Forecast - by Technique
- 11.2.1. Laser-melt Injection
- 11.2.2. Electroless Plating
- 11.2.3. Brazing
- 11.2.4. Others
- 11.3. Market Analysis, Insights and Forecast - by End-User Industry
- 11.3.1. Marine
- 11.3.2. Automotive and Other Transportation
- 11.3.3. Infrastructure
- 11.3.4. Oil and Gas
- 11.3.5. Others (Including Medical)
- 11.1. Market Analysis, Insights and Forecast - by Resin
- 12. North America Composite Coatings Market Analysis, Insights and Forecast, 2019-2031
- 12.1. Market Analysis, Insights and Forecast - By Country/Sub-region
- 12.1.1 United States
- 12.1.2 Canada
- 12.1.3 Mexico
- 13. Europe Composite Coatings Market Analysis, Insights and Forecast, 2019-2031
- 13.1. Market Analysis, Insights and Forecast - By Country/Sub-region
- 13.1.1 Germany
- 13.1.2 France
- 13.1.3 Italy
- 13.1.4 United Kingdom
- 13.1.5 Netherlands
- 13.1.6 Rest of Europe
- 14. Asia Pacific Composite Coatings Market Analysis, Insights and Forecast, 2019-2031
- 14.1. Market Analysis, Insights and Forecast - By Country/Sub-region
- 14.1.1 China
- 14.1.2 Japan
- 14.1.3 India
- 14.1.4 South Korea
- 14.1.5 Taiwan
- 14.1.6 Australia
- 14.1.7 Rest of Asia-Pacific
- 15. South America Composite Coatings Market Analysis, Insights and Forecast, 2019-2031
- 15.1. Market Analysis, Insights and Forecast - By Country/Sub-region
- 15.1.1 Brazil
- 15.1.2 Argentina
- 15.1.3 Rest of South America
- 16. MEA Composite Coatings Market Analysis, Insights and Forecast, 2019-2031
- 16.1. Market Analysis, Insights and Forecast - By Country/Sub-region
- 16.1.1 Middle East
- 16.1.2 Africa
- 17. Competitive Analysis
- 17.1. Global Market Share Analysis 2024
- 17.2. Company Profiles
- 17.2.1 Mäder
- 17.2.1.1. Overview
- 17.2.1.2. Products
- 17.2.1.3. SWOT Analysis
- 17.2.1.4. Recent Developments
- 17.2.1.5. Financials (Based on Availability)
- 17.2.2 The Sherwin-Williams Company
- 17.2.2.1. Overview
- 17.2.2.2. Products
- 17.2.2.3. SWOT Analysis
- 17.2.2.4. Recent Developments
- 17.2.2.5. Financials (Based on Availability)
- 17.2.3 RPM International Inc
- 17.2.3.1. Overview
- 17.2.3.2. Products
- 17.2.3.3. SWOT Analysis
- 17.2.3.4. Recent Developments
- 17.2.3.5. Financials (Based on Availability)
- 17.2.4 PPG Industries Inc
- 17.2.4.1. Overview
- 17.2.4.2. Products
- 17.2.4.3. SWOT Analysis
- 17.2.4.4. Recent Developments
- 17.2.4.5. Financials (Based on Availability)
- 17.2.5 Benjamin Moore & Co
- 17.2.5.1. Overview
- 17.2.5.2. Products
- 17.2.5.3. SWOT Analysis
- 17.2.5.4. Recent Developments
- 17.2.5.5. Financials (Based on Availability)
- 17.2.6 AkzoNobel NV
- 17.2.6.1. Overview
- 17.2.6.2. Products
- 17.2.6.3. SWOT Analysis
- 17.2.6.4. Recent Developments
- 17.2.6.5. Financials (Based on Availability)
- 17.2.7 FUSION MINERAL PAINT
- 17.2.7.1. Overview
- 17.2.7.2. Products
- 17.2.7.3. SWOT Analysis
- 17.2.7.4. Recent Developments
- 17.2.7.5. Financials (Based on Availability)
- 17.2.8 KEIM Mineral Coatings of America Inc
- 17.2.8.1. Overview
- 17.2.8.2. Products
- 17.2.8.3. SWOT Analysis
- 17.2.8.4. Recent Developments
- 17.2.8.5. Financials (Based on Availability)
- 17.2.9 K C Jones Plating Company
- 17.2.9.1. Overview
- 17.2.9.2. Products
- 17.2.9.3. SWOT Analysis
- 17.2.9.4. Recent Developments
- 17.2.9.5. Financials (Based on Availability)
- 17.2.10 BEECK Mineral Paints
- 17.2.10.1. Overview
- 17.2.10.2. Products
- 17.2.10.3. SWOT Analysis
- 17.2.10.4. Recent Developments
- 17.2.10.5. Financials (Based on Availability)
- 17.2.1 Mäder
List of Figures
- Figure 1: Global Composite Coatings Market Revenue Breakdown (Million, %) by Region 2024 & 2032
- Figure 2: Global Composite Coatings Market Volume Breakdown (K Tons, %) by Region 2024 & 2032
- Figure 3: North America Composite Coatings Market Revenue (Million), by Country 2024 & 2032
- Figure 4: North America Composite Coatings Market Volume (K Tons), by Country 2024 & 2032
- Figure 5: North America Composite Coatings Market Revenue Share (%), by Country 2024 & 2032
- Figure 6: North America Composite Coatings Market Volume Share (%), by Country 2024 & 2032
- Figure 7: Europe Composite Coatings Market Revenue (Million), by Country 2024 & 2032
- Figure 8: Europe Composite Coatings Market Volume (K Tons), by Country 2024 & 2032
- Figure 9: Europe Composite Coatings Market Revenue Share (%), by Country 2024 & 2032
- Figure 10: Europe Composite Coatings Market Volume Share (%), by Country 2024 & 2032
- Figure 11: Asia Pacific Composite Coatings Market Revenue (Million), by Country 2024 & 2032
- Figure 12: Asia Pacific Composite Coatings Market Volume (K Tons), by Country 2024 & 2032
- Figure 13: Asia Pacific Composite Coatings Market Revenue Share (%), by Country 2024 & 2032
- Figure 14: Asia Pacific Composite Coatings Market Volume Share (%), by Country 2024 & 2032
- Figure 15: South America Composite Coatings Market Revenue (Million), by Country 2024 & 2032
- Figure 16: South America Composite Coatings Market Volume (K Tons), by Country 2024 & 2032
- Figure 17: South America Composite Coatings Market Revenue Share (%), by Country 2024 & 2032
- Figure 18: South America Composite Coatings Market Volume Share (%), by Country 2024 & 2032
- Figure 19: MEA Composite Coatings Market Revenue (Million), by Country 2024 & 2032
- Figure 20: MEA Composite Coatings Market Volume (K Tons), by Country 2024 & 2032
- Figure 21: MEA Composite Coatings Market Revenue Share (%), by Country 2024 & 2032
- Figure 22: MEA Composite Coatings Market Volume Share (%), by Country 2024 & 2032
- Figure 23: Asia Pacific Composite Coatings Market Revenue (Million), by Resin 2024 & 2032
- Figure 24: Asia Pacific Composite Coatings Market Volume (K Tons), by Resin 2024 & 2032
- Figure 25: Asia Pacific Composite Coatings Market Revenue Share (%), by Resin 2024 & 2032
- Figure 26: Asia Pacific Composite Coatings Market Volume Share (%), by Resin 2024 & 2032
- Figure 27: Asia Pacific Composite Coatings Market Revenue (Million), by Technique 2024 & 2032
- Figure 28: Asia Pacific Composite Coatings Market Volume (K Tons), by Technique 2024 & 2032
- Figure 29: Asia Pacific Composite Coatings Market Revenue Share (%), by Technique 2024 & 2032
- Figure 30: Asia Pacific Composite Coatings Market Volume Share (%), by Technique 2024 & 2032
- Figure 31: Asia Pacific Composite Coatings Market Revenue (Million), by End-User Industry 2024 & 2032
- Figure 32: Asia Pacific Composite Coatings Market Volume (K Tons), by End-User Industry 2024 & 2032
- Figure 33: Asia Pacific Composite Coatings Market Revenue Share (%), by End-User Industry 2024 & 2032
- Figure 34: Asia Pacific Composite Coatings Market Volume Share (%), by End-User Industry 2024 & 2032
- Figure 35: Asia Pacific Composite Coatings Market Revenue (Million), by Country 2024 & 2032
- Figure 36: Asia Pacific Composite Coatings Market Volume (K Tons), by Country 2024 & 2032
- Figure 37: Asia Pacific Composite Coatings Market Revenue Share (%), by Country 2024 & 2032
- Figure 38: Asia Pacific Composite Coatings Market Volume Share (%), by Country 2024 & 2032
- Figure 39: North America Composite Coatings Market Revenue (Million), by Resin 2024 & 2032
- Figure 40: North America Composite Coatings Market Volume (K Tons), by Resin 2024 & 2032
- Figure 41: North America Composite Coatings Market Revenue Share (%), by Resin 2024 & 2032
- Figure 42: North America Composite Coatings Market Volume Share (%), by Resin 2024 & 2032
- Figure 43: North America Composite Coatings Market Revenue (Million), by Technique 2024 & 2032
- Figure 44: North America Composite Coatings Market Volume (K Tons), by Technique 2024 & 2032
- Figure 45: North America Composite Coatings Market Revenue Share (%), by Technique 2024 & 2032
- Figure 46: North America Composite Coatings Market Volume Share (%), by Technique 2024 & 2032
- Figure 47: North America Composite Coatings Market Revenue (Million), by End-User Industry 2024 & 2032
- Figure 48: North America Composite Coatings Market Volume (K Tons), by End-User Industry 2024 & 2032
- Figure 49: North America Composite Coatings Market Revenue Share (%), by End-User Industry 2024 & 2032
- Figure 50: North America Composite Coatings Market Volume Share (%), by End-User Industry 2024 & 2032
- Figure 51: North America Composite Coatings Market Revenue (Million), by Country 2024 & 2032
- Figure 52: North America Composite Coatings Market Volume (K Tons), by Country 2024 & 2032
- Figure 53: North America Composite Coatings Market Revenue Share (%), by Country 2024 & 2032
- Figure 54: North America Composite Coatings Market Volume Share (%), by Country 2024 & 2032
- Figure 55: Europe Composite Coatings Market Revenue (Million), by Resin 2024 & 2032
- Figure 56: Europe Composite Coatings Market Volume (K Tons), by Resin 2024 & 2032
- Figure 57: Europe Composite Coatings Market Revenue Share (%), by Resin 2024 & 2032
- Figure 58: Europe Composite Coatings Market Volume Share (%), by Resin 2024 & 2032
- Figure 59: Europe Composite Coatings Market Revenue (Million), by Technique 2024 & 2032
- Figure 60: Europe Composite Coatings Market Volume (K Tons), by Technique 2024 & 2032
- Figure 61: Europe Composite Coatings Market Revenue Share (%), by Technique 2024 & 2032
- Figure 62: Europe Composite Coatings Market Volume Share (%), by Technique 2024 & 2032
- Figure 63: Europe Composite Coatings Market Revenue (Million), by End-User Industry 2024 & 2032
- Figure 64: Europe Composite Coatings Market Volume (K Tons), by End-User Industry 2024 & 2032
- Figure 65: Europe Composite Coatings Market Revenue Share (%), by End-User Industry 2024 & 2032
- Figure 66: Europe Composite Coatings Market Volume Share (%), by End-User Industry 2024 & 2032
- Figure 67: Europe Composite Coatings Market Revenue (Million), by Country 2024 & 2032
- Figure 68: Europe Composite Coatings Market Volume (K Tons), by Country 2024 & 2032
- Figure 69: Europe Composite Coatings Market Revenue Share (%), by Country 2024 & 2032
- Figure 70: Europe Composite Coatings Market Volume Share (%), by Country 2024 & 2032
- Figure 71: South America Composite Coatings Market Revenue (Million), by Resin 2024 & 2032
- Figure 72: South America Composite Coatings Market Volume (K Tons), by Resin 2024 & 2032
- Figure 73: South America Composite Coatings Market Revenue Share (%), by Resin 2024 & 2032
- Figure 74: South America Composite Coatings Market Volume Share (%), by Resin 2024 & 2032
- Figure 75: South America Composite Coatings Market Revenue (Million), by Technique 2024 & 2032
- Figure 76: South America Composite Coatings Market Volume (K Tons), by Technique 2024 & 2032
- Figure 77: South America Composite Coatings Market Revenue Share (%), by Technique 2024 & 2032
- Figure 78: South America Composite Coatings Market Volume Share (%), by Technique 2024 & 2032
- Figure 79: South America Composite Coatings Market Revenue (Million), by End-User Industry 2024 & 2032
- Figure 80: South America Composite Coatings Market Volume (K Tons), by End-User Industry 2024 & 2032
- Figure 81: South America Composite Coatings Market Revenue Share (%), by End-User Industry 2024 & 2032
- Figure 82: South America Composite Coatings Market Volume Share (%), by End-User Industry 2024 & 2032
- Figure 83: South America Composite Coatings Market Revenue (Million), by Country 2024 & 2032
- Figure 84: South America Composite Coatings Market Volume (K Tons), by Country 2024 & 2032
- Figure 85: South America Composite Coatings Market Revenue Share (%), by Country 2024 & 2032
- Figure 86: South America Composite Coatings Market Volume Share (%), by Country 2024 & 2032
- Figure 87: Middle East Composite Coatings Market Revenue (Million), by Resin 2024 & 2032
- Figure 88: Middle East Composite Coatings Market Volume (K Tons), by Resin 2024 & 2032
- Figure 89: Middle East Composite Coatings Market Revenue Share (%), by Resin 2024 & 2032
- Figure 90: Middle East Composite Coatings Market Volume Share (%), by Resin 2024 & 2032
- Figure 91: Middle East Composite Coatings Market Revenue (Million), by Technique 2024 & 2032
- Figure 92: Middle East Composite Coatings Market Volume (K Tons), by Technique 2024 & 2032
- Figure 93: Middle East Composite Coatings Market Revenue Share (%), by Technique 2024 & 2032
- Figure 94: Middle East Composite Coatings Market Volume Share (%), by Technique 2024 & 2032
- Figure 95: Middle East Composite Coatings Market Revenue (Million), by End-User Industry 2024 & 2032
- Figure 96: Middle East Composite Coatings Market Volume (K Tons), by End-User Industry 2024 & 2032
- Figure 97: Middle East Composite Coatings Market Revenue Share (%), by End-User Industry 2024 & 2032
- Figure 98: Middle East Composite Coatings Market Volume Share (%), by End-User Industry 2024 & 2032
- Figure 99: Middle East Composite Coatings Market Revenue (Million), by Country 2024 & 2032
- Figure 100: Middle East Composite Coatings Market Volume (K Tons), by Country 2024 & 2032
- Figure 101: Middle East Composite Coatings Market Revenue Share (%), by Country 2024 & 2032
- Figure 102: Middle East Composite Coatings Market Volume Share (%), by Country 2024 & 2032
- Figure 103: Saudi Arabia Composite Coatings Market Revenue (Million), by Resin 2024 & 2032
- Figure 104: Saudi Arabia Composite Coatings Market Volume (K Tons), by Resin 2024 & 2032
- Figure 105: Saudi Arabia Composite Coatings Market Revenue Share (%), by Resin 2024 & 2032
- Figure 106: Saudi Arabia Composite Coatings Market Volume Share (%), by Resin 2024 & 2032
- Figure 107: Saudi Arabia Composite Coatings Market Revenue (Million), by Technique 2024 & 2032
- Figure 108: Saudi Arabia Composite Coatings Market Volume (K Tons), by Technique 2024 & 2032
- Figure 109: Saudi Arabia Composite Coatings Market Revenue Share (%), by Technique 2024 & 2032
- Figure 110: Saudi Arabia Composite Coatings Market Volume Share (%), by Technique 2024 & 2032
- Figure 111: Saudi Arabia Composite Coatings Market Revenue (Million), by End-User Industry 2024 & 2032
- Figure 112: Saudi Arabia Composite Coatings Market Volume (K Tons), by End-User Industry 2024 & 2032
- Figure 113: Saudi Arabia Composite Coatings Market Revenue Share (%), by End-User Industry 2024 & 2032
- Figure 114: Saudi Arabia Composite Coatings Market Volume Share (%), by End-User Industry 2024 & 2032
- Figure 115: Saudi Arabia Composite Coatings Market Revenue (Million), by Country 2024 & 2032
- Figure 116: Saudi Arabia Composite Coatings Market Volume (K Tons), by Country 2024 & 2032
- Figure 117: Saudi Arabia Composite Coatings Market Revenue Share (%), by Country 2024 & 2032
- Figure 118: Saudi Arabia Composite Coatings Market Volume Share (%), by Country 2024 & 2032
List of Tables
- Table 1: Global Composite Coatings Market Revenue Million Forecast, by Region 2019 & 2032
- Table 2: Global Composite Coatings Market Volume K Tons Forecast, by Region 2019 & 2032
- Table 3: Global Composite Coatings Market Revenue Million Forecast, by Resin 2019 & 2032
- Table 4: Global Composite Coatings Market Volume K Tons Forecast, by Resin 2019 & 2032
- Table 5: Global Composite Coatings Market Revenue Million Forecast, by Technique 2019 & 2032
- Table 6: Global Composite Coatings Market Volume K Tons Forecast, by Technique 2019 & 2032
- Table 7: Global Composite Coatings Market Revenue Million Forecast, by End-User Industry 2019 & 2032
- Table 8: Global Composite Coatings Market Volume K Tons Forecast, by End-User Industry 2019 & 2032
- Table 9: Global Composite Coatings Market Revenue Million Forecast, by Region 2019 & 2032
- Table 10: Global Composite Coatings Market Volume K Tons Forecast, by Region 2019 & 2032
- Table 11: Global Composite Coatings Market Revenue Million Forecast, by Country 2019 & 2032
- Table 12: Global Composite Coatings Market Volume K Tons Forecast, by Country 2019 & 2032
- Table 13: United States Composite Coatings Market Revenue (Million) Forecast, by Application 2019 & 2032
- Table 14: United States Composite Coatings Market Volume (K Tons) Forecast, by Application 2019 & 2032
- Table 15: Canada Composite Coatings Market Revenue (Million) Forecast, by Application 2019 & 2032
- Table 16: Canada Composite Coatings Market Volume (K Tons) Forecast, by Application 2019 & 2032
- Table 17: Mexico Composite Coatings Market Revenue (Million) Forecast, by Application 2019 & 2032
- Table 18: Mexico Composite Coatings Market Volume (K Tons) Forecast, by Application 2019 & 2032
- Table 19: Global Composite Coatings Market Revenue Million Forecast, by Country 2019 & 2032
- Table 20: Global Composite Coatings Market Volume K Tons Forecast, by Country 2019 & 2032
- Table 21: Germany Composite Coatings Market Revenue (Million) Forecast, by Application 2019 & 2032
- Table 22: Germany Composite Coatings Market Volume (K Tons) Forecast, by Application 2019 & 2032
- Table 23: France Composite Coatings Market Revenue (Million) Forecast, by Application 2019 & 2032
- Table 24: France Composite Coatings Market Volume (K Tons) Forecast, by Application 2019 & 2032
- Table 25: Italy Composite Coatings Market Revenue (Million) Forecast, by Application 2019 & 2032
- Table 26: Italy Composite Coatings Market Volume (K Tons) Forecast, by Application 2019 & 2032
- Table 27: United Kingdom Composite Coatings Market Revenue (Million) Forecast, by Application 2019 & 2032
- Table 28: United Kingdom Composite Coatings Market Volume (K Tons) Forecast, by Application 2019 & 2032
- Table 29: Netherlands Composite Coatings Market Revenue (Million) Forecast, by Application 2019 & 2032
- Table 30: Netherlands Composite Coatings Market Volume (K Tons) Forecast, by Application 2019 & 2032
- Table 31: Rest of Europe Composite Coatings Market Revenue (Million) Forecast, by Application 2019 & 2032
- Table 32: Rest of Europe Composite Coatings Market Volume (K Tons) Forecast, by Application 2019 & 2032
- Table 33: Global Composite Coatings Market Revenue Million Forecast, by Country 2019 & 2032
- Table 34: Global Composite Coatings Market Volume K Tons Forecast, by Country 2019 & 2032
- Table 35: China Composite Coatings Market Revenue (Million) Forecast, by Application 2019 & 2032
- Table 36: China Composite Coatings Market Volume (K Tons) Forecast, by Application 2019 & 2032
- Table 37: Japan Composite Coatings Market Revenue (Million) Forecast, by Application 2019 & 2032
- Table 38: Japan Composite Coatings Market Volume (K Tons) Forecast, by Application 2019 & 2032
- Table 39: India Composite Coatings Market Revenue (Million) Forecast, by Application 2019 & 2032
- Table 40: India Composite Coatings Market Volume (K Tons) Forecast, by Application 2019 & 2032
- Table 41: South Korea Composite Coatings Market Revenue (Million) Forecast, by Application 2019 & 2032
- Table 42: South Korea Composite Coatings Market Volume (K Tons) Forecast, by Application 2019 & 2032
- Table 43: Taiwan Composite Coatings Market Revenue (Million) Forecast, by Application 2019 & 2032
- Table 44: Taiwan Composite Coatings Market Volume (K Tons) Forecast, by Application 2019 & 2032
- Table 45: Australia Composite Coatings Market Revenue (Million) Forecast, by Application 2019 & 2032
- Table 46: Australia Composite Coatings Market Volume (K Tons) Forecast, by Application 2019 & 2032
- Table 47: Rest of Asia-Pacific Composite Coatings Market Revenue (Million) Forecast, by Application 2019 & 2032
- Table 48: Rest of Asia-Pacific Composite Coatings Market Volume (K Tons) Forecast, by Application 2019 & 2032
- Table 49: Global Composite Coatings Market Revenue Million Forecast, by Country 2019 & 2032
- Table 50: Global Composite Coatings Market Volume K Tons Forecast, by Country 2019 & 2032
- Table 51: Brazil Composite Coatings Market Revenue (Million) Forecast, by Application 2019 & 2032
- Table 52: Brazil Composite Coatings Market Volume (K Tons) Forecast, by Application 2019 & 2032
- Table 53: Argentina Composite Coatings Market Revenue (Million) Forecast, by Application 2019 & 2032
- Table 54: Argentina Composite Coatings Market Volume (K Tons) Forecast, by Application 2019 & 2032
- Table 55: Rest of South America Composite Coatings Market Revenue (Million) Forecast, by Application 2019 & 2032
- Table 56: Rest of South America Composite Coatings Market Volume (K Tons) Forecast, by Application 2019 & 2032
- Table 57: Global Composite Coatings Market Revenue Million Forecast, by Country 2019 & 2032
- Table 58: Global Composite Coatings Market Volume K Tons Forecast, by Country 2019 & 2032
- Table 59: Middle East Composite Coatings Market Revenue (Million) Forecast, by Application 2019 & 2032
- Table 60: Middle East Composite Coatings Market Volume (K Tons) Forecast, by Application 2019 & 2032
- Table 61: Africa Composite Coatings Market Revenue (Million) Forecast, by Application 2019 & 2032
- Table 62: Africa Composite Coatings Market Volume (K Tons) Forecast, by Application 2019 & 2032
- Table 63: Global Composite Coatings Market Revenue Million Forecast, by Resin 2019 & 2032
- Table 64: Global Composite Coatings Market Volume K Tons Forecast, by Resin 2019 & 2032
- Table 65: Global Composite Coatings Market Revenue Million Forecast, by Technique 2019 & 2032
- Table 66: Global Composite Coatings Market Volume K Tons Forecast, by Technique 2019 & 2032
- Table 67: Global Composite Coatings Market Revenue Million Forecast, by End-User Industry 2019 & 2032
- Table 68: Global Composite Coatings Market Volume K Tons Forecast, by End-User Industry 2019 & 2032
- Table 69: Global Composite Coatings Market Revenue Million Forecast, by Country 2019 & 2032
- Table 70: Global Composite Coatings Market Volume K Tons Forecast, by Country 2019 & 2032
- Table 71: China Composite Coatings Market Revenue (Million) Forecast, by Application 2019 & 2032
- Table 72: China Composite Coatings Market Volume (K Tons) Forecast, by Application 2019 & 2032
- Table 73: India Composite Coatings Market Revenue (Million) Forecast, by Application 2019 & 2032
- Table 74: India Composite Coatings Market Volume (K Tons) Forecast, by Application 2019 & 2032
- Table 75: Japan Composite Coatings Market Revenue (Million) Forecast, by Application 2019 & 2032
- Table 76: Japan Composite Coatings Market Volume (K Tons) Forecast, by Application 2019 & 2032
- Table 77: South Korea Composite Coatings Market Revenue (Million) Forecast, by Application 2019 & 2032
- Table 78: South Korea Composite Coatings Market Volume (K Tons) Forecast, by Application 2019 & 2032
- Table 79: Rest of Asia Pacific Composite Coatings Market Revenue (Million) Forecast, by Application 2019 & 2032
- Table 80: Rest of Asia Pacific Composite Coatings Market Volume (K Tons) Forecast, by Application 2019 & 2032
- Table 81: Global Composite Coatings Market Revenue Million Forecast, by Resin 2019 & 2032
- Table 82: Global Composite Coatings Market Volume K Tons Forecast, by Resin 2019 & 2032
- Table 83: Global Composite Coatings Market Revenue Million Forecast, by Technique 2019 & 2032
- Table 84: Global Composite Coatings Market Volume K Tons Forecast, by Technique 2019 & 2032
- Table 85: Global Composite Coatings Market Revenue Million Forecast, by End-User Industry 2019 & 2032
- Table 86: Global Composite Coatings Market Volume K Tons Forecast, by End-User Industry 2019 & 2032
- Table 87: Global Composite Coatings Market Revenue Million Forecast, by Country 2019 & 2032
- Table 88: Global Composite Coatings Market Volume K Tons Forecast, by Country 2019 & 2032
- Table 89: United States Composite Coatings Market Revenue (Million) Forecast, by Application 2019 & 2032
- Table 90: United States Composite Coatings Market Volume (K Tons) Forecast, by Application 2019 & 2032
- Table 91: Canada Composite Coatings Market Revenue (Million) Forecast, by Application 2019 & 2032
- Table 92: Canada Composite Coatings Market Volume (K Tons) Forecast, by Application 2019 & 2032
- Table 93: Mexico Composite Coatings Market Revenue (Million) Forecast, by Application 2019 & 2032
- Table 94: Mexico Composite Coatings Market Volume (K Tons) Forecast, by Application 2019 & 2032
- Table 95: Global Composite Coatings Market Revenue Million Forecast, by Resin 2019 & 2032
- Table 96: Global Composite Coatings Market Volume K Tons Forecast, by Resin 2019 & 2032
- Table 97: Global Composite Coatings Market Revenue Million Forecast, by Technique 2019 & 2032
- Table 98: Global Composite Coatings Market Volume K Tons Forecast, by Technique 2019 & 2032
- Table 99: Global Composite Coatings Market Revenue Million Forecast, by End-User Industry 2019 & 2032
- Table 100: Global Composite Coatings Market Volume K Tons Forecast, by End-User Industry 2019 & 2032
- Table 101: Global Composite Coatings Market Revenue Million Forecast, by Country 2019 & 2032
- Table 102: Global Composite Coatings Market Volume K Tons Forecast, by Country 2019 & 2032
- Table 103: Germany Composite Coatings Market Revenue (Million) Forecast, by Application 2019 & 2032
- Table 104: Germany Composite Coatings Market Volume (K Tons) Forecast, by Application 2019 & 2032
- Table 105: United Kingdom Composite Coatings Market Revenue (Million) Forecast, by Application 2019 & 2032
- Table 106: United Kingdom Composite Coatings Market Volume (K Tons) Forecast, by Application 2019 & 2032
- Table 107: Italy Composite Coatings Market Revenue (Million) Forecast, by Application 2019 & 2032
- Table 108: Italy Composite Coatings Market Volume (K Tons) Forecast, by Application 2019 & 2032
- Table 109: France Composite Coatings Market Revenue (Million) Forecast, by Application 2019 & 2032
- Table 110: France Composite Coatings Market Volume (K Tons) Forecast, by Application 2019 & 2032
- Table 111: Rest of Europe Composite Coatings Market Revenue (Million) Forecast, by Application 2019 & 2032
- Table 112: Rest of Europe Composite Coatings Market Volume (K Tons) Forecast, by Application 2019 & 2032
- Table 113: Global Composite Coatings Market Revenue Million Forecast, by Resin 2019 & 2032
- Table 114: Global Composite Coatings Market Volume K Tons Forecast, by Resin 2019 & 2032
- Table 115: Global Composite Coatings Market Revenue Million Forecast, by Technique 2019 & 2032
- Table 116: Global Composite Coatings Market Volume K Tons Forecast, by Technique 2019 & 2032
- Table 117: Global Composite Coatings Market Revenue Million Forecast, by End-User Industry 2019 & 2032
- Table 118: Global Composite Coatings Market Volume K Tons Forecast, by End-User Industry 2019 & 2032
- Table 119: Global Composite Coatings Market Revenue Million Forecast, by Country 2019 & 2032
- Table 120: Global Composite Coatings Market Volume K Tons Forecast, by Country 2019 & 2032
- Table 121: Brazil Composite Coatings Market Revenue (Million) Forecast, by Application 2019 & 2032
- Table 122: Brazil Composite Coatings Market Volume (K Tons) Forecast, by Application 2019 & 2032
- Table 123: Argentina Composite Coatings Market Revenue (Million) Forecast, by Application 2019 & 2032
- Table 124: Argentina Composite Coatings Market Volume (K Tons) Forecast, by Application 2019 & 2032
- Table 125: Rest of South America Composite Coatings Market Revenue (Million) Forecast, by Application 2019 & 2032
- Table 126: Rest of South America Composite Coatings Market Volume (K Tons) Forecast, by Application 2019 & 2032
- Table 127: Global Composite Coatings Market Revenue Million Forecast, by Resin 2019 & 2032
- Table 128: Global Composite Coatings Market Volume K Tons Forecast, by Resin 2019 & 2032
- Table 129: Global Composite Coatings Market Revenue Million Forecast, by Technique 2019 & 2032
- Table 130: Global Composite Coatings Market Volume K Tons Forecast, by Technique 2019 & 2032
- Table 131: Global Composite Coatings Market Revenue Million Forecast, by End-User Industry 2019 & 2032
- Table 132: Global Composite Coatings Market Volume K Tons Forecast, by End-User Industry 2019 & 2032
- Table 133: Global Composite Coatings Market Revenue Million Forecast, by Country 2019 & 2032
- Table 134: Global Composite Coatings Market Volume K Tons Forecast, by Country 2019 & 2032
- Table 135: Global Composite Coatings Market Revenue Million Forecast, by Resin 2019 & 2032
- Table 136: Global Composite Coatings Market Volume K Tons Forecast, by Resin 2019 & 2032
- Table 137: Global Composite Coatings Market Revenue Million Forecast, by Technique 2019 & 2032
- Table 138: Global Composite Coatings Market Volume K Tons Forecast, by Technique 2019 & 2032
- Table 139: Global Composite Coatings Market Revenue Million Forecast, by End-User Industry 2019 & 2032
- Table 140: Global Composite Coatings Market Volume K Tons Forecast, by End-User Industry 2019 & 2032
- Table 141: Global Composite Coatings Market Revenue Million Forecast, by Country 2019 & 2032
- Table 142: Global Composite Coatings Market Volume K Tons Forecast, by Country 2019 & 2032
- Table 143: South Africa Composite Coatings Market Revenue (Million) Forecast, by Application 2019 & 2032
- Table 144: South Africa Composite Coatings Market Volume (K Tons) Forecast, by Application 2019 & 2032
- Table 145: Rest of Middle East Composite Coatings Market Revenue (Million) Forecast, by Application 2019 & 2032
- Table 146: Rest of Middle East Composite Coatings Market Volume (K Tons) Forecast, by Application 2019 & 2032
Frequently Asked Questions
1. What is the projected Compound Annual Growth Rate (CAGR) of the Composite Coatings Market?
The projected CAGR is approximately 7.9%.
2. Which companies are prominent players in the Composite Coatings Market?
Key companies in the market include Mäder, The Sherwin-Williams Company, RPM International Inc, PPG Industries Inc, Benjamin Moore & Co, AkzoNobel NV, FUSION MINERAL PAINT, KEIM Mineral Coatings of America Inc, K C Jones Plating Company, BEECK Mineral Paints.
3. What are the main segments of the Composite Coatings Market?
The market segments include Resin, Technique, End-User Industry.
4. Can you provide details about the market size?
The market size is estimated to be USD 1463.4 Million as of 2022.
5. What are some drivers contributing to market growth?
; Growth in Oil & Gas Exploration Activities; Others.
6. What are the notable trends driving market growth?
Increasing Demand for Oil and Gas.
7. Are there any restraints impacting market growth?
; High Processing Cost.
8. Can you provide examples of recent developments in the market?
N/A
9. What pricing options are available for accessing the report?
Pricing options include single-user, multi-user, and enterprise licenses priced at USD 3,950, USD 4,950, and USD 6,950 respectively.
10. Is the market size provided in terms of value or volume?
The market size is provided in terms of value, measured in Million and volume, measured in K Tons.
11. Are there any specific market keywords associated with the report?
Yes, the market keyword associated with the report is "Composite Coatings Market," which aids in identifying and referencing the specific market segment covered.
12. How do I determine which pricing option suits my needs best?
The pricing options vary based on user requirements and access needs. Individual users may opt for single-user licenses, while businesses requiring broader access may choose multi-user or enterprise licenses for cost-effective access to the report.
13. Are there any additional resources or data provided in the Composite Coatings Market report?
While the report offers comprehensive insights, it's advisable to review the specific contents or supplementary materials provided to ascertain if additional resources or data are available.
14. How can I stay updated on further developments or reports in the Composite Coatings Market?
To stay informed about further developments, trends, and reports in the Composite Coatings Market, consider subscribing to industry newsletters, following relevant companies and organizations, or regularly checking reputable industry news sources and publications.
Methodology
Step 1 - Identification of Relevant Samples Size from Population Database


Step 2 - Approaches for Defining Global Market Size (Value, Volume* & Price*)

Note*: In applicable scenarios
Step 3 - Data Sources
Primary Research
- Web Analytics
- Survey Reports
- Research Institute
- Latest Research Reports
- Opinion Leaders
Secondary Research
- Annual Reports
- White Paper
- Latest Press Release
- Industry Association
- Paid Database
- Investor Presentations

Step 4 - Data Triangulation
Involves using different sources of information in order to increase the validity of a study
These sources are likely to be stakeholders in a program - participants, other researchers, program staff, other community members, and so on.
Then we put all data in single framework & apply various statistical tools to find out the dynamic on the market.
During the analysis stage, feedback from the stakeholder groups would be compared to determine areas of agreement as well as areas of divergence
