

Key Insights
The global composite rebar market is experiencing robust growth, driven by increasing infrastructure development, stringent regulations promoting sustainable construction materials, and the inherent advantages of composite rebar over traditional steel rebar. The market's Compound Annual Growth Rate (CAGR) exceeding 4.00% signifies a consistent upward trajectory projected through 2033. Key drivers include the superior corrosion resistance of composite rebar, reducing long-term maintenance costs and extending infrastructure lifespan, particularly beneficial in harsh marine and chemical environments. Furthermore, its lighter weight compared to steel simplifies handling and transportation, leading to reduced labor costs and improved construction efficiency. The market segmentation reveals a diverse product landscape, with Glass Fiber Reinforced Polymer (GFRP) rebar currently holding the largest market share due to its cost-effectiveness and widespread application. However, Carbon Fiber Reinforced Polymer (CFRP) rebar is witnessing rapid adoption in high-performance applications, driven by its exceptional strength-to-weight ratio. Applications span various sectors, including highways, bridges, buildings, marine structures, and water treatment plants, reflecting the versatility and broad applicability of composite rebar. While initial high production costs pose a restraint, ongoing technological advancements and economies of scale are expected to gradually mitigate this challenge, further fueling market expansion. Geographically, North America and Europe currently represent significant market shares, but the Asia-Pacific region is projected to experience the most substantial growth due to the rapid urbanization and infrastructure development underway in countries like China and India.
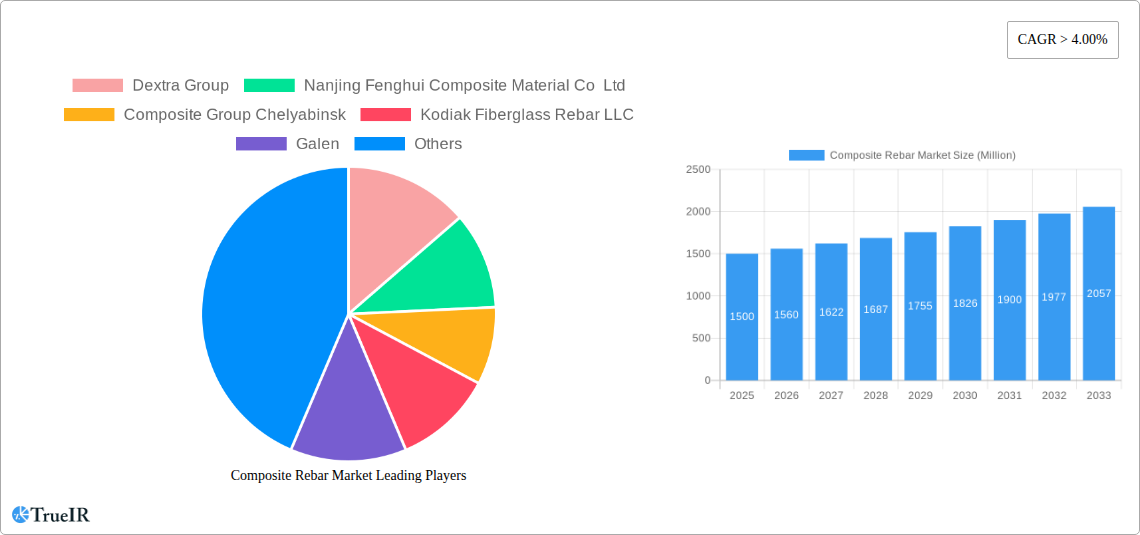
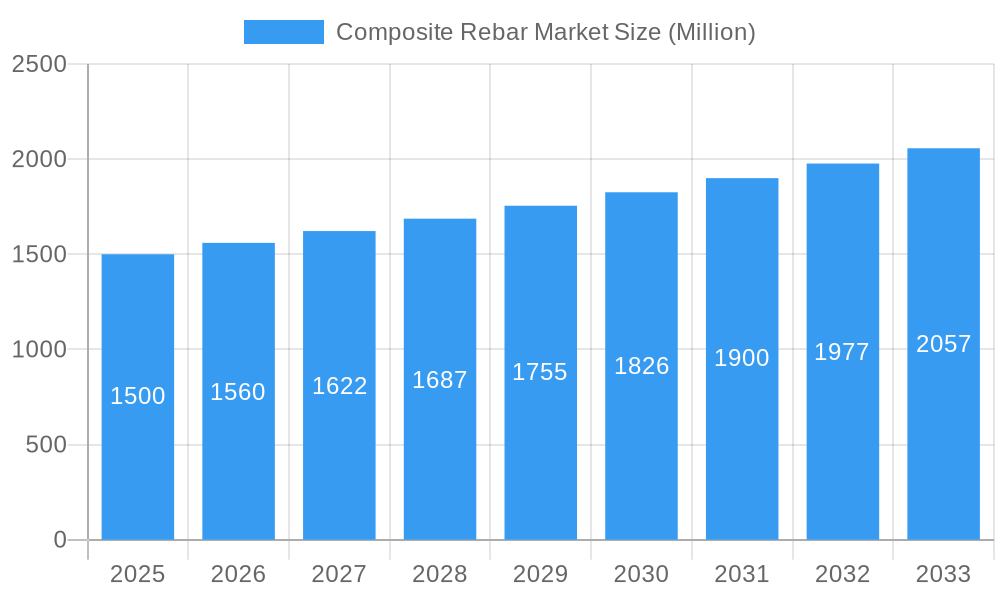
Composite Rebar Market Market Size (In Billion)
The competitive landscape is characterized by a mix of established players and emerging companies. Major market players are strategically focusing on product innovation, expanding their geographical reach, and forging strategic partnerships to strengthen their market position. The market's future trajectory hinges on continued technological advancements, government policies supporting sustainable construction, and the successful integration of composite rebar into mainstream construction practices. Further research and development focusing on enhancing the durability, cost-effectiveness, and standardization of composite rebar will be pivotal in unlocking its full market potential and solidifying its place as a key material in the construction industry. The market's projected growth suggests substantial investment opportunities for both established and emerging companies involved in the production, distribution, and application of composite rebar.
Composite Rebar Market Company Market Share
Dynamic Composite Rebar Market Report: 2019-2033
This comprehensive report provides a detailed analysis of the global Composite Rebar Market, offering invaluable insights for stakeholders across the value chain. With a study period spanning 2019-2033, a base year of 2025, and a forecast period of 2025-2033, this report leverages rigorous data analysis and expert insights to paint a clear picture of current market dynamics and future trajectories. The market is projected to reach xx Million by 2033, exhibiting a robust CAGR of xx% during the forecast period.
Composite Rebar Market Structure & Competitive Landscape
The global composite rebar market exhibits a moderately consolidated structure, with a few key players holding significant market share. The Herfindahl-Hirschman Index (HHI) is estimated at xx, suggesting a relatively competitive landscape with opportunities for both established and emerging players. Market concentration is influenced by factors such as technological advancements, economies of scale, and access to raw materials.
Key Factors Shaping the Competitive Landscape:
- Innovation Drivers: Continuous research and development efforts are leading to the introduction of high-performance composite rebar with enhanced durability, strength, and corrosion resistance. This innovation pushes the market forward and creates opportunities for differentiation.
- Regulatory Impacts: Government regulations and policies promoting sustainable infrastructure development are significantly influencing market growth. Incentives and mandates for using composite rebar in certain applications are driving adoption.
- Product Substitutes: While steel rebar remains the dominant substitute, composite rebar's advantages in corrosion resistance, lightweight properties, and superior tensile strength are steadily gaining market share.
- End-User Segmentation: The market is segmented across various end-user industries, including highways, bridges and buildings, marine structures, and water treatment plants. Each segment exhibits unique growth drivers and opportunities.
- M&A Trends: The market has witnessed a moderate level of mergers and acquisitions (M&A) activity in recent years. The total M&A volume in the period 2019-2024 was approximately xx Million, driven primarily by strategic expansion and technology acquisition.
Composite Rebar Market Trends & Opportunities
The global composite rebar market is experiencing significant growth fueled by several key trends:
The market size is projected to reach xx Million by 2033, driven by increasing infrastructure development globally. The rising demand for sustainable and durable construction materials, coupled with the inherent advantages of composite rebar over traditional steel rebar, is further accelerating market expansion. Technological advancements, such as the development of high-strength, lightweight composite materials, are also contributing to market growth. Shifting consumer preferences toward environmentally friendly products and a growing awareness of the long-term cost-effectiveness of composite rebar further strengthen the market's positive outlook. The competitive landscape is dynamic, with established players and new entrants constantly striving to innovate and capture market share. The CAGR during the forecast period (2025-2033) is anticipated to be around xx%, indicative of robust and consistent market expansion. Market penetration rates are steadily increasing across various regions, particularly in developed nations with stringent environmental regulations and advanced infrastructure projects.
Dominant Markets & Segments in Composite Rebar Market
The global composite rebar market displays strong regional variations in terms of market dominance and segment performance. While North America and Europe have historically held significant market share, rapid infrastructure development in Asia-Pacific is driving exceptional growth in the region.
Key Growth Drivers:
- Infrastructure Development: Significant investments in infrastructure projects worldwide, particularly in emerging economies, are fueling demand for composite rebar.
- Government Policies and Regulations: Supportive government policies promoting the use of sustainable building materials and stringent regulations concerning corrosion are driving market adoption.
- Technological Advancements: Continuous innovations in composite materials technology are resulting in stronger, lighter, and more cost-effective products.
Dominant Segments:
- Product Type: GFRP rebar currently dominates the market due to its relatively lower cost and ease of manufacturing. However, CFRP and BFRP rebar are gaining traction owing to their superior strength and durability.
- Application: Highways, bridges, and buildings represent the largest segment, driven by extensive infrastructure development. Marine structures and waterfronts are also emerging as significant applications due to composite rebar's corrosion resistance.
Composite Rebar Market Product Analysis
The composite rebar market showcases significant product innovation, driven by improvements in fiber types, resin systems, and manufacturing processes. GFRP rebar, CFRP rebar, and BFRP rebar each offer unique performance characteristics, tailoring their applications to specific structural requirements. Technological advancements focus on enhancing strength-to-weight ratios, improving durability, and optimizing manufacturing costs. Market fit is determined by factors like application-specific performance needs, cost competitiveness relative to traditional steel rebar, and regulatory compliance requirements.
Key Drivers, Barriers & Challenges in Composite Rebar Market
Key Drivers:
- Growing demand for sustainable and eco-friendly construction materials: The increasing awareness of environmental concerns is driving the adoption of composite rebar as a sustainable alternative to steel.
- Improved infrastructure development: Global investments in infrastructure projects are boosting the demand for construction materials, including composite rebar.
- Government regulations and initiatives: Favorable policies and regulations promoting the use of sustainable materials are further accelerating market growth.
Challenges and Restraints:
- Higher initial cost compared to steel rebar: The relatively higher cost of composite rebar can be a barrier to wider adoption.
- Supply chain limitations: The availability of high-quality raw materials and efficient manufacturing processes can sometimes be a challenge.
- Limited awareness and understanding: A lack of awareness about the benefits and applications of composite rebar among construction professionals can hinder market penetration. xx Million in lost revenue was attributed to this factor in 2024.
Growth Drivers in the Composite Rebar Market Market
Growth in the composite rebar market is primarily driven by increasing infrastructure projects globally, stringent environmental regulations favoring sustainable materials, and ongoing technological advancements resulting in superior product performance.
Challenges Impacting Composite Rebar Market Growth
Challenges include the relatively higher initial cost of composite rebar compared to steel, potential supply chain constraints, and the need for greater market awareness and education among construction professionals.
Key Players Shaping the Composite Rebar Market Market
- Dextra Group
- Nanjing Fenghui Composite Material Co Ltd
- Composite Group Chelyabinsk
- Kodiak Fiberglass Rebar LLC
- Galen
- Tribeni Fibres Pvt Ltd
- Marshall Composite Technologies LLC
- Captrad
- Pultron Composites
- Armastek
- Schock Bauteile GmbH
- Technobasalt-Invest LLC
Significant Composite Rebar Market Industry Milestones
- June 2022: Pultron Composites and Owens Corning announced a joint venture to manufacture fiberglass rebar, boosting global market access, particularly in the US.
- July 2020: Pultron Composites partnered with Geosynthetic Partners Ltd. for Mateenbar distribution in New Zealand and the Pacific Islands, expanding its APAC presence.
Future Outlook for Composite Rebar Market Market
The future of the composite rebar market is bright, driven by sustained infrastructure development, growing environmental awareness, and continuous technological innovation. Strategic partnerships and collaborations, along with focused marketing efforts to increase awareness, will further accelerate market expansion. The market is poised to witness significant growth over the forecast period, driven by the increasing adoption of sustainable construction practices and the superior performance characteristics of composite rebar.
Composite Rebar Market Segmentation
-
1. Product Type
- 1.1. Glass Fiber Reinforced Polymer Rebar (GFRP Rebar)
- 1.2. Carbon Fiber Reinforced Polymer Rebar (CFRP Rebar)
- 1.3. Basalt Fiber Reinforced Polymer Rebar (BFRP Rebar)
-
2. Application
- 2.1. Highways, Bridges & Buildings
- 2.2. Marine Structures & Waterfronts
- 2.3. Water Treatment Plants
- 2.4. Other Applications
Composite Rebar Market Segmentation By Geography
-
1. Asia Pacific
- 1.1. China
- 1.2. India
- 1.3. Japan
- 1.4. South Korea
- 1.5. Australia
- 1.6. Rest of Asia Pacific
-
2. North America
- 2.1. United States
- 2.2. Canada
- 2.3. Mexico
-
3. Europe
- 3.1. Germany
- 3.2. United Kingdom
- 3.3. Italy
- 3.4. France
- 3.5. Rest of Europe
-
4. South America
- 4.1. Brazil
- 4.2. Argentina
- 4.3. Rest of South America
-
5. Middle East and Africa
- 5.1. Saudi Arabia
- 5.2. South Africa
- 5.3. Rest of Middle East and Africa
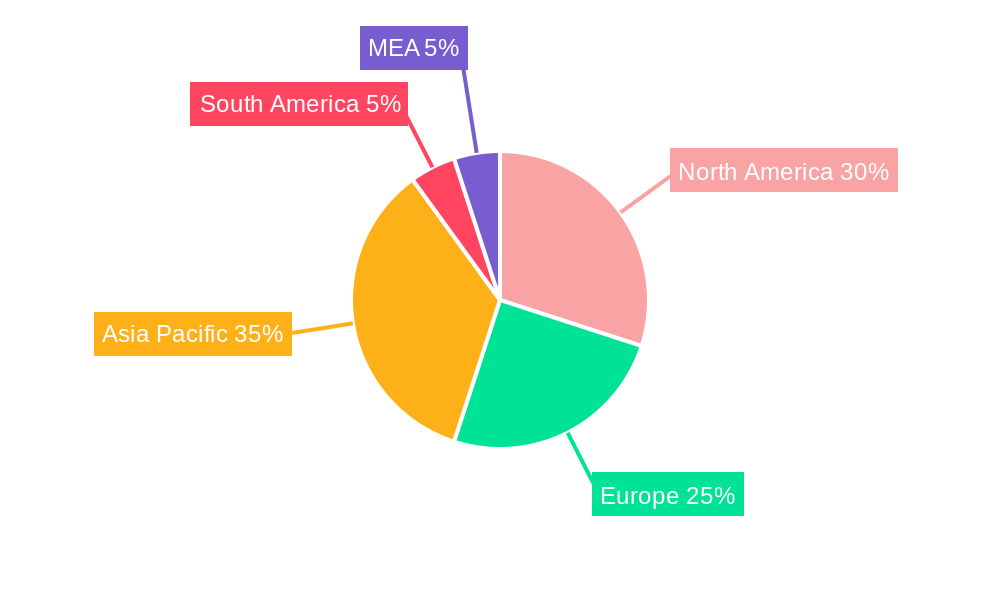
Composite Rebar Market Regional Market Share
Geographic Coverage of Composite Rebar Market
Composite Rebar Market REPORT HIGHLIGHTS
| Aspects | Details |
|---|---|
| Study Period | 2020-2034 |
| Base Year | 2025 |
| Estimated Year | 2026 |
| Forecast Period | 2026-2034 |
| Historical Period | 2020-2025 |
| Growth Rate | CAGR of 9.8% from 2020-2034 |
| Segmentation |
|
Table of Contents
- 1. Introduction
- 1.1. Research Scope
- 1.2. Market Segmentation
- 1.3. Research Objective
- 1.4. Definitions and Assumptions
- 2. Executive Summary
- 2.1. Market Snapshot
- 3. Market Dynamics
- 3.1. Market Drivers
- 3.2. Market Restrains
- 3.3. Market Trends
- 3.4. Market Opportunities
- 4. Market Factor Analysis
- 4.1. Porters Five Forces
- 4.1.1. Bargaining Power of Suppliers
- 4.1.2. Bargaining Power of Buyers
- 4.1.3. Threat of New Entrants
- 4.1.4. Threat of Substitutes
- 4.1.5. Competitive Rivalry
- 4.2. PESTEL analysis
- 4.3. BCG Analysis
- 4.3.1. Stars (High Growth, High Market Share)
- 4.3.2. Cash Cows (Low Growth, High Market Share)
- 4.3.3. Question Mark (High Growth, Low Market Share)
- 4.3.4. Dogs (Low Growth, Low Market Share)
- 4.4. Ansoff Matrix Analysis
- 4.5. Supply Chain Analysis
- 4.6. Regulatory Landscape
- 4.7. Current Market Potential and Opportunity Assessment (TAM–SAM–SOM Framework)
- 4.8. TIR Analyst Note
- 4.1. Porters Five Forces
- 5. Market Analysis, Insights and Forecast 2021-2033
- 5.1. Market Analysis, Insights and Forecast - by Product Type
- 5.1.1. Glass Fiber Reinforced Polymer Rebar (GFRP Rebar)
- 5.1.2. Carbon Fiber Reinforced Polymer Rebar (CFRP Rebar)
- 5.1.3. Basalt Fiber Reinforced Polymer Rebar (BFRP Rebar)
- 5.2. Market Analysis, Insights and Forecast - by Application
- 5.2.1. Highways, Bridges & Buildings
- 5.2.2. Marine Structures & Waterfronts
- 5.2.3. Water Treatment Plants
- 5.2.4. Other Applications
- 5.3. Market Analysis, Insights and Forecast - by Region
- 5.3.1. Asia Pacific
- 5.3.2. North America
- 5.3.3. Europe
- 5.3.4. South America
- 5.3.5. Middle East and Africa
- 5.1. Market Analysis, Insights and Forecast - by Product Type
- 6. Global Composite Rebar Market Analysis, Insights and Forecast, 2021-2033
- 6.1. Market Analysis, Insights and Forecast - by Product Type
- 6.1.1. Glass Fiber Reinforced Polymer Rebar (GFRP Rebar)
- 6.1.2. Carbon Fiber Reinforced Polymer Rebar (CFRP Rebar)
- 6.1.3. Basalt Fiber Reinforced Polymer Rebar (BFRP Rebar)
- 6.2. Market Analysis, Insights and Forecast - by Application
- 6.2.1. Highways, Bridges & Buildings
- 6.2.2. Marine Structures & Waterfronts
- 6.2.3. Water Treatment Plants
- 6.2.4. Other Applications
- 6.1. Market Analysis, Insights and Forecast - by Product Type
- 7. Asia Pacific Composite Rebar Market Analysis, Insights and Forecast, 2020-2032
- 7.1. Market Analysis, Insights and Forecast - by Product Type
- 7.1.1. Glass Fiber Reinforced Polymer Rebar (GFRP Rebar)
- 7.1.2. Carbon Fiber Reinforced Polymer Rebar (CFRP Rebar)
- 7.1.3. Basalt Fiber Reinforced Polymer Rebar (BFRP Rebar)
- 7.2. Market Analysis, Insights and Forecast - by Application
- 7.2.1. Highways, Bridges & Buildings
- 7.2.2. Marine Structures & Waterfronts
- 7.2.3. Water Treatment Plants
- 7.2.4. Other Applications
- 7.1. Market Analysis, Insights and Forecast - by Product Type
- 8. North America Composite Rebar Market Analysis, Insights and Forecast, 2020-2032
- 8.1. Market Analysis, Insights and Forecast - by Product Type
- 8.1.1. Glass Fiber Reinforced Polymer Rebar (GFRP Rebar)
- 8.1.2. Carbon Fiber Reinforced Polymer Rebar (CFRP Rebar)
- 8.1.3. Basalt Fiber Reinforced Polymer Rebar (BFRP Rebar)
- 8.2. Market Analysis, Insights and Forecast - by Application
- 8.2.1. Highways, Bridges & Buildings
- 8.2.2. Marine Structures & Waterfronts
- 8.2.3. Water Treatment Plants
- 8.2.4. Other Applications
- 8.1. Market Analysis, Insights and Forecast - by Product Type
- 9. Europe Composite Rebar Market Analysis, Insights and Forecast, 2020-2032
- 9.1. Market Analysis, Insights and Forecast - by Product Type
- 9.1.1. Glass Fiber Reinforced Polymer Rebar (GFRP Rebar)
- 9.1.2. Carbon Fiber Reinforced Polymer Rebar (CFRP Rebar)
- 9.1.3. Basalt Fiber Reinforced Polymer Rebar (BFRP Rebar)
- 9.2. Market Analysis, Insights and Forecast - by Application
- 9.2.1. Highways, Bridges & Buildings
- 9.2.2. Marine Structures & Waterfronts
- 9.2.3. Water Treatment Plants
- 9.2.4. Other Applications
- 9.1. Market Analysis, Insights and Forecast - by Product Type
- 10. South America Composite Rebar Market Analysis, Insights and Forecast, 2020-2032
- 10.1. Market Analysis, Insights and Forecast - by Product Type
- 10.1.1. Glass Fiber Reinforced Polymer Rebar (GFRP Rebar)
- 10.1.2. Carbon Fiber Reinforced Polymer Rebar (CFRP Rebar)
- 10.1.3. Basalt Fiber Reinforced Polymer Rebar (BFRP Rebar)
- 10.2. Market Analysis, Insights and Forecast - by Application
- 10.2.1. Highways, Bridges & Buildings
- 10.2.2. Marine Structures & Waterfronts
- 10.2.3. Water Treatment Plants
- 10.2.4. Other Applications
- 10.1. Market Analysis, Insights and Forecast - by Product Type
- 11. Middle East and Africa Composite Rebar Market Analysis, Insights and Forecast, 2020-2032
- 11.1. Market Analysis, Insights and Forecast - by Product Type
- 11.1.1. Glass Fiber Reinforced Polymer Rebar (GFRP Rebar)
- 11.1.2. Carbon Fiber Reinforced Polymer Rebar (CFRP Rebar)
- 11.1.3. Basalt Fiber Reinforced Polymer Rebar (BFRP Rebar)
- 11.2. Market Analysis, Insights and Forecast - by Application
- 11.2.1. Highways, Bridges & Buildings
- 11.2.2. Marine Structures & Waterfronts
- 11.2.3. Water Treatment Plants
- 11.2.4. Other Applications
- 11.1. Market Analysis, Insights and Forecast - by Product Type
- 12. Competitive Analysis
- 12.1. Company Profiles
- 12.1.1 Dextra Group
- 12.1.1.1. Company Overview
- 12.1.1.2. Products
- 12.1.1.3. Company Financials
- 12.1.1.4. SWOT Analysis
- 12.1.2 Nanjing Fenghui Composite Material Co Ltd
- 12.1.2.1. Company Overview
- 12.1.2.2. Products
- 12.1.2.3. Company Financials
- 12.1.2.4. SWOT Analysis
- 12.1.3 Composite Group Chelyabinsk
- 12.1.3.1. Company Overview
- 12.1.3.2. Products
- 12.1.3.3. Company Financials
- 12.1.3.4. SWOT Analysis
- 12.1.4 Kodiak Fiberglass Rebar LLC
- 12.1.4.1. Company Overview
- 12.1.4.2. Products
- 12.1.4.3. Company Financials
- 12.1.4.4. SWOT Analysis
- 12.1.5 Galen
- 12.1.5.1. Company Overview
- 12.1.5.2. Products
- 12.1.5.3. Company Financials
- 12.1.5.4. SWOT Analysis
- 12.1.6 Tribeni Fibres Pvt Ltd
- 12.1.6.1. Company Overview
- 12.1.6.2. Products
- 12.1.6.3. Company Financials
- 12.1.6.4. SWOT Analysis
- 12.1.7 Marshall Composite Technologies LLC
- 12.1.7.1. Company Overview
- 12.1.7.2. Products
- 12.1.7.3. Company Financials
- 12.1.7.4. SWOT Analysis
- 12.1.8 Captrad
- 12.1.8.1. Company Overview
- 12.1.8.2. Products
- 12.1.8.3. Company Financials
- 12.1.8.4. SWOT Analysis
- 12.1.9 Pultron Composites
- 12.1.9.1. Company Overview
- 12.1.9.2. Products
- 12.1.9.3. Company Financials
- 12.1.9.4. SWOT Analysis
- 12.1.10 Armastek
- 12.1.10.1. Company Overview
- 12.1.10.2. Products
- 12.1.10.3. Company Financials
- 12.1.10.4. SWOT Analysis
- 12.1.11 Schock Bauteile GmbH
- 12.1.11.1. Company Overview
- 12.1.11.2. Products
- 12.1.11.3. Company Financials
- 12.1.11.4. SWOT Analysis
- 12.1.12 Technobasalt-Invest LLC
- 12.1.12.1. Company Overview
- 12.1.12.2. Products
- 12.1.12.3. Company Financials
- 12.1.12.4. SWOT Analysis
- 12.1.1 Dextra Group
- 12.2. Market Entropy
- 12.2.1 Company's Key Areas Served
- 12.2.2 Recent Developments
- 12.3. Company Market Share Analysis 2025
- 12.3.1 Top 5 Companies Market Share Analysis
- 12.3.2 Top 3 Companies Market Share Analysis
- 12.4. List of Potential Customers
- 13. Research Methodology
List of Figures
- Figure 1: Global Composite Rebar Market Revenue Breakdown (million, %) by Region 2025 & 2033
- Figure 2: Global Composite Rebar Market Volume Breakdown (K Tons, %) by Region 2025 & 2033
- Figure 3: Asia Pacific Composite Rebar Market Revenue (million), by Product Type 2025 & 2033
- Figure 4: Asia Pacific Composite Rebar Market Volume (K Tons), by Product Type 2025 & 2033
- Figure 5: Asia Pacific Composite Rebar Market Revenue Share (%), by Product Type 2025 & 2033
- Figure 6: Asia Pacific Composite Rebar Market Volume Share (%), by Product Type 2025 & 2033
- Figure 7: Asia Pacific Composite Rebar Market Revenue (million), by Application 2025 & 2033
- Figure 8: Asia Pacific Composite Rebar Market Volume (K Tons), by Application 2025 & 2033
- Figure 9: Asia Pacific Composite Rebar Market Revenue Share (%), by Application 2025 & 2033
- Figure 10: Asia Pacific Composite Rebar Market Volume Share (%), by Application 2025 & 2033
- Figure 11: Asia Pacific Composite Rebar Market Revenue (million), by Country 2025 & 2033
- Figure 12: Asia Pacific Composite Rebar Market Volume (K Tons), by Country 2025 & 2033
- Figure 13: Asia Pacific Composite Rebar Market Revenue Share (%), by Country 2025 & 2033
- Figure 14: Asia Pacific Composite Rebar Market Volume Share (%), by Country 2025 & 2033
- Figure 15: North America Composite Rebar Market Revenue (million), by Product Type 2025 & 2033
- Figure 16: North America Composite Rebar Market Volume (K Tons), by Product Type 2025 & 2033
- Figure 17: North America Composite Rebar Market Revenue Share (%), by Product Type 2025 & 2033
- Figure 18: North America Composite Rebar Market Volume Share (%), by Product Type 2025 & 2033
- Figure 19: North America Composite Rebar Market Revenue (million), by Application 2025 & 2033
- Figure 20: North America Composite Rebar Market Volume (K Tons), by Application 2025 & 2033
- Figure 21: North America Composite Rebar Market Revenue Share (%), by Application 2025 & 2033
- Figure 22: North America Composite Rebar Market Volume Share (%), by Application 2025 & 2033
- Figure 23: North America Composite Rebar Market Revenue (million), by Country 2025 & 2033
- Figure 24: North America Composite Rebar Market Volume (K Tons), by Country 2025 & 2033
- Figure 25: North America Composite Rebar Market Revenue Share (%), by Country 2025 & 2033
- Figure 26: North America Composite Rebar Market Volume Share (%), by Country 2025 & 2033
- Figure 27: Europe Composite Rebar Market Revenue (million), by Product Type 2025 & 2033
- Figure 28: Europe Composite Rebar Market Volume (K Tons), by Product Type 2025 & 2033
- Figure 29: Europe Composite Rebar Market Revenue Share (%), by Product Type 2025 & 2033
- Figure 30: Europe Composite Rebar Market Volume Share (%), by Product Type 2025 & 2033
- Figure 31: Europe Composite Rebar Market Revenue (million), by Application 2025 & 2033
- Figure 32: Europe Composite Rebar Market Volume (K Tons), by Application 2025 & 2033
- Figure 33: Europe Composite Rebar Market Revenue Share (%), by Application 2025 & 2033
- Figure 34: Europe Composite Rebar Market Volume Share (%), by Application 2025 & 2033
- Figure 35: Europe Composite Rebar Market Revenue (million), by Country 2025 & 2033
- Figure 36: Europe Composite Rebar Market Volume (K Tons), by Country 2025 & 2033
- Figure 37: Europe Composite Rebar Market Revenue Share (%), by Country 2025 & 2033
- Figure 38: Europe Composite Rebar Market Volume Share (%), by Country 2025 & 2033
- Figure 39: South America Composite Rebar Market Revenue (million), by Product Type 2025 & 2033
- Figure 40: South America Composite Rebar Market Volume (K Tons), by Product Type 2025 & 2033
- Figure 41: South America Composite Rebar Market Revenue Share (%), by Product Type 2025 & 2033
- Figure 42: South America Composite Rebar Market Volume Share (%), by Product Type 2025 & 2033
- Figure 43: South America Composite Rebar Market Revenue (million), by Application 2025 & 2033
- Figure 44: South America Composite Rebar Market Volume (K Tons), by Application 2025 & 2033
- Figure 45: South America Composite Rebar Market Revenue Share (%), by Application 2025 & 2033
- Figure 46: South America Composite Rebar Market Volume Share (%), by Application 2025 & 2033
- Figure 47: South America Composite Rebar Market Revenue (million), by Country 2025 & 2033
- Figure 48: South America Composite Rebar Market Volume (K Tons), by Country 2025 & 2033
- Figure 49: South America Composite Rebar Market Revenue Share (%), by Country 2025 & 2033
- Figure 50: South America Composite Rebar Market Volume Share (%), by Country 2025 & 2033
- Figure 51: Middle East and Africa Composite Rebar Market Revenue (million), by Product Type 2025 & 2033
- Figure 52: Middle East and Africa Composite Rebar Market Volume (K Tons), by Product Type 2025 & 2033
- Figure 53: Middle East and Africa Composite Rebar Market Revenue Share (%), by Product Type 2025 & 2033
- Figure 54: Middle East and Africa Composite Rebar Market Volume Share (%), by Product Type 2025 & 2033
- Figure 55: Middle East and Africa Composite Rebar Market Revenue (million), by Application 2025 & 2033
- Figure 56: Middle East and Africa Composite Rebar Market Volume (K Tons), by Application 2025 & 2033
- Figure 57: Middle East and Africa Composite Rebar Market Revenue Share (%), by Application 2025 & 2033
- Figure 58: Middle East and Africa Composite Rebar Market Volume Share (%), by Application 2025 & 2033
- Figure 59: Middle East and Africa Composite Rebar Market Revenue (million), by Country 2025 & 2033
- Figure 60: Middle East and Africa Composite Rebar Market Volume (K Tons), by Country 2025 & 2033
- Figure 61: Middle East and Africa Composite Rebar Market Revenue Share (%), by Country 2025 & 2033
- Figure 62: Middle East and Africa Composite Rebar Market Volume Share (%), by Country 2025 & 2033
List of Tables
- Table 1: Global Composite Rebar Market Revenue million Forecast, by Product Type 2020 & 2033
- Table 2: Global Composite Rebar Market Volume K Tons Forecast, by Product Type 2020 & 2033
- Table 3: Global Composite Rebar Market Revenue million Forecast, by Application 2020 & 2033
- Table 4: Global Composite Rebar Market Volume K Tons Forecast, by Application 2020 & 2033
- Table 5: Global Composite Rebar Market Revenue million Forecast, by Region 2020 & 2033
- Table 6: Global Composite Rebar Market Volume K Tons Forecast, by Region 2020 & 2033
- Table 7: Global Composite Rebar Market Revenue million Forecast, by Product Type 2020 & 2033
- Table 8: Global Composite Rebar Market Volume K Tons Forecast, by Product Type 2020 & 2033
- Table 9: Global Composite Rebar Market Revenue million Forecast, by Application 2020 & 2033
- Table 10: Global Composite Rebar Market Volume K Tons Forecast, by Application 2020 & 2033
- Table 11: Global Composite Rebar Market Revenue million Forecast, by Country 2020 & 2033
- Table 12: Global Composite Rebar Market Volume K Tons Forecast, by Country 2020 & 2033
- Table 13: China Composite Rebar Market Revenue (million) Forecast, by Application 2020 & 2033
- Table 14: China Composite Rebar Market Volume (K Tons) Forecast, by Application 2020 & 2033
- Table 15: India Composite Rebar Market Revenue (million) Forecast, by Application 2020 & 2033
- Table 16: India Composite Rebar Market Volume (K Tons) Forecast, by Application 2020 & 2033
- Table 17: Japan Composite Rebar Market Revenue (million) Forecast, by Application 2020 & 2033
- Table 18: Japan Composite Rebar Market Volume (K Tons) Forecast, by Application 2020 & 2033
- Table 19: South Korea Composite Rebar Market Revenue (million) Forecast, by Application 2020 & 2033
- Table 20: South Korea Composite Rebar Market Volume (K Tons) Forecast, by Application 2020 & 2033
- Table 21: Australia Composite Rebar Market Revenue (million) Forecast, by Application 2020 & 2033
- Table 22: Australia Composite Rebar Market Volume (K Tons) Forecast, by Application 2020 & 2033
- Table 23: Rest of Asia Pacific Composite Rebar Market Revenue (million) Forecast, by Application 2020 & 2033
- Table 24: Rest of Asia Pacific Composite Rebar Market Volume (K Tons) Forecast, by Application 2020 & 2033
- Table 25: Global Composite Rebar Market Revenue million Forecast, by Product Type 2020 & 2033
- Table 26: Global Composite Rebar Market Volume K Tons Forecast, by Product Type 2020 & 2033
- Table 27: Global Composite Rebar Market Revenue million Forecast, by Application 2020 & 2033
- Table 28: Global Composite Rebar Market Volume K Tons Forecast, by Application 2020 & 2033
- Table 29: Global Composite Rebar Market Revenue million Forecast, by Country 2020 & 2033
- Table 30: Global Composite Rebar Market Volume K Tons Forecast, by Country 2020 & 2033
- Table 31: United States Composite Rebar Market Revenue (million) Forecast, by Application 2020 & 2033
- Table 32: United States Composite Rebar Market Volume (K Tons) Forecast, by Application 2020 & 2033
- Table 33: Canada Composite Rebar Market Revenue (million) Forecast, by Application 2020 & 2033
- Table 34: Canada Composite Rebar Market Volume (K Tons) Forecast, by Application 2020 & 2033
- Table 35: Mexico Composite Rebar Market Revenue (million) Forecast, by Application 2020 & 2033
- Table 36: Mexico Composite Rebar Market Volume (K Tons) Forecast, by Application 2020 & 2033
- Table 37: Global Composite Rebar Market Revenue million Forecast, by Product Type 2020 & 2033
- Table 38: Global Composite Rebar Market Volume K Tons Forecast, by Product Type 2020 & 2033
- Table 39: Global Composite Rebar Market Revenue million Forecast, by Application 2020 & 2033
- Table 40: Global Composite Rebar Market Volume K Tons Forecast, by Application 2020 & 2033
- Table 41: Global Composite Rebar Market Revenue million Forecast, by Country 2020 & 2033
- Table 42: Global Composite Rebar Market Volume K Tons Forecast, by Country 2020 & 2033
- Table 43: Germany Composite Rebar Market Revenue (million) Forecast, by Application 2020 & 2033
- Table 44: Germany Composite Rebar Market Volume (K Tons) Forecast, by Application 2020 & 2033
- Table 45: United Kingdom Composite Rebar Market Revenue (million) Forecast, by Application 2020 & 2033
- Table 46: United Kingdom Composite Rebar Market Volume (K Tons) Forecast, by Application 2020 & 2033
- Table 47: Italy Composite Rebar Market Revenue (million) Forecast, by Application 2020 & 2033
- Table 48: Italy Composite Rebar Market Volume (K Tons) Forecast, by Application 2020 & 2033
- Table 49: France Composite Rebar Market Revenue (million) Forecast, by Application 2020 & 2033
- Table 50: France Composite Rebar Market Volume (K Tons) Forecast, by Application 2020 & 2033
- Table 51: Rest of Europe Composite Rebar Market Revenue (million) Forecast, by Application 2020 & 2033
- Table 52: Rest of Europe Composite Rebar Market Volume (K Tons) Forecast, by Application 2020 & 2033
- Table 53: Global Composite Rebar Market Revenue million Forecast, by Product Type 2020 & 2033
- Table 54: Global Composite Rebar Market Volume K Tons Forecast, by Product Type 2020 & 2033
- Table 55: Global Composite Rebar Market Revenue million Forecast, by Application 2020 & 2033
- Table 56: Global Composite Rebar Market Volume K Tons Forecast, by Application 2020 & 2033
- Table 57: Global Composite Rebar Market Revenue million Forecast, by Country 2020 & 2033
- Table 58: Global Composite Rebar Market Volume K Tons Forecast, by Country 2020 & 2033
- Table 59: Brazil Composite Rebar Market Revenue (million) Forecast, by Application 2020 & 2033
- Table 60: Brazil Composite Rebar Market Volume (K Tons) Forecast, by Application 2020 & 2033
- Table 61: Argentina Composite Rebar Market Revenue (million) Forecast, by Application 2020 & 2033
- Table 62: Argentina Composite Rebar Market Volume (K Tons) Forecast, by Application 2020 & 2033
- Table 63: Rest of South America Composite Rebar Market Revenue (million) Forecast, by Application 2020 & 2033
- Table 64: Rest of South America Composite Rebar Market Volume (K Tons) Forecast, by Application 2020 & 2033
- Table 65: Global Composite Rebar Market Revenue million Forecast, by Product Type 2020 & 2033
- Table 66: Global Composite Rebar Market Volume K Tons Forecast, by Product Type 2020 & 2033
- Table 67: Global Composite Rebar Market Revenue million Forecast, by Application 2020 & 2033
- Table 68: Global Composite Rebar Market Volume K Tons Forecast, by Application 2020 & 2033
- Table 69: Global Composite Rebar Market Revenue million Forecast, by Country 2020 & 2033
- Table 70: Global Composite Rebar Market Volume K Tons Forecast, by Country 2020 & 2033
- Table 71: Saudi Arabia Composite Rebar Market Revenue (million) Forecast, by Application 2020 & 2033
- Table 72: Saudi Arabia Composite Rebar Market Volume (K Tons) Forecast, by Application 2020 & 2033
- Table 73: South Africa Composite Rebar Market Revenue (million) Forecast, by Application 2020 & 2033
- Table 74: South Africa Composite Rebar Market Volume (K Tons) Forecast, by Application 2020 & 2033
- Table 75: Rest of Middle East and Africa Composite Rebar Market Revenue (million) Forecast, by Application 2020 & 2033
- Table 76: Rest of Middle East and Africa Composite Rebar Market Volume (K Tons) Forecast, by Application 2020 & 2033
Frequently Asked Questions
1. What is the projected Compound Annual Growth Rate (CAGR) of the Composite Rebar Market?
The projected CAGR is approximately 9.8%.
2. Which companies are prominent players in the Composite Rebar Market?
Key companies in the market include Dextra Group, Nanjing Fenghui Composite Material Co Ltd, Composite Group Chelyabinsk, Kodiak Fiberglass Rebar LLC, Galen, Tribeni Fibres Pvt Ltd, Marshall Composite Technologies LLC, Captrad, Pultron Composites, Armastek, Schock Bauteile GmbH, Technobasalt-Invest LLC.
3. What are the main segments of the Composite Rebar Market?
The market segments include Product Type, Application.
4. Can you provide details about the market size?
The market size is estimated to be USD 744 million as of 2022.
5. What are some drivers contributing to market growth?
Increasing Usage in Highways. Bridges. and Buildings; Increasing Demand in Marine Structures.
6. What are the notable trends driving market growth?
Highways. Bridges & Buildings segment to Dominate the Market.
7. Are there any restraints impacting market growth?
Low Acceptance of FRP Rebars Among Construction Professionals; Other Restraints.
8. Can you provide examples of recent developments in the market?
In June 2022, Pultron Composites and Owens Corning signed a joint venture to manufacture industry-leading fiberglass rebar. This helps the company to obtain greater access to the global market, including expansion in the United States.
9. What pricing options are available for accessing the report?
Pricing options include single-user, multi-user, and enterprise licenses priced at USD 4750, USD 5250, and USD 8750 respectively.
10. Is the market size provided in terms of value or volume?
The market size is provided in terms of value, measured in million and volume, measured in K Tons.
11. Are there any specific market keywords associated with the report?
Yes, the market keyword associated with the report is "Composite Rebar Market," which aids in identifying and referencing the specific market segment covered.
12. How do I determine which pricing option suits my needs best?
The pricing options vary based on user requirements and access needs. Individual users may opt for single-user licenses, while businesses requiring broader access may choose multi-user or enterprise licenses for cost-effective access to the report.
13. Are there any additional resources or data provided in the Composite Rebar Market report?
While the report offers comprehensive insights, it's advisable to review the specific contents or supplementary materials provided to ascertain if additional resources or data are available.
14. How can I stay updated on further developments or reports in the Composite Rebar Market?
To stay informed about further developments, trends, and reports in the Composite Rebar Market, consider subscribing to industry newsletters, following relevant companies and organizations, or regularly checking reputable industry news sources and publications.
Methodology
Step 1 - Identification of Relevant Samples Size from Population Database


Step 2 - Approaches for Defining Global Market Size (Value, Volume* & Price*)

Note*: In applicable scenarios
Step 3 - Data Sources
Primary Research
- Web Analytics
- Survey Reports
- Research Institute
- Latest Research Reports
- Opinion Leaders
Secondary Research
- Annual Reports
- White Paper
- Latest Press Release
- Industry Association
- Paid Database
- Investor Presentations

Step 4 - Data Triangulation
Involves using different sources of information in order to increase the validity of a study
These sources are likely to be stakeholders in a program - participants, other researchers, program staff, other community members, and so on.
Then we put all data in single framework & apply various statistical tools to find out the dynamic on the market.
During the analysis stage, feedback from the stakeholder groups would be compared to determine areas of agreement as well as areas of divergence