

Key Insights
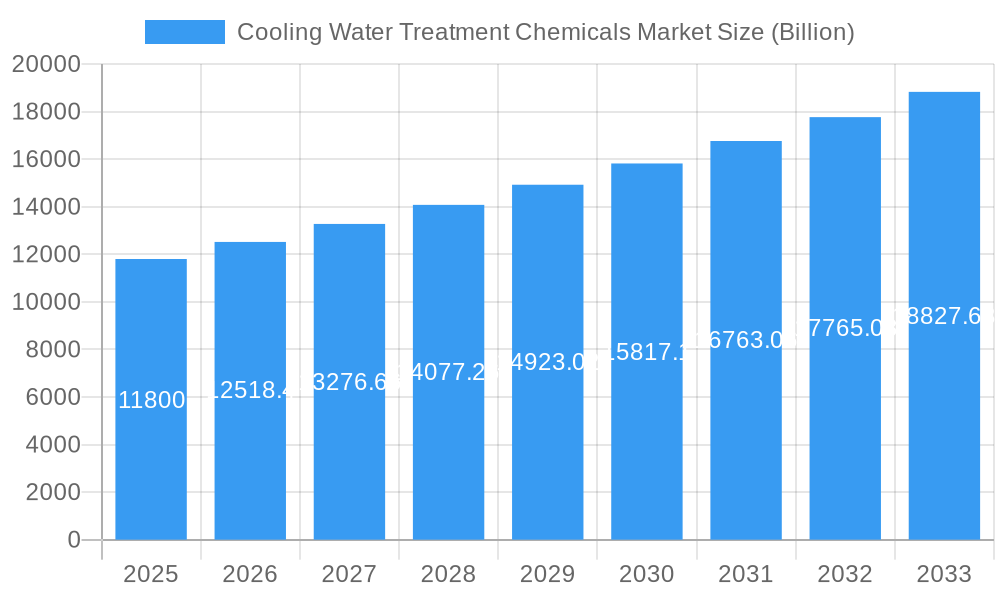
The Cooling Water Treatment Chemicals market is experiencing robust growth, projected to reach a value of $11.8 billion in 2025 and maintain a Compound Annual Growth Rate (CAGR) of 5.8% from 2025 to 2033. This expansion is driven by several key factors. Firstly, the increasing demand for power generation, particularly in developing economies, necessitates efficient cooling systems, leading to higher consumption of treatment chemicals. Secondly, stringent environmental regulations concerning water discharge are compelling industries to adopt advanced treatment solutions, boosting market demand. The rise of industrialization across sectors like petrochemicals, steel, and mining further fuels this growth. Technological advancements in chemical formulations, focusing on improved efficacy and reduced environmental impact, also contribute significantly. While the market faces some restraints, such as fluctuating raw material prices and the potential for substitution with alternative technologies, the overall outlook remains positive, primarily due to the enduring need for efficient and environmentally responsible cooling water management across diverse industrial applications.
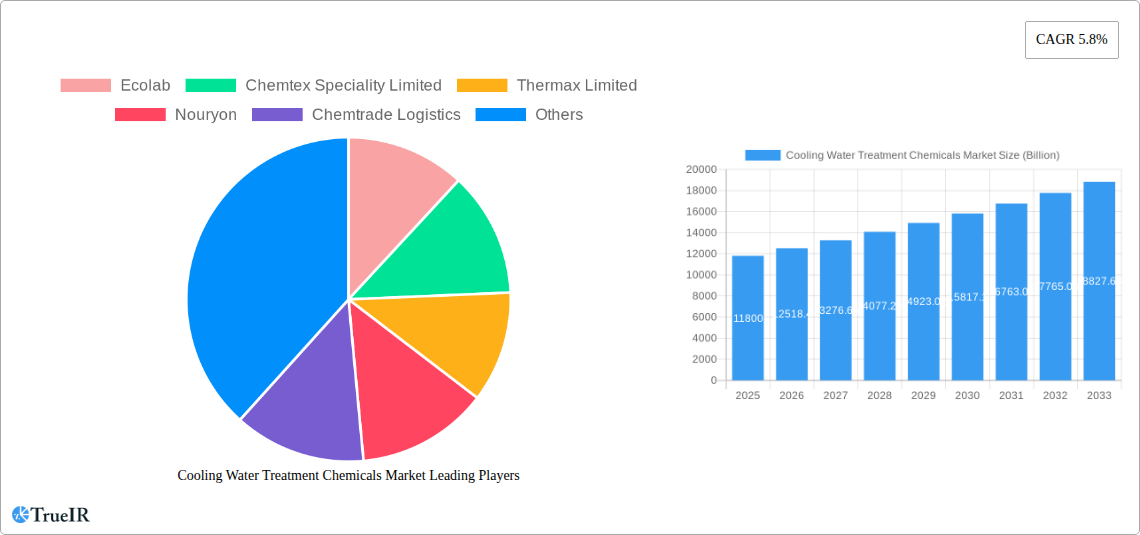
Cooling Water Treatment Chemicals Market Market Size (In Billion)
Market segmentation reveals significant opportunities within specific types of chemicals and end-user industries. Corrosion inhibitors and scale inhibitors constitute substantial segments, reflecting the critical need to protect expensive equipment and maintain operational efficiency. The power industry, steel manufacturing, and oil & gas sectors are major consumers, with their reliance on extensive cooling systems. Geographically, North America and Asia-Pacific are expected to be key growth regions, driven by robust industrial activity and infrastructure development. Leading players, including Ecolab, Chemtrade Logistics, and Kemira, are actively investing in research and development, expanding their product portfolios, and strategically acquiring smaller companies to consolidate their market positions. The competitive landscape is characterized by both established multinational corporations and specialized regional players, resulting in a dynamic market with opportunities for both innovation and consolidation.
Cooling Water Treatment Chemicals Market Company Market Share
Cooling Water Treatment Chemicals Market: A Comprehensive Report (2019-2033)
This dynamic report provides a comprehensive analysis of the Cooling Water Treatment Chemicals market, projecting a market value exceeding $XX Billion by 2033. It delves into market structure, competitive dynamics, dominant segments, and future growth potential, offering invaluable insights for industry stakeholders. The report covers the period from 2019 to 2033, with 2025 serving as the base and estimated year.
Cooling Water Treatment Chemicals Market Market Structure & Competitive Landscape
The Cooling Water Treatment Chemicals market exhibits a moderately consolidated structure, with several key players holding significant market share. The Herfindahl-Hirschman Index (HHI) is estimated at xx, indicating a competitive yet concentrated landscape. Innovation is a key driver, with companies continuously developing advanced chemistries to enhance efficiency and sustainability. Stringent environmental regulations are shaping the market, pushing manufacturers towards eco-friendly solutions. Product substitution is limited due to the specialized nature of cooling water treatment chemicals, although alternative technologies like membrane filtration are gaining traction. M&A activity has been relatively moderate in recent years, with an estimated xx Billion in transactions between 2019 and 2024, primarily driven by strategic expansions and technology acquisitions.
- Market Concentration: Moderately consolidated, with a HHI of xx.
- Innovation Drivers: Development of advanced chemistries, eco-friendly formulations, and digital solutions.
- Regulatory Impacts: Stringent environmental regulations impacting product development and manufacturing processes.
- Product Substitutes: Limited, with some competition from membrane filtration technologies.
- End-User Segmentation: Diverse, spanning power, steel, mining, petrochemicals, and food & beverage industries.
- M&A Trends: Moderate activity, primarily focused on strategic expansions and technology acquisitions.
Cooling Water Treatment Chemicals Market Market Trends & Opportunities
The Cooling Water Treatment Chemicals market is experiencing robust growth, driven by increasing industrialization, rising energy demands, and stringent environmental regulations. The market is projected to achieve a CAGR of xx% during the forecast period (2025-2033), reaching a value exceeding $XX Billion. Technological advancements, particularly in digitalization and smart chemical solutions (as seen with Italmatch Chemicals' new Smart-Tagged Polymers), are transforming the market. Consumer preferences are increasingly shifting towards sustainable and efficient solutions, fostering innovation in eco-friendly formulations. Competitive dynamics are characterized by ongoing innovation, strategic partnerships, and regional expansions. Market penetration rates are high in developed regions but show significant growth potential in emerging economies.
Dominant Markets & Segments in Cooling Water Treatment Chemicals Market
The Power Industry segment dominates the end-user industry landscape, driven by the critical need for efficient cooling systems in power generation. Geographically, the market is led by Asia-Pacific, followed by North America and Europe. Within product types, Corrosion Inhibitors hold the largest market share, due to their crucial role in preventing equipment damage.
- Leading Region: Asia-Pacific
- Leading End-User Industry: Power Industry
- Leading Product Type: Corrosion Inhibitors
Key Growth Drivers:
- Power Industry: Expanding power generation capacity globally, particularly in emerging economies.
- Steel Industry: Growing steel production and stringent water management regulations.
- Technological Advancements: Development of advanced chemistries with enhanced performance and sustainability.
- Government Regulations: Stringent environmental regulations mandating the use of effective and eco-friendly water treatment solutions.
Cooling Water Treatment Chemicals Market Product Analysis
The market showcases a wide array of chemicals, including corrosion inhibitors, scale inhibitors, biocides, and other specialized treatments. Recent innovations focus on enhancing performance, reducing environmental impact, and incorporating digital technologies for improved monitoring and control. Smart-tagged polymers and other digital solutions enable real-time performance tracking and optimization, providing a significant competitive advantage. The market fit for these advanced solutions is high, particularly in large-scale industrial applications demanding precise control and enhanced efficiency.
Key Drivers, Barriers & Challenges in Cooling Water Treatment Chemicals Market
Key Drivers:
The market is propelled by increasing industrialization, stringent environmental regulations, the need for improved cooling efficiency, and technological advancements like digital solutions offering better performance monitoring and control.
Challenges & Restraints:
Fluctuations in raw material prices, supply chain disruptions, and stringent regulatory compliance requirements pose significant challenges. Competitive pressures and the need for continuous innovation also impact profitability and market penetration. The impact of these challenges can be quantified through reduced profit margins and potential delays in project implementation.
Growth Drivers in the Cooling Water Treatment Chemicals Market Market
Growth is driven by expanding industrial capacity globally, particularly in developing economies. Stringent environmental regulations are pushing the adoption of eco-friendly solutions. Advancements in digital technologies are enabling improved efficiency and performance monitoring.
Challenges Impacting Cooling Water Treatment Chemicals Market Growth
Raw material price volatility and supply chain disruptions create uncertainty. Stringent regulatory compliance requires significant investment. Intense competition necessitates continuous innovation and cost optimization.
Significant Cooling Water Treatment Chemicals Market Industry Milestones
- October 2022: Italmatch Chemicals launched its Smart-Tagged Polymers brand line for industrial water treatment, enhancing digital performance control.
- February 2022: SUEZ secured a contract for the construction of a seawater desalination plant, highlighting the growing importance of water treatment solutions.
Future Outlook for Cooling Water Treatment Chemicals Market Market
The market is poised for continued growth, driven by expanding industrialization, stringent environmental regulations, and technological advancements. Strategic partnerships, regional expansions, and the development of innovative, sustainable solutions will shape the market landscape. The market presents significant opportunities for companies focused on delivering efficient, eco-friendly, and technologically advanced cooling water treatment solutions.
Cooling Water Treatment Chemicals Market Segmentation
-
1. Type
- 1.1. Corrosion Inhibitor
- 1.2. Scale Inhibitor
- 1.3. Biocide
- 1.4. Other Types
-
2. End-user Industry
- 2.1. Power Industry
- 2.2. Steel, Mining & Metallurgy
- 2.3. Petrochemicals and Oil and Gas
- 2.4. Food and Beverage
- 2.5. Textile and Dyes
- 2.6. Other End-user Industries
Cooling Water Treatment Chemicals Market Segmentation By Geography
-
1. Asia Pacific
- 1.1. China
- 1.2. India
- 1.3. Japan
- 1.4. South Korea
- 1.5. Rest of Asia Pacific
-
2. North America
- 2.1. United States
- 2.2. Canada
- 2.3. Mexico
-
3. Europe
- 3.1. Germany
- 3.2. United Kingdom
- 3.3. France
- 3.4. Italy
- 3.5. Rest of Europe
-
4. South America
- 4.1. Brazil
- 4.2. Argentina
- 4.3. Rest of South America
- 5. Middle East
-
6. Saudi Arabia
- 6.1. South Africa
- 6.2. Rest of Middle East
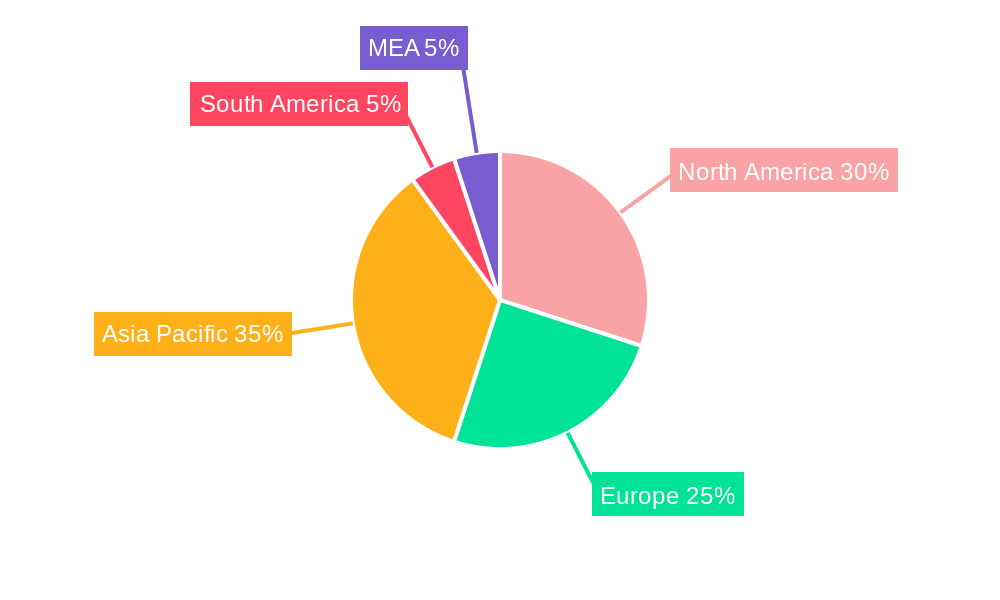
Cooling Water Treatment Chemicals Market Regional Market Share
Geographic Coverage of Cooling Water Treatment Chemicals Market
Cooling Water Treatment Chemicals Market REPORT HIGHLIGHTS
| Aspects | Details |
|---|---|
| Study Period | 2020-2034 |
| Base Year | 2025 |
| Estimated Year | 2026 |
| Forecast Period | 2026-2034 |
| Historical Period | 2020-2025 |
| Growth Rate | CAGR of 5.8% from 2020-2034 |
| Segmentation |
|
Table of Contents
- 1. Introduction
- 1.1. Research Scope
- 1.2. Market Segmentation
- 1.3. Research Objective
- 1.4. Definitions and Assumptions
- 2. Executive Summary
- 2.1. Market Snapshot
- 3. Market Dynamics
- 3.1. Market Drivers
- 3.2. Market Restrains
- 3.3. Market Trends
- 3.4. Market Opportunities
- 4. Market Factor Analysis
- 4.1. Porters Five Forces
- 4.1.1. Bargaining Power of Suppliers
- 4.1.2. Bargaining Power of Buyers
- 4.1.3. Threat of New Entrants
- 4.1.4. Threat of Substitutes
- 4.1.5. Competitive Rivalry
- 4.2. PESTEL analysis
- 4.3. BCG Analysis
- 4.3.1. Stars (High Growth, High Market Share)
- 4.3.2. Cash Cows (Low Growth, High Market Share)
- 4.3.3. Question Mark (High Growth, Low Market Share)
- 4.3.4. Dogs (Low Growth, Low Market Share)
- 4.4. Ansoff Matrix Analysis
- 4.5. Supply Chain Analysis
- 4.6. Regulatory Landscape
- 4.7. Current Market Potential and Opportunity Assessment (TAM–SAM–SOM Framework)
- 4.8. TIR Analyst Note
- 4.1. Porters Five Forces
- 5. Market Analysis, Insights and Forecast 2021-2033
- 5.1. Market Analysis, Insights and Forecast - by Type
- 5.1.1. Corrosion Inhibitor
- 5.1.2. Scale Inhibitor
- 5.1.3. Biocide
- 5.1.4. Other Types
- 5.2. Market Analysis, Insights and Forecast - by End-user Industry
- 5.2.1. Power Industry
- 5.2.2. Steel, Mining & Metallurgy
- 5.2.3. Petrochemicals and Oil and Gas
- 5.2.4. Food and Beverage
- 5.2.5. Textile and Dyes
- 5.2.6. Other End-user Industries
- 5.3. Market Analysis, Insights and Forecast - by Region
- 5.3.1. Asia Pacific
- 5.3.2. North America
- 5.3.3. Europe
- 5.3.4. South America
- 5.3.5. Middle East
- 5.3.6. Saudi Arabia
- 5.1. Market Analysis, Insights and Forecast - by Type
- 6. Global Cooling Water Treatment Chemicals Market Analysis, Insights and Forecast, 2021-2033
- 6.1. Market Analysis, Insights and Forecast - by Type
- 6.1.1. Corrosion Inhibitor
- 6.1.2. Scale Inhibitor
- 6.1.3. Biocide
- 6.1.4. Other Types
- 6.2. Market Analysis, Insights and Forecast - by End-user Industry
- 6.2.1. Power Industry
- 6.2.2. Steel, Mining & Metallurgy
- 6.2.3. Petrochemicals and Oil and Gas
- 6.2.4. Food and Beverage
- 6.2.5. Textile and Dyes
- 6.2.6. Other End-user Industries
- 6.1. Market Analysis, Insights and Forecast - by Type
- 7. Asia Pacific Cooling Water Treatment Chemicals Market Analysis, Insights and Forecast, 2020-2032
- 7.1. Market Analysis, Insights and Forecast - by Type
- 7.1.1. Corrosion Inhibitor
- 7.1.2. Scale Inhibitor
- 7.1.3. Biocide
- 7.1.4. Other Types
- 7.2. Market Analysis, Insights and Forecast - by End-user Industry
- 7.2.1. Power Industry
- 7.2.2. Steel, Mining & Metallurgy
- 7.2.3. Petrochemicals and Oil and Gas
- 7.2.4. Food and Beverage
- 7.2.5. Textile and Dyes
- 7.2.6. Other End-user Industries
- 7.1. Market Analysis, Insights and Forecast - by Type
- 8. North America Cooling Water Treatment Chemicals Market Analysis, Insights and Forecast, 2020-2032
- 8.1. Market Analysis, Insights and Forecast - by Type
- 8.1.1. Corrosion Inhibitor
- 8.1.2. Scale Inhibitor
- 8.1.3. Biocide
- 8.1.4. Other Types
- 8.2. Market Analysis, Insights and Forecast - by End-user Industry
- 8.2.1. Power Industry
- 8.2.2. Steel, Mining & Metallurgy
- 8.2.3. Petrochemicals and Oil and Gas
- 8.2.4. Food and Beverage
- 8.2.5. Textile and Dyes
- 8.2.6. Other End-user Industries
- 8.1. Market Analysis, Insights and Forecast - by Type
- 9. Europe Cooling Water Treatment Chemicals Market Analysis, Insights and Forecast, 2020-2032
- 9.1. Market Analysis, Insights and Forecast - by Type
- 9.1.1. Corrosion Inhibitor
- 9.1.2. Scale Inhibitor
- 9.1.3. Biocide
- 9.1.4. Other Types
- 9.2. Market Analysis, Insights and Forecast - by End-user Industry
- 9.2.1. Power Industry
- 9.2.2. Steel, Mining & Metallurgy
- 9.2.3. Petrochemicals and Oil and Gas
- 9.2.4. Food and Beverage
- 9.2.5. Textile and Dyes
- 9.2.6. Other End-user Industries
- 9.1. Market Analysis, Insights and Forecast - by Type
- 10. South America Cooling Water Treatment Chemicals Market Analysis, Insights and Forecast, 2020-2032
- 10.1. Market Analysis, Insights and Forecast - by Type
- 10.1.1. Corrosion Inhibitor
- 10.1.2. Scale Inhibitor
- 10.1.3. Biocide
- 10.1.4. Other Types
- 10.2. Market Analysis, Insights and Forecast - by End-user Industry
- 10.2.1. Power Industry
- 10.2.2. Steel, Mining & Metallurgy
- 10.2.3. Petrochemicals and Oil and Gas
- 10.2.4. Food and Beverage
- 10.2.5. Textile and Dyes
- 10.2.6. Other End-user Industries
- 10.1. Market Analysis, Insights and Forecast - by Type
- 11. Middle East Cooling Water Treatment Chemicals Market Analysis, Insights and Forecast, 2020-2032
- 11.1. Market Analysis, Insights and Forecast - by Type
- 11.1.1. Corrosion Inhibitor
- 11.1.2. Scale Inhibitor
- 11.1.3. Biocide
- 11.1.4. Other Types
- 11.2. Market Analysis, Insights and Forecast - by End-user Industry
- 11.2.1. Power Industry
- 11.2.2. Steel, Mining & Metallurgy
- 11.2.3. Petrochemicals and Oil and Gas
- 11.2.4. Food and Beverage
- 11.2.5. Textile and Dyes
- 11.2.6. Other End-user Industries
- 11.1. Market Analysis, Insights and Forecast - by Type
- 12. Saudi Arabia Cooling Water Treatment Chemicals Market Analysis, Insights and Forecast, 2020-2032
- 12.1. Market Analysis, Insights and Forecast - by Type
- 12.1.1. Corrosion Inhibitor
- 12.1.2. Scale Inhibitor
- 12.1.3. Biocide
- 12.1.4. Other Types
- 12.2. Market Analysis, Insights and Forecast - by End-user Industry
- 12.2.1. Power Industry
- 12.2.2. Steel, Mining & Metallurgy
- 12.2.3. Petrochemicals and Oil and Gas
- 12.2.4. Food and Beverage
- 12.2.5. Textile and Dyes
- 12.2.6. Other End-user Industries
- 12.1. Market Analysis, Insights and Forecast - by Type
- 13. Competitive Analysis
- 13.1. Company Profiles
- 13.1.1 Ecolab
- 13.1.1.1. Company Overview
- 13.1.1.2. Products
- 13.1.1.3. Company Financials
- 13.1.1.4. SWOT Analysis
- 13.1.2 Chemtex Speciality Limited
- 13.1.2.1. Company Overview
- 13.1.2.2. Products
- 13.1.2.3. Company Financials
- 13.1.2.4. SWOT Analysis
- 13.1.3 Thermax Limited
- 13.1.3.1. Company Overview
- 13.1.3.2. Products
- 13.1.3.3. Company Financials
- 13.1.3.4. SWOT Analysis
- 13.1.4 Nouryon
- 13.1.4.1. Company Overview
- 13.1.4.2. Products
- 13.1.4.3. Company Financials
- 13.1.4.4. SWOT Analysis
- 13.1.5 Chemtrade Logistics
- 13.1.5.1. Company Overview
- 13.1.5.2. Products
- 13.1.5.3. Company Financials
- 13.1.5.4. SWOT Analysis
- 13.1.6 Buckman
- 13.1.6.1. Company Overview
- 13.1.6.2. Products
- 13.1.6.3. Company Financials
- 13.1.6.4. SWOT Analysis
- 13.1.7 Kemira
- 13.1.7.1. Company Overview
- 13.1.7.2. Products
- 13.1.7.3. Company Financials
- 13.1.7.4. SWOT Analysis
- 13.1.8 DuPont
- 13.1.8.1. Company Overview
- 13.1.8.2. Products
- 13.1.8.3. Company Financials
- 13.1.8.4. SWOT Analysis
- 13.1.9 Solenis
- 13.1.9.1. Company Overview
- 13.1.9.2. Products
- 13.1.9.3. Company Financials
- 13.1.9.4. SWOT Analysis
- 13.1.10 Italmatch Chemicals
- 13.1.10.1. Company Overview
- 13.1.10.2. Products
- 13.1.10.3. Company Financials
- 13.1.10.4. SWOT Analysis
- 13.1.11 Suez
- 13.1.11.1. Company Overview
- 13.1.11.2. Products
- 13.1.11.3. Company Financials
- 13.1.11.4. SWOT Analysis
- 13.1.12 Veolia
- 13.1.12.1. Company Overview
- 13.1.12.2. Products
- 13.1.12.3. Company Financials
- 13.1.12.4. SWOT Analysis
- 13.1.13 Albemarle Corporation
- 13.1.13.1. Company Overview
- 13.1.13.2. Products
- 13.1.13.3. Company Financials
- 13.1.13.4. SWOT Analysis
- 13.1.14 DuBois Chemicals
- 13.1.14.1. Company Overview
- 13.1.14.2. Products
- 13.1.14.3. Company Financials
- 13.1.14.4. SWOT Analysis
- 13.1.1 Ecolab
- 13.2. Market Entropy
- 13.2.1 Company's Key Areas Served
- 13.2.2 Recent Developments
- 13.3. Company Market Share Analysis 2025
- 13.3.1 Top 5 Companies Market Share Analysis
- 13.3.2 Top 3 Companies Market Share Analysis
- 13.4. List of Potential Customers
- 14. Research Methodology
List of Figures
- Figure 1: Global Cooling Water Treatment Chemicals Market Revenue Breakdown (Billion, %) by Region 2025 & 2033
- Figure 2: Global Cooling Water Treatment Chemicals Market Volume Breakdown (K Tons, %) by Region 2025 & 2033
- Figure 3: Asia Pacific Cooling Water Treatment Chemicals Market Revenue (Billion), by Type 2025 & 2033
- Figure 4: Asia Pacific Cooling Water Treatment Chemicals Market Volume (K Tons), by Type 2025 & 2033
- Figure 5: Asia Pacific Cooling Water Treatment Chemicals Market Revenue Share (%), by Type 2025 & 2033
- Figure 6: Asia Pacific Cooling Water Treatment Chemicals Market Volume Share (%), by Type 2025 & 2033
- Figure 7: Asia Pacific Cooling Water Treatment Chemicals Market Revenue (Billion), by End-user Industry 2025 & 2033
- Figure 8: Asia Pacific Cooling Water Treatment Chemicals Market Volume (K Tons), by End-user Industry 2025 & 2033
- Figure 9: Asia Pacific Cooling Water Treatment Chemicals Market Revenue Share (%), by End-user Industry 2025 & 2033
- Figure 10: Asia Pacific Cooling Water Treatment Chemicals Market Volume Share (%), by End-user Industry 2025 & 2033
- Figure 11: Asia Pacific Cooling Water Treatment Chemicals Market Revenue (Billion), by Country 2025 & 2033
- Figure 12: Asia Pacific Cooling Water Treatment Chemicals Market Volume (K Tons), by Country 2025 & 2033
- Figure 13: Asia Pacific Cooling Water Treatment Chemicals Market Revenue Share (%), by Country 2025 & 2033
- Figure 14: Asia Pacific Cooling Water Treatment Chemicals Market Volume Share (%), by Country 2025 & 2033
- Figure 15: North America Cooling Water Treatment Chemicals Market Revenue (Billion), by Type 2025 & 2033
- Figure 16: North America Cooling Water Treatment Chemicals Market Volume (K Tons), by Type 2025 & 2033
- Figure 17: North America Cooling Water Treatment Chemicals Market Revenue Share (%), by Type 2025 & 2033
- Figure 18: North America Cooling Water Treatment Chemicals Market Volume Share (%), by Type 2025 & 2033
- Figure 19: North America Cooling Water Treatment Chemicals Market Revenue (Billion), by End-user Industry 2025 & 2033
- Figure 20: North America Cooling Water Treatment Chemicals Market Volume (K Tons), by End-user Industry 2025 & 2033
- Figure 21: North America Cooling Water Treatment Chemicals Market Revenue Share (%), by End-user Industry 2025 & 2033
- Figure 22: North America Cooling Water Treatment Chemicals Market Volume Share (%), by End-user Industry 2025 & 2033
- Figure 23: North America Cooling Water Treatment Chemicals Market Revenue (Billion), by Country 2025 & 2033
- Figure 24: North America Cooling Water Treatment Chemicals Market Volume (K Tons), by Country 2025 & 2033
- Figure 25: North America Cooling Water Treatment Chemicals Market Revenue Share (%), by Country 2025 & 2033
- Figure 26: North America Cooling Water Treatment Chemicals Market Volume Share (%), by Country 2025 & 2033
- Figure 27: Europe Cooling Water Treatment Chemicals Market Revenue (Billion), by Type 2025 & 2033
- Figure 28: Europe Cooling Water Treatment Chemicals Market Volume (K Tons), by Type 2025 & 2033
- Figure 29: Europe Cooling Water Treatment Chemicals Market Revenue Share (%), by Type 2025 & 2033
- Figure 30: Europe Cooling Water Treatment Chemicals Market Volume Share (%), by Type 2025 & 2033
- Figure 31: Europe Cooling Water Treatment Chemicals Market Revenue (Billion), by End-user Industry 2025 & 2033
- Figure 32: Europe Cooling Water Treatment Chemicals Market Volume (K Tons), by End-user Industry 2025 & 2033
- Figure 33: Europe Cooling Water Treatment Chemicals Market Revenue Share (%), by End-user Industry 2025 & 2033
- Figure 34: Europe Cooling Water Treatment Chemicals Market Volume Share (%), by End-user Industry 2025 & 2033
- Figure 35: Europe Cooling Water Treatment Chemicals Market Revenue (Billion), by Country 2025 & 2033
- Figure 36: Europe Cooling Water Treatment Chemicals Market Volume (K Tons), by Country 2025 & 2033
- Figure 37: Europe Cooling Water Treatment Chemicals Market Revenue Share (%), by Country 2025 & 2033
- Figure 38: Europe Cooling Water Treatment Chemicals Market Volume Share (%), by Country 2025 & 2033
- Figure 39: South America Cooling Water Treatment Chemicals Market Revenue (Billion), by Type 2025 & 2033
- Figure 40: South America Cooling Water Treatment Chemicals Market Volume (K Tons), by Type 2025 & 2033
- Figure 41: South America Cooling Water Treatment Chemicals Market Revenue Share (%), by Type 2025 & 2033
- Figure 42: South America Cooling Water Treatment Chemicals Market Volume Share (%), by Type 2025 & 2033
- Figure 43: South America Cooling Water Treatment Chemicals Market Revenue (Billion), by End-user Industry 2025 & 2033
- Figure 44: South America Cooling Water Treatment Chemicals Market Volume (K Tons), by End-user Industry 2025 & 2033
- Figure 45: South America Cooling Water Treatment Chemicals Market Revenue Share (%), by End-user Industry 2025 & 2033
- Figure 46: South America Cooling Water Treatment Chemicals Market Volume Share (%), by End-user Industry 2025 & 2033
- Figure 47: South America Cooling Water Treatment Chemicals Market Revenue (Billion), by Country 2025 & 2033
- Figure 48: South America Cooling Water Treatment Chemicals Market Volume (K Tons), by Country 2025 & 2033
- Figure 49: South America Cooling Water Treatment Chemicals Market Revenue Share (%), by Country 2025 & 2033
- Figure 50: South America Cooling Water Treatment Chemicals Market Volume Share (%), by Country 2025 & 2033
- Figure 51: Middle East Cooling Water Treatment Chemicals Market Revenue (Billion), by Type 2025 & 2033
- Figure 52: Middle East Cooling Water Treatment Chemicals Market Volume (K Tons), by Type 2025 & 2033
- Figure 53: Middle East Cooling Water Treatment Chemicals Market Revenue Share (%), by Type 2025 & 2033
- Figure 54: Middle East Cooling Water Treatment Chemicals Market Volume Share (%), by Type 2025 & 2033
- Figure 55: Middle East Cooling Water Treatment Chemicals Market Revenue (Billion), by End-user Industry 2025 & 2033
- Figure 56: Middle East Cooling Water Treatment Chemicals Market Volume (K Tons), by End-user Industry 2025 & 2033
- Figure 57: Middle East Cooling Water Treatment Chemicals Market Revenue Share (%), by End-user Industry 2025 & 2033
- Figure 58: Middle East Cooling Water Treatment Chemicals Market Volume Share (%), by End-user Industry 2025 & 2033
- Figure 59: Middle East Cooling Water Treatment Chemicals Market Revenue (Billion), by Country 2025 & 2033
- Figure 60: Middle East Cooling Water Treatment Chemicals Market Volume (K Tons), by Country 2025 & 2033
- Figure 61: Middle East Cooling Water Treatment Chemicals Market Revenue Share (%), by Country 2025 & 2033
- Figure 62: Middle East Cooling Water Treatment Chemicals Market Volume Share (%), by Country 2025 & 2033
- Figure 63: Saudi Arabia Cooling Water Treatment Chemicals Market Revenue (Billion), by Type 2025 & 2033
- Figure 64: Saudi Arabia Cooling Water Treatment Chemicals Market Volume (K Tons), by Type 2025 & 2033
- Figure 65: Saudi Arabia Cooling Water Treatment Chemicals Market Revenue Share (%), by Type 2025 & 2033
- Figure 66: Saudi Arabia Cooling Water Treatment Chemicals Market Volume Share (%), by Type 2025 & 2033
- Figure 67: Saudi Arabia Cooling Water Treatment Chemicals Market Revenue (Billion), by End-user Industry 2025 & 2033
- Figure 68: Saudi Arabia Cooling Water Treatment Chemicals Market Volume (K Tons), by End-user Industry 2025 & 2033
- Figure 69: Saudi Arabia Cooling Water Treatment Chemicals Market Revenue Share (%), by End-user Industry 2025 & 2033
- Figure 70: Saudi Arabia Cooling Water Treatment Chemicals Market Volume Share (%), by End-user Industry 2025 & 2033
- Figure 71: Saudi Arabia Cooling Water Treatment Chemicals Market Revenue (Billion), by Country 2025 & 2033
- Figure 72: Saudi Arabia Cooling Water Treatment Chemicals Market Volume (K Tons), by Country 2025 & 2033
- Figure 73: Saudi Arabia Cooling Water Treatment Chemicals Market Revenue Share (%), by Country 2025 & 2033
- Figure 74: Saudi Arabia Cooling Water Treatment Chemicals Market Volume Share (%), by Country 2025 & 2033
List of Tables
- Table 1: Global Cooling Water Treatment Chemicals Market Revenue Billion Forecast, by Type 2020 & 2033
- Table 2: Global Cooling Water Treatment Chemicals Market Volume K Tons Forecast, by Type 2020 & 2033
- Table 3: Global Cooling Water Treatment Chemicals Market Revenue Billion Forecast, by End-user Industry 2020 & 2033
- Table 4: Global Cooling Water Treatment Chemicals Market Volume K Tons Forecast, by End-user Industry 2020 & 2033
- Table 5: Global Cooling Water Treatment Chemicals Market Revenue Billion Forecast, by Region 2020 & 2033
- Table 6: Global Cooling Water Treatment Chemicals Market Volume K Tons Forecast, by Region 2020 & 2033
- Table 7: Global Cooling Water Treatment Chemicals Market Revenue Billion Forecast, by Type 2020 & 2033
- Table 8: Global Cooling Water Treatment Chemicals Market Volume K Tons Forecast, by Type 2020 & 2033
- Table 9: Global Cooling Water Treatment Chemicals Market Revenue Billion Forecast, by End-user Industry 2020 & 2033
- Table 10: Global Cooling Water Treatment Chemicals Market Volume K Tons Forecast, by End-user Industry 2020 & 2033
- Table 11: Global Cooling Water Treatment Chemicals Market Revenue Billion Forecast, by Country 2020 & 2033
- Table 12: Global Cooling Water Treatment Chemicals Market Volume K Tons Forecast, by Country 2020 & 2033
- Table 13: China Cooling Water Treatment Chemicals Market Revenue (Billion) Forecast, by Application 2020 & 2033
- Table 14: China Cooling Water Treatment Chemicals Market Volume (K Tons) Forecast, by Application 2020 & 2033
- Table 15: India Cooling Water Treatment Chemicals Market Revenue (Billion) Forecast, by Application 2020 & 2033
- Table 16: India Cooling Water Treatment Chemicals Market Volume (K Tons) Forecast, by Application 2020 & 2033
- Table 17: Japan Cooling Water Treatment Chemicals Market Revenue (Billion) Forecast, by Application 2020 & 2033
- Table 18: Japan Cooling Water Treatment Chemicals Market Volume (K Tons) Forecast, by Application 2020 & 2033
- Table 19: South Korea Cooling Water Treatment Chemicals Market Revenue (Billion) Forecast, by Application 2020 & 2033
- Table 20: South Korea Cooling Water Treatment Chemicals Market Volume (K Tons) Forecast, by Application 2020 & 2033
- Table 21: Rest of Asia Pacific Cooling Water Treatment Chemicals Market Revenue (Billion) Forecast, by Application 2020 & 2033
- Table 22: Rest of Asia Pacific Cooling Water Treatment Chemicals Market Volume (K Tons) Forecast, by Application 2020 & 2033
- Table 23: Global Cooling Water Treatment Chemicals Market Revenue Billion Forecast, by Type 2020 & 2033
- Table 24: Global Cooling Water Treatment Chemicals Market Volume K Tons Forecast, by Type 2020 & 2033
- Table 25: Global Cooling Water Treatment Chemicals Market Revenue Billion Forecast, by End-user Industry 2020 & 2033
- Table 26: Global Cooling Water Treatment Chemicals Market Volume K Tons Forecast, by End-user Industry 2020 & 2033
- Table 27: Global Cooling Water Treatment Chemicals Market Revenue Billion Forecast, by Country 2020 & 2033
- Table 28: Global Cooling Water Treatment Chemicals Market Volume K Tons Forecast, by Country 2020 & 2033
- Table 29: United States Cooling Water Treatment Chemicals Market Revenue (Billion) Forecast, by Application 2020 & 2033
- Table 30: United States Cooling Water Treatment Chemicals Market Volume (K Tons) Forecast, by Application 2020 & 2033
- Table 31: Canada Cooling Water Treatment Chemicals Market Revenue (Billion) Forecast, by Application 2020 & 2033
- Table 32: Canada Cooling Water Treatment Chemicals Market Volume (K Tons) Forecast, by Application 2020 & 2033
- Table 33: Mexico Cooling Water Treatment Chemicals Market Revenue (Billion) Forecast, by Application 2020 & 2033
- Table 34: Mexico Cooling Water Treatment Chemicals Market Volume (K Tons) Forecast, by Application 2020 & 2033
- Table 35: Global Cooling Water Treatment Chemicals Market Revenue Billion Forecast, by Type 2020 & 2033
- Table 36: Global Cooling Water Treatment Chemicals Market Volume K Tons Forecast, by Type 2020 & 2033
- Table 37: Global Cooling Water Treatment Chemicals Market Revenue Billion Forecast, by End-user Industry 2020 & 2033
- Table 38: Global Cooling Water Treatment Chemicals Market Volume K Tons Forecast, by End-user Industry 2020 & 2033
- Table 39: Global Cooling Water Treatment Chemicals Market Revenue Billion Forecast, by Country 2020 & 2033
- Table 40: Global Cooling Water Treatment Chemicals Market Volume K Tons Forecast, by Country 2020 & 2033
- Table 41: Germany Cooling Water Treatment Chemicals Market Revenue (Billion) Forecast, by Application 2020 & 2033
- Table 42: Germany Cooling Water Treatment Chemicals Market Volume (K Tons) Forecast, by Application 2020 & 2033
- Table 43: United Kingdom Cooling Water Treatment Chemicals Market Revenue (Billion) Forecast, by Application 2020 & 2033
- Table 44: United Kingdom Cooling Water Treatment Chemicals Market Volume (K Tons) Forecast, by Application 2020 & 2033
- Table 45: France Cooling Water Treatment Chemicals Market Revenue (Billion) Forecast, by Application 2020 & 2033
- Table 46: France Cooling Water Treatment Chemicals Market Volume (K Tons) Forecast, by Application 2020 & 2033
- Table 47: Italy Cooling Water Treatment Chemicals Market Revenue (Billion) Forecast, by Application 2020 & 2033
- Table 48: Italy Cooling Water Treatment Chemicals Market Volume (K Tons) Forecast, by Application 2020 & 2033
- Table 49: Rest of Europe Cooling Water Treatment Chemicals Market Revenue (Billion) Forecast, by Application 2020 & 2033
- Table 50: Rest of Europe Cooling Water Treatment Chemicals Market Volume (K Tons) Forecast, by Application 2020 & 2033
- Table 51: Global Cooling Water Treatment Chemicals Market Revenue Billion Forecast, by Type 2020 & 2033
- Table 52: Global Cooling Water Treatment Chemicals Market Volume K Tons Forecast, by Type 2020 & 2033
- Table 53: Global Cooling Water Treatment Chemicals Market Revenue Billion Forecast, by End-user Industry 2020 & 2033
- Table 54: Global Cooling Water Treatment Chemicals Market Volume K Tons Forecast, by End-user Industry 2020 & 2033
- Table 55: Global Cooling Water Treatment Chemicals Market Revenue Billion Forecast, by Country 2020 & 2033
- Table 56: Global Cooling Water Treatment Chemicals Market Volume K Tons Forecast, by Country 2020 & 2033
- Table 57: Brazil Cooling Water Treatment Chemicals Market Revenue (Billion) Forecast, by Application 2020 & 2033
- Table 58: Brazil Cooling Water Treatment Chemicals Market Volume (K Tons) Forecast, by Application 2020 & 2033
- Table 59: Argentina Cooling Water Treatment Chemicals Market Revenue (Billion) Forecast, by Application 2020 & 2033
- Table 60: Argentina Cooling Water Treatment Chemicals Market Volume (K Tons) Forecast, by Application 2020 & 2033
- Table 61: Rest of South America Cooling Water Treatment Chemicals Market Revenue (Billion) Forecast, by Application 2020 & 2033
- Table 62: Rest of South America Cooling Water Treatment Chemicals Market Volume (K Tons) Forecast, by Application 2020 & 2033
- Table 63: Global Cooling Water Treatment Chemicals Market Revenue Billion Forecast, by Type 2020 & 2033
- Table 64: Global Cooling Water Treatment Chemicals Market Volume K Tons Forecast, by Type 2020 & 2033
- Table 65: Global Cooling Water Treatment Chemicals Market Revenue Billion Forecast, by End-user Industry 2020 & 2033
- Table 66: Global Cooling Water Treatment Chemicals Market Volume K Tons Forecast, by End-user Industry 2020 & 2033
- Table 67: Global Cooling Water Treatment Chemicals Market Revenue Billion Forecast, by Country 2020 & 2033
- Table 68: Global Cooling Water Treatment Chemicals Market Volume K Tons Forecast, by Country 2020 & 2033
- Table 69: Global Cooling Water Treatment Chemicals Market Revenue Billion Forecast, by Type 2020 & 2033
- Table 70: Global Cooling Water Treatment Chemicals Market Volume K Tons Forecast, by Type 2020 & 2033
- Table 71: Global Cooling Water Treatment Chemicals Market Revenue Billion Forecast, by End-user Industry 2020 & 2033
- Table 72: Global Cooling Water Treatment Chemicals Market Volume K Tons Forecast, by End-user Industry 2020 & 2033
- Table 73: Global Cooling Water Treatment Chemicals Market Revenue Billion Forecast, by Country 2020 & 2033
- Table 74: Global Cooling Water Treatment Chemicals Market Volume K Tons Forecast, by Country 2020 & 2033
- Table 75: South Africa Cooling Water Treatment Chemicals Market Revenue (Billion) Forecast, by Application 2020 & 2033
- Table 76: South Africa Cooling Water Treatment Chemicals Market Volume (K Tons) Forecast, by Application 2020 & 2033
- Table 77: Rest of Middle East Cooling Water Treatment Chemicals Market Revenue (Billion) Forecast, by Application 2020 & 2033
- Table 78: Rest of Middle East Cooling Water Treatment Chemicals Market Volume (K Tons) Forecast, by Application 2020 & 2033
Frequently Asked Questions
1. What is the projected Compound Annual Growth Rate (CAGR) of the Cooling Water Treatment Chemicals Market?
The projected CAGR is approximately 5.8%.
2. Which companies are prominent players in the Cooling Water Treatment Chemicals Market?
Key companies in the market include Ecolab, Chemtex Speciality Limited, Thermax Limited, Nouryon, Chemtrade Logistics, Buckman, Kemira, DuPont, Solenis, Italmatch Chemicals, Suez, Veolia, Albemarle Corporation, DuBois Chemicals.
3. What are the main segments of the Cooling Water Treatment Chemicals Market?
The market segments include Type, End-user Industry.
4. Can you provide details about the market size?
The market size is estimated to be USD 11.8 Billion as of 2022.
5. What are some drivers contributing to market growth?
Accelerating Growth of the Power Industry; Growing Popularity of Zero-liquid Blowdown.
6. What are the notable trends driving market growth?
Power Industry to Dominate the Market.
7. Are there any restraints impacting market growth?
Lack of Awareness about Cooling Water Treatment; Increasing Popularity of Chlorine Alternatives.
8. Can you provide examples of recent developments in the market?
October 2022: Italmatch Chemicals company introduced a new Smart-Tagged Polymers brand line specialized for Industrial Water Treatment solutions. It is a cutting-edge smart solution for Cooling Tower applications and a significant step forward in digitalizing chemical treatment performance control.
9. What pricing options are available for accessing the report?
Pricing options include single-user, multi-user, and enterprise licenses priced at USD 3,950, USD 4,950, and USD 6,950 respectively.
10. Is the market size provided in terms of value or volume?
The market size is provided in terms of value, measured in Billion and volume, measured in K Tons.
11. Are there any specific market keywords associated with the report?
Yes, the market keyword associated with the report is "Cooling Water Treatment Chemicals Market," which aids in identifying and referencing the specific market segment covered.
12. How do I determine which pricing option suits my needs best?
The pricing options vary based on user requirements and access needs. Individual users may opt for single-user licenses, while businesses requiring broader access may choose multi-user or enterprise licenses for cost-effective access to the report.
13. Are there any additional resources or data provided in the Cooling Water Treatment Chemicals Market report?
While the report offers comprehensive insights, it's advisable to review the specific contents or supplementary materials provided to ascertain if additional resources or data are available.
14. How can I stay updated on further developments or reports in the Cooling Water Treatment Chemicals Market?
To stay informed about further developments, trends, and reports in the Cooling Water Treatment Chemicals Market, consider subscribing to industry newsletters, following relevant companies and organizations, or regularly checking reputable industry news sources and publications.
Methodology
Step 1 - Identification of Relevant Samples Size from Population Database


Step 2 - Approaches for Defining Global Market Size (Value, Volume* & Price*)

Note*: In applicable scenarios
Step 3 - Data Sources
Primary Research
- Web Analytics
- Survey Reports
- Research Institute
- Latest Research Reports
- Opinion Leaders
Secondary Research
- Annual Reports
- White Paper
- Latest Press Release
- Industry Association
- Paid Database
- Investor Presentations

Step 4 - Data Triangulation
Involves using different sources of information in order to increase the validity of a study
These sources are likely to be stakeholders in a program - participants, other researchers, program staff, other community members, and so on.
Then we put all data in single framework & apply various statistical tools to find out the dynamic on the market.
During the analysis stage, feedback from the stakeholder groups would be compared to determine areas of agreement as well as areas of divergence