

Key Insights
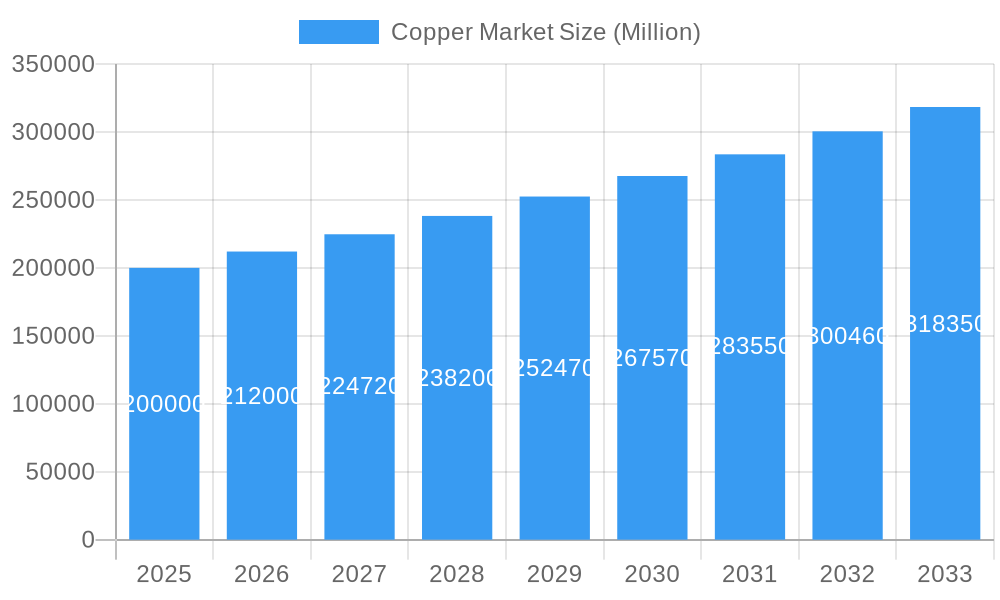
The global copper market is experiencing robust growth, driven by the increasing demand from key end-user industries. The market size, estimated at $XX million in 2025, is projected to exhibit a Compound Annual Growth Rate (CAGR) exceeding 6% from 2025 to 2033. This expansion is fueled primarily by the burgeoning automotive and heavy equipment sectors, which rely heavily on copper for electrical wiring, motors, and other components. The construction industry, another significant consumer, contributes substantially to copper demand due to its use in building infrastructure and electrical systems. Furthermore, the expanding electrical and electronics industries, particularly in renewable energy and advanced technologies, further stimulate copper consumption. While factors like fluctuating copper prices and supply chain disruptions can act as restraints, the overall growth trajectory remains positive, driven by long-term infrastructural development globally and the increasing adoption of copper-intensive technologies.
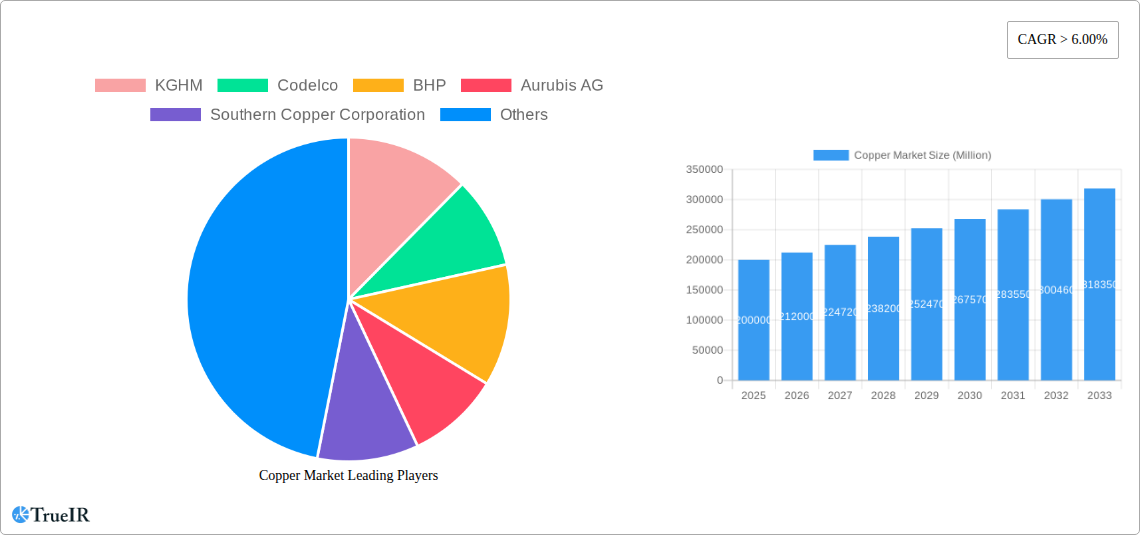
Copper Market Market Size (In Billion)
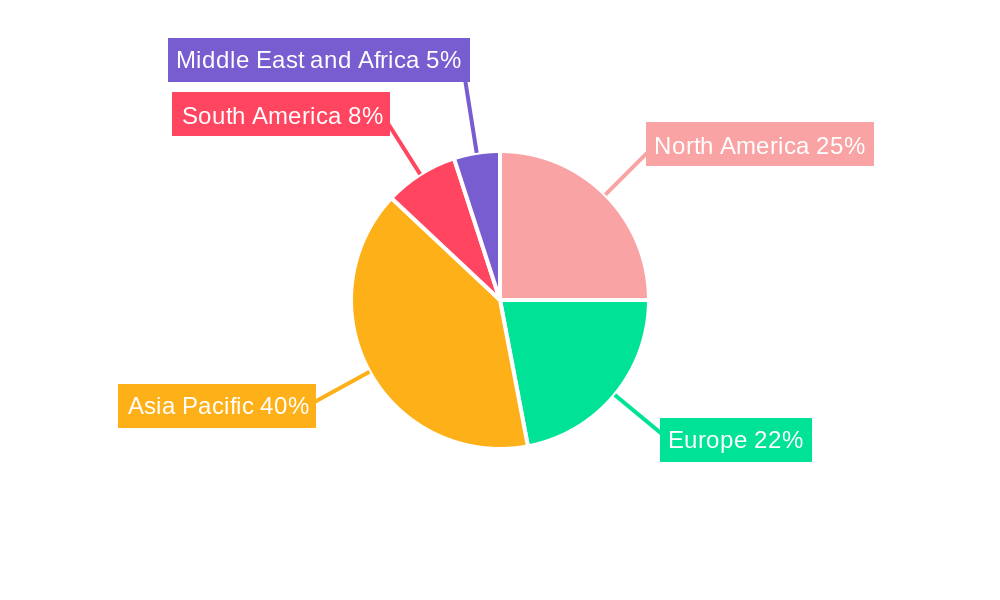
Growth within specific segments showcases varying dynamics. The automotive and heavy equipment segment demonstrates consistent high growth due to the increasing electrification of vehicles and the expansion of the global automotive industry. The construction sector’s growth is largely tied to economic expansion and infrastructure investments in developing nations. Electrical and electronics consistently exhibit strong growth due to technological advancements and rising consumer electronics demand. Regional variations in market share are anticipated, with Asia Pacific, particularly China and India, demonstrating significant growth due to rapid industrialization and urbanization. North America and Europe maintain substantial market shares, while South America and the Middle East and Africa are expected to experience moderate growth driven by specific infrastructural projects and economic development within those regions. Major players like KGHM, Codelco, BHP, and Aurubis AG are expected to continue shaping market dynamics through their production capabilities and market strategies.
Copper Market Company Market Share
Copper Market Report: 2019-2033 Forecast
This comprehensive report provides an in-depth analysis of the global copper market, offering invaluable insights for investors, industry professionals, and strategic decision-makers. With a detailed study period spanning 2019-2033, including a base year of 2025 and a forecast period of 2025-2033, this report leverages extensive data analysis and expert insights to paint a clear picture of market dynamics and future trends. The report analyzes a total market size of xx Million during the base year and projects a significant growth to reach xx Million by 2033. The Compound Annual Growth Rate (CAGR) is estimated at xx% during the forecast period.
Copper Market Market Structure & Competitive Landscape
The global copper market exhibits a moderately concentrated structure, with a few major players controlling a significant portion of the production and supply. The Herfindahl-Hirschman Index (HHI) for the market is estimated at xx, indicating a moderately concentrated market. Key innovation drivers include advancements in mining techniques, recycling technologies, and the development of high-performance copper alloys. Regulatory impacts, such as environmental regulations and trade policies, significantly influence production costs and market access. Aluminum and other alternative materials pose a competitive threat as substitutes.
The market is segmented by end-user industries, including: Automotive and Heavy Equipment, Construction, Electrical and Electronics, Industrial, and Other End-user Industries (Consumer Products, Medical Devices, etc.). Mergers and acquisitions (M&A) activity has been significant in recent years, with a total M&A volume of approximately xx Million in the past five years, driving consolidation and reshaping the competitive landscape. The largest deals included [Insert examples of significant M&A activity with approximate values if available, otherwise state "Data unavailable"].
Copper Market Market Trends & Opportunities
The copper market is experiencing robust growth driven by increasing demand from key sectors. The global market size is projected to witness substantial expansion, driven primarily by the growth in the construction, electrical & electronics, and automotive industries. Technological advancements in areas such as renewable energy (solar, wind), electric vehicles, and smart grids are significantly boosting the demand for high-purity copper. This is further enhanced by evolving consumer preferences for sustainable and efficient technologies. Increased infrastructure investments worldwide, particularly in developing economies, are another major factor fueling the demand for copper. The market penetration rate for copper in various applications is expected to increase steadily, with notable growth in the electric vehicle and renewable energy sectors. Competitive dynamics are characterized by price fluctuations, technological innovations, and strategic partnerships among key players. The market is witnessing a shift towards sustainable sourcing practices, driving the growth of recycled copper.
Dominant Markets & Segments in Copper Market
The Asia-Pacific region remains the dominant market for copper, driven by rapid economic growth and massive infrastructure development initiatives in countries like China and India.
- Key Growth Drivers in Asia-Pacific:
- Extensive infrastructure projects (roads, buildings, power grids)
- Booming automotive and electronics manufacturing sectors
- Rising urbanization and industrialization
- Favorable government policies and investments in renewable energy
Other significant markets include North America, Europe, and South America, each showing varied growth patterns based on economic conditions, industrial activity, and government policies. Within the end-user segments, the Electrical and Electronics industry consistently demonstrates the highest growth, followed by the Construction and Automotive & Heavy Equipment sectors. This is largely due to the increasing adoption of advanced technologies, higher energy consumption and demand for infrastructure development.
Copper Market Product Analysis
The copper market encompasses various product forms, including refined copper, copper alloys, and copper-based compounds. Recent innovations focus on developing high-strength, lightweight copper alloys for applications in aerospace and automotive industries. Advances in copper recycling technologies enhance the sustainability and cost-effectiveness of copper production, thus fostering an improved market fit and reduced environmental impact. The competitive advantage lies in efficient production processes, cost-optimization, and the development of specialized alloys catering to niche market demands.
Key Drivers, Barriers & Challenges in Copper Market
Key Drivers:
- Growing demand from the renewable energy sector (solar, wind).
- Expanding infrastructure projects globally.
- Increasing adoption of electric vehicles and related technologies.
Challenges & Restraints:
- Fluctuations in copper prices due to supply-demand dynamics.
- Volatility in raw material costs.
- Stringent environmental regulations that increase production costs.
- Potential supply chain disruptions due to geopolitical factors. A xx% disruption in supply could result in a xx Million loss in revenue, impacting overall market growth.
Growth Drivers in the Copper Market Market
Growth is primarily propelled by the increasing demand for copper in the construction, electrical and electronics, and automotive industries. Technological advancements in sectors like renewable energy, electric vehicles, and smart grids are major drivers. Favorable government policies promoting sustainable infrastructure development and investments in green technologies further boost market expansion.
Challenges Impacting Copper Market Growth
Challenges include price volatility, supply chain disruptions, and environmental regulations. Geopolitical factors, resource scarcity, and the potential for alternative materials to replace copper in certain applications pose significant risks. These factors can cause delays in project completion, impacting overall market growth.
Key Players Shaping the Copper Market Market
- KGHM
- Codelco
- BHP
- Aurubis AG
- Southern Copper Corporation
- Group Mexico
- Xstrata Plc
- Glencore
- Chinalco Shanghai Copper
- Freeport-McMoRan Copper & Gold
Significant Copper Market Industry Milestones
- May 2021: Glencore announced plans to restart operations at the Mutanda copper and cobalt mine in 2022, potentially easing market shortages.
- November 2021: Aurubis AG launched a new multi-metal recycling plant in Georgia, USA, with an annual capacity of 35,000 tons of blister copper. This development significantly contributes to sustainable copper production and addresses environmental concerns.
Future Outlook for Copper Market Market
The copper market is poised for continued growth, driven by long-term trends such as urbanization, industrialization, and the global shift towards renewable energy. Strategic investments in mining operations, technological advancements in recycling, and the development of innovative copper alloys will shape the future of the market. The focus on sustainable practices and the integration of circular economy principles will further drive market expansion and contribute to a more environmentally responsible copper industry.
Copper Market Segmentation
-
1. End-user Industry
- 1.1. Automotive and Heavy Equipment
- 1.2. Construction
- 1.3. Electrical and Electronics
- 1.4. Industrial
- 1.5. Other End-user Industry
Copper Market Segmentation By Geography
-
1. Asia Pacific
- 1.1. China
- 1.2. India
- 1.3. Japan
- 1.4. South Korea
- 1.5. Rest of Asia Pacific
-
2. North America
- 2.1. United States
- 2.2. Canada
- 2.3. Mexico
-
3. Europe
- 3.1. Germany
- 3.2. United Kingdom
- 3.3. France
- 3.4. Italy
- 3.5. Rest of Europe
-
4. South America
- 4.1. Brazil
- 4.2. Argentina
- 4.3. Rest of South America
-
5. Middle East and Africa
- 5.1. South Africa
- 5.2. UAE
- 5.3. Saudi Arabia
- 5.4. Rest of Middle East and Africa
Copper Market Regional Market Share
Geographic Coverage of Copper Market
Copper Market REPORT HIGHLIGHTS
| Aspects | Details |
|---|---|
| Study Period | 2020-2034 |
| Base Year | 2025 |
| Estimated Year | 2026 |
| Forecast Period | 2026-2034 |
| Historical Period | 2020-2025 |
| Growth Rate | CAGR of > 6.00% from 2020-2034 |
| Segmentation |
|
Table of Contents
- 1. Introduction
- 1.1. Research Scope
- 1.2. Market Segmentation
- 1.3. Research Objective
- 1.4. Definitions and Assumptions
- 2. Executive Summary
- 2.1. Market Snapshot
- 3. Market Dynamics
- 3.1. Market Drivers
- 3.2. Market Restrains
- 3.3. Market Trends
- 3.4. Market Opportunities
- 4. Market Factor Analysis
- 4.1. Porters Five Forces
- 4.1.1. Bargaining Power of Suppliers
- 4.1.2. Bargaining Power of Buyers
- 4.1.3. Threat of New Entrants
- 4.1.4. Threat of Substitutes
- 4.1.5. Competitive Rivalry
- 4.2. PESTEL analysis
- 4.3. BCG Analysis
- 4.3.1. Stars (High Growth, High Market Share)
- 4.3.2. Cash Cows (Low Growth, High Market Share)
- 4.3.3. Question Mark (High Growth, Low Market Share)
- 4.3.4. Dogs (Low Growth, Low Market Share)
- 4.4. Ansoff Matrix Analysis
- 4.5. Supply Chain Analysis
- 4.6. Regulatory Landscape
- 4.7. Current Market Potential and Opportunity Assessment (TAM–SAM–SOM Framework)
- 4.8. TIR Analyst Note
- 4.1. Porters Five Forces
- 5. Market Analysis, Insights and Forecast 2021-2033
- 5.1. Market Analysis, Insights and Forecast - by End-user Industry
- 5.1.1. Automotive and Heavy Equipment
- 5.1.2. Construction
- 5.1.3. Electrical and Electronics
- 5.1.4. Industrial
- 5.1.5. Other End-user Industry
- 5.2. Market Analysis, Insights and Forecast - by Region
- 5.2.1. Asia Pacific
- 5.2.2. North America
- 5.2.3. Europe
- 5.2.4. South America
- 5.2.5. Middle East and Africa
- 5.1. Market Analysis, Insights and Forecast - by End-user Industry
- 6. Global Copper Market Analysis, Insights and Forecast, 2021-2033
- 6.1. Market Analysis, Insights and Forecast - by End-user Industry
- 6.1.1. Automotive and Heavy Equipment
- 6.1.2. Construction
- 6.1.3. Electrical and Electronics
- 6.1.4. Industrial
- 6.1.5. Other End-user Industry
- 6.1. Market Analysis, Insights and Forecast - by End-user Industry
- 7. Asia Pacific Copper Market Analysis, Insights and Forecast, 2020-2032
- 7.1. Market Analysis, Insights and Forecast - by End-user Industry
- 7.1.1. Automotive and Heavy Equipment
- 7.1.2. Construction
- 7.1.3. Electrical and Electronics
- 7.1.4. Industrial
- 7.1.5. Other End-user Industry
- 7.1. Market Analysis, Insights and Forecast - by End-user Industry
- 8. North America Copper Market Analysis, Insights and Forecast, 2020-2032
- 8.1. Market Analysis, Insights and Forecast - by End-user Industry
- 8.1.1. Automotive and Heavy Equipment
- 8.1.2. Construction
- 8.1.3. Electrical and Electronics
- 8.1.4. Industrial
- 8.1.5. Other End-user Industry
- 8.1. Market Analysis, Insights and Forecast - by End-user Industry
- 9. Europe Copper Market Analysis, Insights and Forecast, 2020-2032
- 9.1. Market Analysis, Insights and Forecast - by End-user Industry
- 9.1.1. Automotive and Heavy Equipment
- 9.1.2. Construction
- 9.1.3. Electrical and Electronics
- 9.1.4. Industrial
- 9.1.5. Other End-user Industry
- 9.1. Market Analysis, Insights and Forecast - by End-user Industry
- 10. South America Copper Market Analysis, Insights and Forecast, 2020-2032
- 10.1. Market Analysis, Insights and Forecast - by End-user Industry
- 10.1.1. Automotive and Heavy Equipment
- 10.1.2. Construction
- 10.1.3. Electrical and Electronics
- 10.1.4. Industrial
- 10.1.5. Other End-user Industry
- 10.1. Market Analysis, Insights and Forecast - by End-user Industry
- 11. Middle East and Africa Copper Market Analysis, Insights and Forecast, 2020-2032
- 11.1. Market Analysis, Insights and Forecast - by End-user Industry
- 11.1.1. Automotive and Heavy Equipment
- 11.1.2. Construction
- 11.1.3. Electrical and Electronics
- 11.1.4. Industrial
- 11.1.5. Other End-user Industry
- 11.1. Market Analysis, Insights and Forecast - by End-user Industry
- 12. Competitive Analysis
- 12.1. Company Profiles
- 12.1.1 KGHM
- 12.1.1.1. Company Overview
- 12.1.1.2. Products
- 12.1.1.3. Company Financials
- 12.1.1.4. SWOT Analysis
- 12.1.2 Codelco
- 12.1.2.1. Company Overview
- 12.1.2.2. Products
- 12.1.2.3. Company Financials
- 12.1.2.4. SWOT Analysis
- 12.1.3 BHP
- 12.1.3.1. Company Overview
- 12.1.3.2. Products
- 12.1.3.3. Company Financials
- 12.1.3.4. SWOT Analysis
- 12.1.4 Aurubis AG
- 12.1.4.1. Company Overview
- 12.1.4.2. Products
- 12.1.4.3. Company Financials
- 12.1.4.4. SWOT Analysis
- 12.1.5 Southern Copper Corporation
- 12.1.5.1. Company Overview
- 12.1.5.2. Products
- 12.1.5.3. Company Financials
- 12.1.5.4. SWOT Analysis
- 12.1.6 Group Mexico
- 12.1.6.1. Company Overview
- 12.1.6.2. Products
- 12.1.6.3. Company Financials
- 12.1.6.4. SWOT Analysis
- 12.1.7 Xstrata Plc
- 12.1.7.1. Company Overview
- 12.1.7.2. Products
- 12.1.7.3. Company Financials
- 12.1.7.4. SWOT Analysis
- 12.1.8 Glencore
- 12.1.8.1. Company Overview
- 12.1.8.2. Products
- 12.1.8.3. Company Financials
- 12.1.8.4. SWOT Analysis
- 12.1.9 Chinalco Shanghai Copper
- 12.1.9.1. Company Overview
- 12.1.9.2. Products
- 12.1.9.3. Company Financials
- 12.1.9.4. SWOT Analysis
- 12.1.10 Freeport-McMoRan Copper & Gold
- 12.1.10.1. Company Overview
- 12.1.10.2. Products
- 12.1.10.3. Company Financials
- 12.1.10.4. SWOT Analysis
- 12.1.1 KGHM
- 12.2. Market Entropy
- 12.2.1 Company's Key Areas Served
- 12.2.2 Recent Developments
- 12.3. Company Market Share Analysis 2025
- 12.3.1 Top 5 Companies Market Share Analysis
- 12.3.2 Top 3 Companies Market Share Analysis
- 12.4. List of Potential Customers
- 13. Research Methodology
List of Figures
- Figure 1: Global Copper Market Revenue Breakdown (Million, %) by Region 2025 & 2033
- Figure 2: Global Copper Market Volume Breakdown (K Tons, %) by Region 2025 & 2033
- Figure 3: Asia Pacific Copper Market Revenue (Million), by End-user Industry 2025 & 2033
- Figure 4: Asia Pacific Copper Market Volume (K Tons), by End-user Industry 2025 & 2033
- Figure 5: Asia Pacific Copper Market Revenue Share (%), by End-user Industry 2025 & 2033
- Figure 6: Asia Pacific Copper Market Volume Share (%), by End-user Industry 2025 & 2033
- Figure 7: Asia Pacific Copper Market Revenue (Million), by Country 2025 & 2033
- Figure 8: Asia Pacific Copper Market Volume (K Tons), by Country 2025 & 2033
- Figure 9: Asia Pacific Copper Market Revenue Share (%), by Country 2025 & 2033
- Figure 10: Asia Pacific Copper Market Volume Share (%), by Country 2025 & 2033
- Figure 11: North America Copper Market Revenue (Million), by End-user Industry 2025 & 2033
- Figure 12: North America Copper Market Volume (K Tons), by End-user Industry 2025 & 2033
- Figure 13: North America Copper Market Revenue Share (%), by End-user Industry 2025 & 2033
- Figure 14: North America Copper Market Volume Share (%), by End-user Industry 2025 & 2033
- Figure 15: North America Copper Market Revenue (Million), by Country 2025 & 2033
- Figure 16: North America Copper Market Volume (K Tons), by Country 2025 & 2033
- Figure 17: North America Copper Market Revenue Share (%), by Country 2025 & 2033
- Figure 18: North America Copper Market Volume Share (%), by Country 2025 & 2033
- Figure 19: Europe Copper Market Revenue (Million), by End-user Industry 2025 & 2033
- Figure 20: Europe Copper Market Volume (K Tons), by End-user Industry 2025 & 2033
- Figure 21: Europe Copper Market Revenue Share (%), by End-user Industry 2025 & 2033
- Figure 22: Europe Copper Market Volume Share (%), by End-user Industry 2025 & 2033
- Figure 23: Europe Copper Market Revenue (Million), by Country 2025 & 2033
- Figure 24: Europe Copper Market Volume (K Tons), by Country 2025 & 2033
- Figure 25: Europe Copper Market Revenue Share (%), by Country 2025 & 2033
- Figure 26: Europe Copper Market Volume Share (%), by Country 2025 & 2033
- Figure 27: South America Copper Market Revenue (Million), by End-user Industry 2025 & 2033
- Figure 28: South America Copper Market Volume (K Tons), by End-user Industry 2025 & 2033
- Figure 29: South America Copper Market Revenue Share (%), by End-user Industry 2025 & 2033
- Figure 30: South America Copper Market Volume Share (%), by End-user Industry 2025 & 2033
- Figure 31: South America Copper Market Revenue (Million), by Country 2025 & 2033
- Figure 32: South America Copper Market Volume (K Tons), by Country 2025 & 2033
- Figure 33: South America Copper Market Revenue Share (%), by Country 2025 & 2033
- Figure 34: South America Copper Market Volume Share (%), by Country 2025 & 2033
- Figure 35: Middle East and Africa Copper Market Revenue (Million), by End-user Industry 2025 & 2033
- Figure 36: Middle East and Africa Copper Market Volume (K Tons), by End-user Industry 2025 & 2033
- Figure 37: Middle East and Africa Copper Market Revenue Share (%), by End-user Industry 2025 & 2033
- Figure 38: Middle East and Africa Copper Market Volume Share (%), by End-user Industry 2025 & 2033
- Figure 39: Middle East and Africa Copper Market Revenue (Million), by Country 2025 & 2033
- Figure 40: Middle East and Africa Copper Market Volume (K Tons), by Country 2025 & 2033
- Figure 41: Middle East and Africa Copper Market Revenue Share (%), by Country 2025 & 2033
- Figure 42: Middle East and Africa Copper Market Volume Share (%), by Country 2025 & 2033
List of Tables
- Table 1: Global Copper Market Revenue Million Forecast, by End-user Industry 2020 & 2033
- Table 2: Global Copper Market Volume K Tons Forecast, by End-user Industry 2020 & 2033
- Table 3: Global Copper Market Revenue Million Forecast, by Region 2020 & 2033
- Table 4: Global Copper Market Volume K Tons Forecast, by Region 2020 & 2033
- Table 5: Global Copper Market Revenue Million Forecast, by End-user Industry 2020 & 2033
- Table 6: Global Copper Market Volume K Tons Forecast, by End-user Industry 2020 & 2033
- Table 7: Global Copper Market Revenue Million Forecast, by Country 2020 & 2033
- Table 8: Global Copper Market Volume K Tons Forecast, by Country 2020 & 2033
- Table 9: China Copper Market Revenue (Million) Forecast, by Application 2020 & 2033
- Table 10: China Copper Market Volume (K Tons) Forecast, by Application 2020 & 2033
- Table 11: India Copper Market Revenue (Million) Forecast, by Application 2020 & 2033
- Table 12: India Copper Market Volume (K Tons) Forecast, by Application 2020 & 2033
- Table 13: Japan Copper Market Revenue (Million) Forecast, by Application 2020 & 2033
- Table 14: Japan Copper Market Volume (K Tons) Forecast, by Application 2020 & 2033
- Table 15: South Korea Copper Market Revenue (Million) Forecast, by Application 2020 & 2033
- Table 16: South Korea Copper Market Volume (K Tons) Forecast, by Application 2020 & 2033
- Table 17: Rest of Asia Pacific Copper Market Revenue (Million) Forecast, by Application 2020 & 2033
- Table 18: Rest of Asia Pacific Copper Market Volume (K Tons) Forecast, by Application 2020 & 2033
- Table 19: Global Copper Market Revenue Million Forecast, by End-user Industry 2020 & 2033
- Table 20: Global Copper Market Volume K Tons Forecast, by End-user Industry 2020 & 2033
- Table 21: Global Copper Market Revenue Million Forecast, by Country 2020 & 2033
- Table 22: Global Copper Market Volume K Tons Forecast, by Country 2020 & 2033
- Table 23: United States Copper Market Revenue (Million) Forecast, by Application 2020 & 2033
- Table 24: United States Copper Market Volume (K Tons) Forecast, by Application 2020 & 2033
- Table 25: Canada Copper Market Revenue (Million) Forecast, by Application 2020 & 2033
- Table 26: Canada Copper Market Volume (K Tons) Forecast, by Application 2020 & 2033
- Table 27: Mexico Copper Market Revenue (Million) Forecast, by Application 2020 & 2033
- Table 28: Mexico Copper Market Volume (K Tons) Forecast, by Application 2020 & 2033
- Table 29: Global Copper Market Revenue Million Forecast, by End-user Industry 2020 & 2033
- Table 30: Global Copper Market Volume K Tons Forecast, by End-user Industry 2020 & 2033
- Table 31: Global Copper Market Revenue Million Forecast, by Country 2020 & 2033
- Table 32: Global Copper Market Volume K Tons Forecast, by Country 2020 & 2033
- Table 33: Germany Copper Market Revenue (Million) Forecast, by Application 2020 & 2033
- Table 34: Germany Copper Market Volume (K Tons) Forecast, by Application 2020 & 2033
- Table 35: United Kingdom Copper Market Revenue (Million) Forecast, by Application 2020 & 2033
- Table 36: United Kingdom Copper Market Volume (K Tons) Forecast, by Application 2020 & 2033
- Table 37: France Copper Market Revenue (Million) Forecast, by Application 2020 & 2033
- Table 38: France Copper Market Volume (K Tons) Forecast, by Application 2020 & 2033
- Table 39: Italy Copper Market Revenue (Million) Forecast, by Application 2020 & 2033
- Table 40: Italy Copper Market Volume (K Tons) Forecast, by Application 2020 & 2033
- Table 41: Rest of Europe Copper Market Revenue (Million) Forecast, by Application 2020 & 2033
- Table 42: Rest of Europe Copper Market Volume (K Tons) Forecast, by Application 2020 & 2033
- Table 43: Global Copper Market Revenue Million Forecast, by End-user Industry 2020 & 2033
- Table 44: Global Copper Market Volume K Tons Forecast, by End-user Industry 2020 & 2033
- Table 45: Global Copper Market Revenue Million Forecast, by Country 2020 & 2033
- Table 46: Global Copper Market Volume K Tons Forecast, by Country 2020 & 2033
- Table 47: Brazil Copper Market Revenue (Million) Forecast, by Application 2020 & 2033
- Table 48: Brazil Copper Market Volume (K Tons) Forecast, by Application 2020 & 2033
- Table 49: Argentina Copper Market Revenue (Million) Forecast, by Application 2020 & 2033
- Table 50: Argentina Copper Market Volume (K Tons) Forecast, by Application 2020 & 2033
- Table 51: Rest of South America Copper Market Revenue (Million) Forecast, by Application 2020 & 2033
- Table 52: Rest of South America Copper Market Volume (K Tons) Forecast, by Application 2020 & 2033
- Table 53: Global Copper Market Revenue Million Forecast, by End-user Industry 2020 & 2033
- Table 54: Global Copper Market Volume K Tons Forecast, by End-user Industry 2020 & 2033
- Table 55: Global Copper Market Revenue Million Forecast, by Country 2020 & 2033
- Table 56: Global Copper Market Volume K Tons Forecast, by Country 2020 & 2033
- Table 57: South Africa Copper Market Revenue (Million) Forecast, by Application 2020 & 2033
- Table 58: South Africa Copper Market Volume (K Tons) Forecast, by Application 2020 & 2033
- Table 59: UAE Copper Market Revenue (Million) Forecast, by Application 2020 & 2033
- Table 60: UAE Copper Market Volume (K Tons) Forecast, by Application 2020 & 2033
- Table 61: Saudi Arabia Copper Market Revenue (Million) Forecast, by Application 2020 & 2033
- Table 62: Saudi Arabia Copper Market Volume (K Tons) Forecast, by Application 2020 & 2033
- Table 63: Rest of Middle East and Africa Copper Market Revenue (Million) Forecast, by Application 2020 & 2033
- Table 64: Rest of Middle East and Africa Copper Market Volume (K Tons) Forecast, by Application 2020 & 2033
Frequently Asked Questions
1. What is the projected Compound Annual Growth Rate (CAGR) of the Copper Market?
The projected CAGR is approximately > 6.00%.
2. Which companies are prominent players in the Copper Market?
Key companies in the market include KGHM, Codelco, BHP, Aurubis AG, Southern Copper Corporation, Group Mexico, Xstrata Plc, Glencore, Chinalco Shanghai Copper, Freeport-McMoRan Copper & Gold.
3. What are the main segments of the Copper Market?
The market segments include End-user Industry.
4. Can you provide details about the market size?
The market size is estimated to be USD XX Million as of 2022.
5. What are some drivers contributing to market growth?
Growing Demand from Electronics and Construction Industry; Other Drivers.
6. What are the notable trends driving market growth?
Growing Demand for Electrical and Electronics Segment.
7. Are there any restraints impacting market growth?
Stringent Regulations Associated with Mining.
8. Can you provide examples of recent developments in the market?
November 2021: Aurubis AG further expanded its activities in recycling metal-bearing materials internationally. It started the construction of a multi metal recycling plant in the US state of Georgia. Circuit boards, copper cable, and other recycling materials containing metals will be processed into 35,000 tons of blister copper annually.
9. What pricing options are available for accessing the report?
Pricing options include single-user, multi-user, and enterprise licenses priced at USD 4750, USD 5250, and USD 8750 respectively.
10. Is the market size provided in terms of value or volume?
The market size is provided in terms of value, measured in Million and volume, measured in K Tons.
11. Are there any specific market keywords associated with the report?
Yes, the market keyword associated with the report is "Copper Market," which aids in identifying and referencing the specific market segment covered.
12. How do I determine which pricing option suits my needs best?
The pricing options vary based on user requirements and access needs. Individual users may opt for single-user licenses, while businesses requiring broader access may choose multi-user or enterprise licenses for cost-effective access to the report.
13. Are there any additional resources or data provided in the Copper Market report?
While the report offers comprehensive insights, it's advisable to review the specific contents or supplementary materials provided to ascertain if additional resources or data are available.
14. How can I stay updated on further developments or reports in the Copper Market?
To stay informed about further developments, trends, and reports in the Copper Market, consider subscribing to industry newsletters, following relevant companies and organizations, or regularly checking reputable industry news sources and publications.
Methodology
Step 1 - Identification of Relevant Samples Size from Population Database


Step 2 - Approaches for Defining Global Market Size (Value, Volume* & Price*)

Note*: In applicable scenarios
Step 3 - Data Sources
Primary Research
- Web Analytics
- Survey Reports
- Research Institute
- Latest Research Reports
- Opinion Leaders
Secondary Research
- Annual Reports
- White Paper
- Latest Press Release
- Industry Association
- Paid Database
- Investor Presentations

Step 4 - Data Triangulation
Involves using different sources of information in order to increase the validity of a study
These sources are likely to be stakeholders in a program - participants, other researchers, program staff, other community members, and so on.
Then we put all data in single framework & apply various statistical tools to find out the dynamic on the market.
During the analysis stage, feedback from the stakeholder groups would be compared to determine areas of agreement as well as areas of divergence