

Key Insights
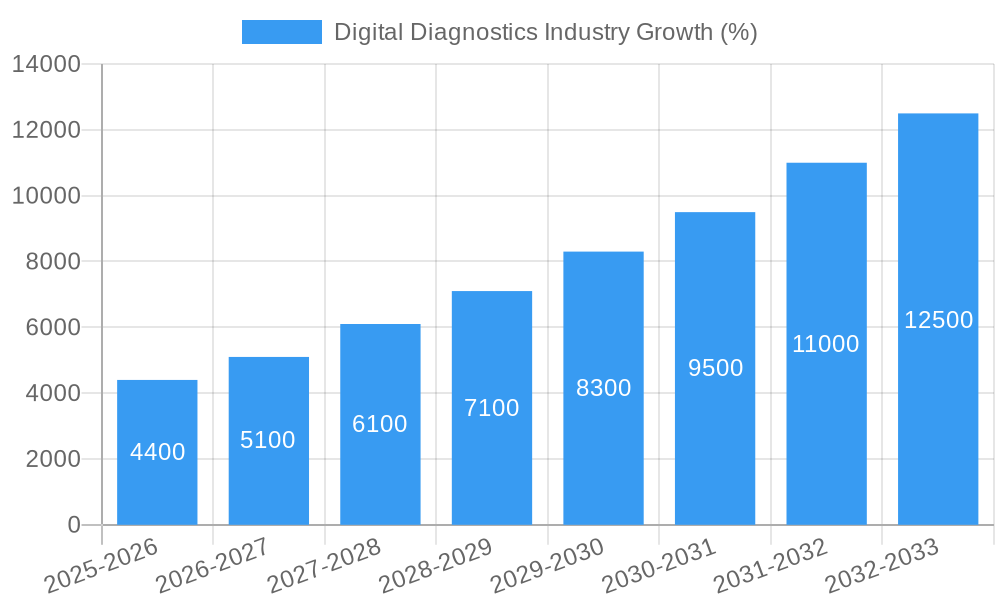
The digital diagnostics market is experiencing robust growth, projected to reach a substantial size driven by several key factors. The 17.23% CAGR from 2019-2024 indicates a rapidly expanding market, fueled by increasing adoption of AI-powered diagnostic tools, the rising prevalence of chronic diseases necessitating faster and more accurate diagnoses, and a growing demand for remote patient monitoring. Technological advancements such as improved image analysis software, miniaturization of diagnostic devices, and the integration of cloud computing and big data analytics are further accelerating market expansion. Specific segments like cardiology and oncology are exhibiting particularly strong growth due to the complexity of these diseases and the potential of digital diagnostics to improve treatment outcomes. The shift towards value-based care models incentivizes the adoption of cost-effective and efficient diagnostic solutions, further propelling market growth. Growth is also spurred by the expansion of telehealth services and the increasing accessibility of affordable diagnostic tools in emerging markets.
However, the market also faces challenges. High initial investment costs associated with the implementation of advanced digital diagnostic technologies can be a barrier for smaller clinics and laboratories, particularly in resource-constrained settings. Data security and privacy concerns surrounding the use of patient data in digital platforms necessitate robust cybersecurity measures, potentially impacting market penetration. Moreover, regulatory hurdles and reimbursement policies vary across different regions, creating complexities for market players. Despite these restraints, the long-term growth trajectory remains positive, driven by continuous innovation and the increasing recognition of the significant clinical and economic benefits offered by digital diagnostics. The market's segmentation by product (hardware, software, services), diagnosis type (cardiology, oncology, etc.), and end-user (hospitals, clinics, labs) offers diverse opportunities for growth across various niches.
Digital Diagnostics Industry Market Report: 2019-2033
This comprehensive report provides a detailed analysis of the Digital Diagnostics industry, offering invaluable insights for stakeholders seeking to understand market trends, competitive dynamics, and future growth opportunities. Covering the period from 2019 to 2033, with a focus on 2025, this report leverages extensive data analysis to present a clear and actionable view of this rapidly evolving sector. The global market is projected to reach xx Million by 2033, exhibiting a robust CAGR.
Digital Diagnostics Industry Market Structure & Competitive Landscape
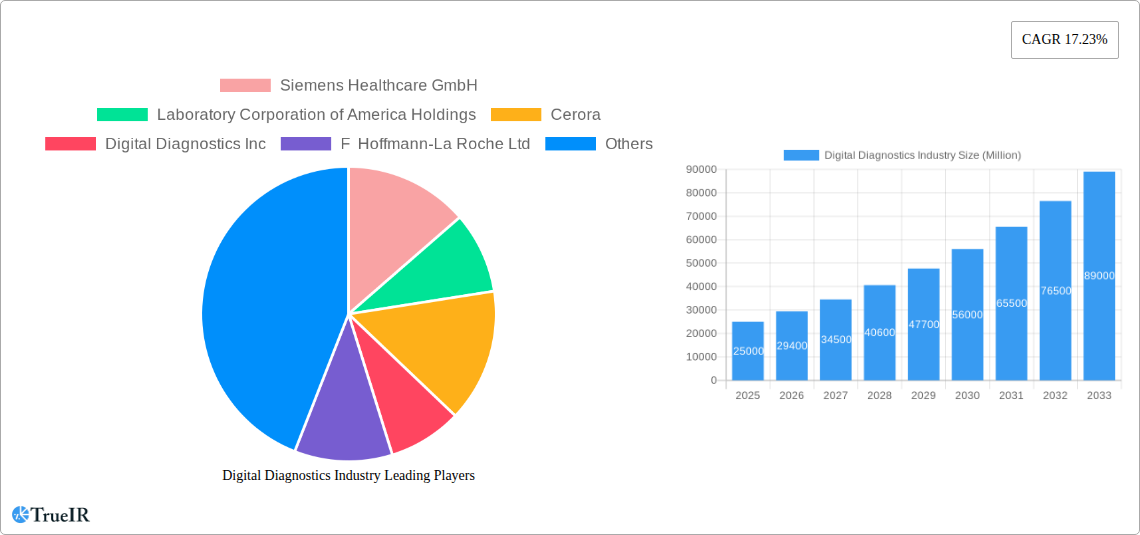
The digital diagnostics market is characterized by a blend of established giants and innovative startups, leading to a moderately concentrated landscape. While a few major players like Siemens Healthcare GmbH, GE Healthcare, and ThermoFisher Scientific Inc. hold significant market share, the emergence of smaller, agile companies like Vuno Inc. and Nanox Imaging Ltd. is driving innovation and competition. The Herfindahl-Hirschman Index (HHI) for the market in 2024 is estimated at xx, suggesting a moderately concentrated market.
- Innovation Drivers: Advancements in AI, machine learning, and big data analytics are revolutionizing diagnostic capabilities, driving demand for sophisticated software and services. Miniaturization of hardware and development of point-of-care diagnostics are also key drivers.
- Regulatory Impacts: Stringent regulatory approvals (e.g., FDA clearance in the US) and data privacy regulations (e.g., GDPR) influence product development and market entry strategies. Variations in regulatory frameworks across different geographies also impact market dynamics.
- Product Substitutes: Traditional diagnostic methods pose a competitive threat, although the superior speed, accuracy, and efficiency of digital diagnostics are gradually eroding their market share.
- End-User Segmentation: The market is segmented into hospitals and clinics, clinical laboratories, and other end-users (e.g., research institutions). Hospitals and clinics represent the largest segment, while clinical laboratories demonstrate high growth potential due to increasing outsourcing of diagnostic tests.
- M&A Trends: The industry has witnessed significant M&A activity in recent years, with larger players acquiring smaller companies to expand their product portfolios and technological capabilities. The total value of M&A deals in the past five years is estimated at xx Million.
Digital Diagnostics Industry Market Trends & Opportunities
The global digital diagnostics market is experiencing exponential growth, driven by several key factors. The market size reached xx Million in 2024 and is projected to reach xx Million by 2033, with a CAGR of xx%. This growth is fueled by rising prevalence of chronic diseases, increasing demand for faster and more accurate diagnostics, and the growing adoption of telehealth and remote patient monitoring. Technological advancements, particularly in AI and machine learning, are improving the accuracy and efficiency of diagnostic tools, leading to higher market penetration rates.
The rising adoption of digital health solutions and increasing investment in healthcare infrastructure, particularly in emerging economies, presents significant opportunities for market expansion. Consumer preferences are shifting towards convenient, accessible, and personalized diagnostic services, further driving market growth. The competitive landscape remains dynamic, with established players and innovative startups vying for market share through product development, strategic partnerships, and acquisitions. The market penetration rate for digital diagnostics in developed countries is currently estimated at xx%, while emerging markets are showing higher growth potential.
Dominant Markets & Segments in Digital Diagnostics Industry
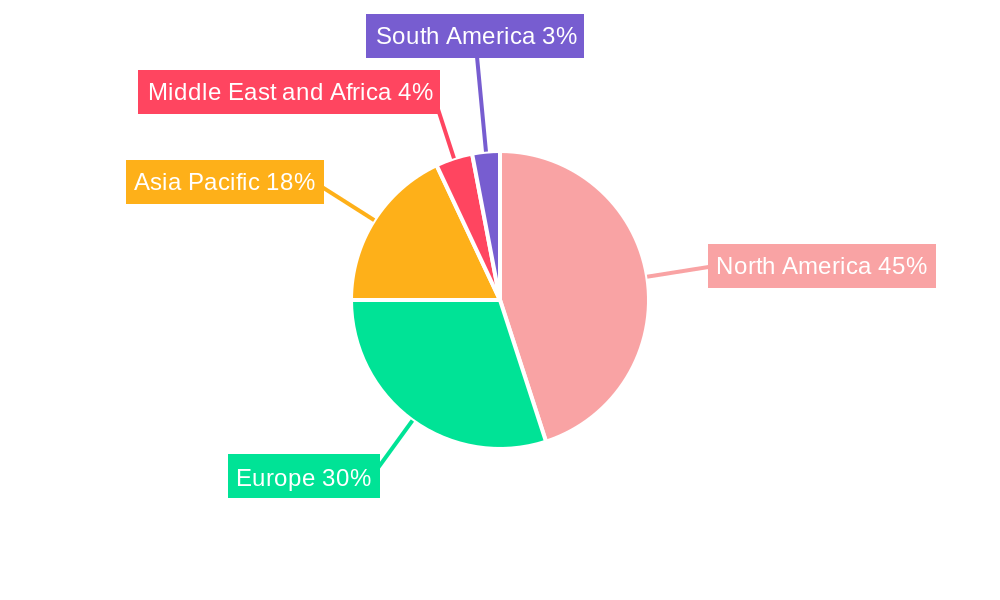
The North American market currently holds the largest share of the digital diagnostics market, driven by robust healthcare infrastructure, high technological adoption rates, and increased healthcare spending. However, the Asia-Pacific region is projected to witness the fastest growth, fueled by rising disposable incomes, increasing healthcare awareness, and government initiatives to improve healthcare access.
- By Product: The software segment is experiencing the highest growth rate, owing to advancements in AI and machine learning algorithms. Hardware remains a significant segment, particularly in advanced imaging technologies like MRI and CT scans. Services, including data analytics and remote monitoring, are also gaining traction.
- By Diagnosis Type: Cardiology and oncology are major segments, driven by the prevalence of cardiovascular diseases and cancer, respectively. Neurology and radiology are also significant segments, with growing demand for advanced imaging and diagnostic tools. Pathology is experiencing growth due to the increased use of automated and digitalized laboratory processes.
- By End User: Hospitals and clinics remain the largest segment, driven by the need for accurate and timely diagnostics. Clinical laboratories are experiencing significant growth due to the increasing outsourcing of diagnostic tests.
Key Growth Drivers:
- Advanced infrastructure, supporting digital healthcare transformation.
- Favorable government policies promoting telehealth and digital diagnostics.
- Increasing investments in research and development of innovative diagnostic technologies.
Digital Diagnostics Industry Product Analysis
The digital diagnostics industry is witnessing rapid innovation, with advancements in AI-powered image analysis, remote patient monitoring systems, and point-of-care testing devices. These innovations are enhancing diagnostic accuracy, reducing turnaround times, and improving patient outcomes. The market is witnessing a shift towards cloud-based solutions and data analytics platforms, which offer scalability, accessibility, and the potential for improved decision-making. This trend is coupled with integration capabilities, allowing for seamless data exchange between various diagnostic modalities and electronic health records (EHRs). The key competitive advantage lies in the ability to provide highly accurate, efficient, and cost-effective diagnostic solutions that meet the specific needs of various healthcare settings.
Key Drivers, Barriers & Challenges in Digital Diagnostics Industry
Key Drivers:
- Technological advancements: AI, machine learning, and big data analytics are improving diagnostic accuracy and efficiency.
- Rising prevalence of chronic diseases: This fuels demand for faster and more accurate diagnostics.
- Increasing healthcare spending and investments in healthcare infrastructure.
Challenges and Restraints:
- Regulatory hurdles and data privacy concerns: Strict regulations governing medical device approvals and data security pose challenges.
- High initial investment costs associated with implementing new technologies. A recent survey showed that 70% of smaller diagnostic clinics cited high implementation costs as a barrier to adoption.
- Supply chain disruptions impact the availability and pricing of critical components, leading to potential delays in product launches and increased costs.
Growth Drivers in the Digital Diagnostics Industry Market
The market's growth is primarily fueled by technological advancements, a growing need for improved diagnostic accuracy, and increasing healthcare spending. Government initiatives supporting the adoption of digital health solutions are also accelerating market growth. Furthermore, the increasing prevalence of chronic diseases necessitates advanced diagnostic capabilities, boosting demand for innovative digital tools.
Challenges Impacting Digital Diagnostics Industry Growth
Significant challenges include regulatory complexities, supply chain vulnerabilities, and intense competition. The stringent regulatory requirements for medical devices lead to lengthy approval processes and high development costs. Supply chain disruptions can affect the availability of essential components, leading to delays and increased costs. The competitive landscape is characterized by both established players and emerging startups, increasing pressure on pricing and innovation.
Key Players Shaping the Digital Diagnostics Industry Market
- Siemens Healthcare GmbH
- Laboratory Corporation of America Holdings
- Cerora
- Digital Diagnostics Inc
- F Hoffmann-La Roche Ltd
- GE Healthcare
- Vuno Inc
- Midmark Corporation
- Nanox Imaging Ltd
- Novasignal Corporation
- Riverain Technologies
- ThermoFisher Scientific Inc
Significant Digital Diagnostics Industry Industry Milestones
- May 2022: TestCard secured USD 10 Million in funding to commercialize its existing product suite and launch new tests (diabetes, pregnancy, CKD, flu). This signifies increasing investor confidence in the point-of-care diagnostics sector.
- February 2022: Labcorp launched Labcorp OnDemand, an online platform for ordering and home sample collection. This enhances accessibility to diagnostic testing and exemplifies the growing trend of digital health solutions.
Future Outlook for Digital Diagnostics Industry Market
The future of the digital diagnostics market is promising, with continued growth driven by technological innovation and increasing demand for efficient and accurate diagnostic tools. Strategic partnerships, mergers and acquisitions, and expansion into emerging markets will shape the competitive landscape. The focus on AI-driven diagnostics, personalized medicine, and remote patient monitoring will create significant opportunities for market expansion and innovation. The market is poised for sustained growth, driven by its ability to transform healthcare delivery and improve patient outcomes.
Digital Diagnostics Industry Segmentation
-
1. Product
- 1.1. Hardware
- 1.2. Software
- 1.3. Services
-
2. Diagnosis Type
- 2.1. Cardiology
- 2.2. Oncology
- 2.3. Neurology
- 2.4. Radiology
- 2.5. Pathology
- 2.6. Others
-
3. End User
- 3.1. Hospitals and Clinics
- 3.2. Clinical Laboratories
- 3.3. Others
Digital Diagnostics Industry Segmentation By Geography
-
1. North America
- 1.1. United States
- 1.2. Canada
- 1.3. Mexico
-
2. Europe
- 2.1. Germany
- 2.2. United Kingdom
- 2.3. France
- 2.4. Italy
- 2.5. Spain
- 2.6. Rest of Europe
-
3. Asia Pacific
- 3.1. China
- 3.2. Japan
- 3.3. India
- 3.4. Australia
- 3.5. South Korea
- 3.6. Rest of Asia Pacific
-
4. Middle East and Africa
- 4.1. GCC
- 4.2. South Africa
- 4.3. Rest of Middle East and Africa
-
5. South America
- 5.1. Brazil
- 5.2. Argentina
- 5.3. Rest of South America
Digital Diagnostics Industry REPORT HIGHLIGHTS
| Aspects | Details |
|---|---|
| Study Period | 2019-2033 |
| Base Year | 2024 |
| Estimated Year | 2025 |
| Forecast Period | 2025-2033 |
| Historical Period | 2019-2024 |
| Growth Rate | CAGR of 17.23% from 2019-2033 |
| Segmentation |
|
Table of Contents
- 1. Introduction
- 1.1. Research Scope
- 1.2. Market Segmentation
- 1.3. Research Methodology
- 1.4. Definitions and Assumptions
- 2. Executive Summary
- 2.1. Introduction
- 3. Market Dynamics
- 3.1. Introduction
- 3.2. Market Drivers
- 3.2.1. Rising Adoption of Digitalization in Chronic Disease Management; Increasing Burden of Chronic Diseases
- 3.3. Market Restrains
- 3.3.1. High Cost of Instruments
- 3.4. Market Trends
- 3.4.1. Oncology Segment is Expected to Account for the Large Market Share During the Forecast Period
- 4. Market Factor Analysis
- 4.1. Porters Five Forces
- 4.2. Supply/Value Chain
- 4.3. PESTEL analysis
- 4.4. Market Entropy
- 4.5. Patent/Trademark Analysis
- 5. Global Digital Diagnostics Industry Analysis, Insights and Forecast, 2019-2031
- 5.1. Market Analysis, Insights and Forecast - by Product
- 5.1.1. Hardware
- 5.1.2. Software
- 5.1.3. Services
- 5.2. Market Analysis, Insights and Forecast - by Diagnosis Type
- 5.2.1. Cardiology
- 5.2.2. Oncology
- 5.2.3. Neurology
- 5.2.4. Radiology
- 5.2.5. Pathology
- 5.2.6. Others
- 5.3. Market Analysis, Insights and Forecast - by End User
- 5.3.1. Hospitals and Clinics
- 5.3.2. Clinical Laboratories
- 5.3.3. Others
- 5.4. Market Analysis, Insights and Forecast - by Region
- 5.4.1. North America
- 5.4.2. Europe
- 5.4.3. Asia Pacific
- 5.4.4. Middle East and Africa
- 5.4.5. South America
- 5.1. Market Analysis, Insights and Forecast - by Product
- 6. North America Digital Diagnostics Industry Analysis, Insights and Forecast, 2019-2031
- 6.1. Market Analysis, Insights and Forecast - by Product
- 6.1.1. Hardware
- 6.1.2. Software
- 6.1.3. Services
- 6.2. Market Analysis, Insights and Forecast - by Diagnosis Type
- 6.2.1. Cardiology
- 6.2.2. Oncology
- 6.2.3. Neurology
- 6.2.4. Radiology
- 6.2.5. Pathology
- 6.2.6. Others
- 6.3. Market Analysis, Insights and Forecast - by End User
- 6.3.1. Hospitals and Clinics
- 6.3.2. Clinical Laboratories
- 6.3.3. Others
- 6.1. Market Analysis, Insights and Forecast - by Product
- 7. Europe Digital Diagnostics Industry Analysis, Insights and Forecast, 2019-2031
- 7.1. Market Analysis, Insights and Forecast - by Product
- 7.1.1. Hardware
- 7.1.2. Software
- 7.1.3. Services
- 7.2. Market Analysis, Insights and Forecast - by Diagnosis Type
- 7.2.1. Cardiology
- 7.2.2. Oncology
- 7.2.3. Neurology
- 7.2.4. Radiology
- 7.2.5. Pathology
- 7.2.6. Others
- 7.3. Market Analysis, Insights and Forecast - by End User
- 7.3.1. Hospitals and Clinics
- 7.3.2. Clinical Laboratories
- 7.3.3. Others
- 7.1. Market Analysis, Insights and Forecast - by Product
- 8. Asia Pacific Digital Diagnostics Industry Analysis, Insights and Forecast, 2019-2031
- 8.1. Market Analysis, Insights and Forecast - by Product
- 8.1.1. Hardware
- 8.1.2. Software
- 8.1.3. Services
- 8.2. Market Analysis, Insights and Forecast - by Diagnosis Type
- 8.2.1. Cardiology
- 8.2.2. Oncology
- 8.2.3. Neurology
- 8.2.4. Radiology
- 8.2.5. Pathology
- 8.2.6. Others
- 8.3. Market Analysis, Insights and Forecast - by End User
- 8.3.1. Hospitals and Clinics
- 8.3.2. Clinical Laboratories
- 8.3.3. Others
- 8.1. Market Analysis, Insights and Forecast - by Product
- 9. Middle East and Africa Digital Diagnostics Industry Analysis, Insights and Forecast, 2019-2031
- 9.1. Market Analysis, Insights and Forecast - by Product
- 9.1.1. Hardware
- 9.1.2. Software
- 9.1.3. Services
- 9.2. Market Analysis, Insights and Forecast - by Diagnosis Type
- 9.2.1. Cardiology
- 9.2.2. Oncology
- 9.2.3. Neurology
- 9.2.4. Radiology
- 9.2.5. Pathology
- 9.2.6. Others
- 9.3. Market Analysis, Insights and Forecast - by End User
- 9.3.1. Hospitals and Clinics
- 9.3.2. Clinical Laboratories
- 9.3.3. Others
- 9.1. Market Analysis, Insights and Forecast - by Product
- 10. South America Digital Diagnostics Industry Analysis, Insights and Forecast, 2019-2031
- 10.1. Market Analysis, Insights and Forecast - by Product
- 10.1.1. Hardware
- 10.1.2. Software
- 10.1.3. Services
- 10.2. Market Analysis, Insights and Forecast - by Diagnosis Type
- 10.2.1. Cardiology
- 10.2.2. Oncology
- 10.2.3. Neurology
- 10.2.4. Radiology
- 10.2.5. Pathology
- 10.2.6. Others
- 10.3. Market Analysis, Insights and Forecast - by End User
- 10.3.1. Hospitals and Clinics
- 10.3.2. Clinical Laboratories
- 10.3.3. Others
- 10.1. Market Analysis, Insights and Forecast - by Product
- 11. North America Digital Diagnostics Industry Analysis, Insights and Forecast, 2019-2031
- 11.1. Market Analysis, Insights and Forecast - By Country/Sub-region
- 11.1.1 United States
- 11.1.2 Canada
- 11.1.3 Mexico
- 12. Europe Digital Diagnostics Industry Analysis, Insights and Forecast, 2019-2031
- 12.1. Market Analysis, Insights and Forecast - By Country/Sub-region
- 12.1.1 Germany
- 12.1.2 United Kingdom
- 12.1.3 France
- 12.1.4 Italy
- 12.1.5 Spain
- 12.1.6 Rest of Europe
- 13. Asia Pacific Digital Diagnostics Industry Analysis, Insights and Forecast, 2019-2031
- 13.1. Market Analysis, Insights and Forecast - By Country/Sub-region
- 13.1.1 China
- 13.1.2 Japan
- 13.1.3 India
- 13.1.4 Australia
- 13.1.5 South Korea
- 13.1.6 Rest of Asia Pacific
- 14. Middle East and Africa Digital Diagnostics Industry Analysis, Insights and Forecast, 2019-2031
- 14.1. Market Analysis, Insights and Forecast - By Country/Sub-region
- 14.1.1 GCC
- 14.1.2 South Africa
- 14.1.3 Rest of Middle East and Africa
- 15. South America Digital Diagnostics Industry Analysis, Insights and Forecast, 2019-2031
- 15.1. Market Analysis, Insights and Forecast - By Country/Sub-region
- 15.1.1 Brazil
- 15.1.2 Argentina
- 15.1.3 Rest of South America
- 16. Competitive Analysis
- 16.1. Global Market Share Analysis 2024
- 16.2. Company Profiles
- 16.2.1 Siemens Healthcare GmbH
- 16.2.1.1. Overview
- 16.2.1.2. Products
- 16.2.1.3. SWOT Analysis
- 16.2.1.4. Recent Developments
- 16.2.1.5. Financials (Based on Availability)
- 16.2.2 Laboratory Corporation of America Holdings
- 16.2.2.1. Overview
- 16.2.2.2. Products
- 16.2.2.3. SWOT Analysis
- 16.2.2.4. Recent Developments
- 16.2.2.5. Financials (Based on Availability)
- 16.2.3 Cerora
- 16.2.3.1. Overview
- 16.2.3.2. Products
- 16.2.3.3. SWOT Analysis
- 16.2.3.4. Recent Developments
- 16.2.3.5. Financials (Based on Availability)
- 16.2.4 Digital Diagnostics Inc
- 16.2.4.1. Overview
- 16.2.4.2. Products
- 16.2.4.3. SWOT Analysis
- 16.2.4.4. Recent Developments
- 16.2.4.5. Financials (Based on Availability)
- 16.2.5 F Hoffmann-La Roche Ltd
- 16.2.5.1. Overview
- 16.2.5.2. Products
- 16.2.5.3. SWOT Analysis
- 16.2.5.4. Recent Developments
- 16.2.5.5. Financials (Based on Availability)
- 16.2.6 GE Healthcare
- 16.2.6.1. Overview
- 16.2.6.2. Products
- 16.2.6.3. SWOT Analysis
- 16.2.6.4. Recent Developments
- 16.2.6.5. Financials (Based on Availability)
- 16.2.7 Vuno Inc
- 16.2.7.1. Overview
- 16.2.7.2. Products
- 16.2.7.3. SWOT Analysis
- 16.2.7.4. Recent Developments
- 16.2.7.5. Financials (Based on Availability)
- 16.2.8 Midmark Corporation
- 16.2.8.1. Overview
- 16.2.8.2. Products
- 16.2.8.3. SWOT Analysis
- 16.2.8.4. Recent Developments
- 16.2.8.5. Financials (Based on Availability)
- 16.2.9 Nanox Imaging Ltd
- 16.2.9.1. Overview
- 16.2.9.2. Products
- 16.2.9.3. SWOT Analysis
- 16.2.9.4. Recent Developments
- 16.2.9.5. Financials (Based on Availability)
- 16.2.10 Novasignal Corporation
- 16.2.10.1. Overview
- 16.2.10.2. Products
- 16.2.10.3. SWOT Analysis
- 16.2.10.4. Recent Developments
- 16.2.10.5. Financials (Based on Availability)
- 16.2.11 Riverain Technologies
- 16.2.11.1. Overview
- 16.2.11.2. Products
- 16.2.11.3. SWOT Analysis
- 16.2.11.4. Recent Developments
- 16.2.11.5. Financials (Based on Availability)
- 16.2.12 ThermoFisher Scientific Inc
- 16.2.12.1. Overview
- 16.2.12.2. Products
- 16.2.12.3. SWOT Analysis
- 16.2.12.4. Recent Developments
- 16.2.12.5. Financials (Based on Availability)
- 16.2.1 Siemens Healthcare GmbH
List of Figures
- Figure 1: Global Digital Diagnostics Industry Revenue Breakdown (Million, %) by Region 2024 & 2032
- Figure 2: Global Digital Diagnostics Industry Volume Breakdown (K Unit, %) by Region 2024 & 2032
- Figure 3: North America Digital Diagnostics Industry Revenue (Million), by Country 2024 & 2032
- Figure 4: North America Digital Diagnostics Industry Volume (K Unit), by Country 2024 & 2032
- Figure 5: North America Digital Diagnostics Industry Revenue Share (%), by Country 2024 & 2032
- Figure 6: North America Digital Diagnostics Industry Volume Share (%), by Country 2024 & 2032
- Figure 7: Europe Digital Diagnostics Industry Revenue (Million), by Country 2024 & 2032
- Figure 8: Europe Digital Diagnostics Industry Volume (K Unit), by Country 2024 & 2032
- Figure 9: Europe Digital Diagnostics Industry Revenue Share (%), by Country 2024 & 2032
- Figure 10: Europe Digital Diagnostics Industry Volume Share (%), by Country 2024 & 2032
- Figure 11: Asia Pacific Digital Diagnostics Industry Revenue (Million), by Country 2024 & 2032
- Figure 12: Asia Pacific Digital Diagnostics Industry Volume (K Unit), by Country 2024 & 2032
- Figure 13: Asia Pacific Digital Diagnostics Industry Revenue Share (%), by Country 2024 & 2032
- Figure 14: Asia Pacific Digital Diagnostics Industry Volume Share (%), by Country 2024 & 2032
- Figure 15: Middle East and Africa Digital Diagnostics Industry Revenue (Million), by Country 2024 & 2032
- Figure 16: Middle East and Africa Digital Diagnostics Industry Volume (K Unit), by Country 2024 & 2032
- Figure 17: Middle East and Africa Digital Diagnostics Industry Revenue Share (%), by Country 2024 & 2032
- Figure 18: Middle East and Africa Digital Diagnostics Industry Volume Share (%), by Country 2024 & 2032
- Figure 19: South America Digital Diagnostics Industry Revenue (Million), by Country 2024 & 2032
- Figure 20: South America Digital Diagnostics Industry Volume (K Unit), by Country 2024 & 2032
- Figure 21: South America Digital Diagnostics Industry Revenue Share (%), by Country 2024 & 2032
- Figure 22: South America Digital Diagnostics Industry Volume Share (%), by Country 2024 & 2032
- Figure 23: North America Digital Diagnostics Industry Revenue (Million), by Product 2024 & 2032
- Figure 24: North America Digital Diagnostics Industry Volume (K Unit), by Product 2024 & 2032
- Figure 25: North America Digital Diagnostics Industry Revenue Share (%), by Product 2024 & 2032
- Figure 26: North America Digital Diagnostics Industry Volume Share (%), by Product 2024 & 2032
- Figure 27: North America Digital Diagnostics Industry Revenue (Million), by Diagnosis Type 2024 & 2032
- Figure 28: North America Digital Diagnostics Industry Volume (K Unit), by Diagnosis Type 2024 & 2032
- Figure 29: North America Digital Diagnostics Industry Revenue Share (%), by Diagnosis Type 2024 & 2032
- Figure 30: North America Digital Diagnostics Industry Volume Share (%), by Diagnosis Type 2024 & 2032
- Figure 31: North America Digital Diagnostics Industry Revenue (Million), by End User 2024 & 2032
- Figure 32: North America Digital Diagnostics Industry Volume (K Unit), by End User 2024 & 2032
- Figure 33: North America Digital Diagnostics Industry Revenue Share (%), by End User 2024 & 2032
- Figure 34: North America Digital Diagnostics Industry Volume Share (%), by End User 2024 & 2032
- Figure 35: North America Digital Diagnostics Industry Revenue (Million), by Country 2024 & 2032
- Figure 36: North America Digital Diagnostics Industry Volume (K Unit), by Country 2024 & 2032
- Figure 37: North America Digital Diagnostics Industry Revenue Share (%), by Country 2024 & 2032
- Figure 38: North America Digital Diagnostics Industry Volume Share (%), by Country 2024 & 2032
- Figure 39: Europe Digital Diagnostics Industry Revenue (Million), by Product 2024 & 2032
- Figure 40: Europe Digital Diagnostics Industry Volume (K Unit), by Product 2024 & 2032
- Figure 41: Europe Digital Diagnostics Industry Revenue Share (%), by Product 2024 & 2032
- Figure 42: Europe Digital Diagnostics Industry Volume Share (%), by Product 2024 & 2032
- Figure 43: Europe Digital Diagnostics Industry Revenue (Million), by Diagnosis Type 2024 & 2032
- Figure 44: Europe Digital Diagnostics Industry Volume (K Unit), by Diagnosis Type 2024 & 2032
- Figure 45: Europe Digital Diagnostics Industry Revenue Share (%), by Diagnosis Type 2024 & 2032
- Figure 46: Europe Digital Diagnostics Industry Volume Share (%), by Diagnosis Type 2024 & 2032
- Figure 47: Europe Digital Diagnostics Industry Revenue (Million), by End User 2024 & 2032
- Figure 48: Europe Digital Diagnostics Industry Volume (K Unit), by End User 2024 & 2032
- Figure 49: Europe Digital Diagnostics Industry Revenue Share (%), by End User 2024 & 2032
- Figure 50: Europe Digital Diagnostics Industry Volume Share (%), by End User 2024 & 2032
- Figure 51: Europe Digital Diagnostics Industry Revenue (Million), by Country 2024 & 2032
- Figure 52: Europe Digital Diagnostics Industry Volume (K Unit), by Country 2024 & 2032
- Figure 53: Europe Digital Diagnostics Industry Revenue Share (%), by Country 2024 & 2032
- Figure 54: Europe Digital Diagnostics Industry Volume Share (%), by Country 2024 & 2032
- Figure 55: Asia Pacific Digital Diagnostics Industry Revenue (Million), by Product 2024 & 2032
- Figure 56: Asia Pacific Digital Diagnostics Industry Volume (K Unit), by Product 2024 & 2032
- Figure 57: Asia Pacific Digital Diagnostics Industry Revenue Share (%), by Product 2024 & 2032
- Figure 58: Asia Pacific Digital Diagnostics Industry Volume Share (%), by Product 2024 & 2032
- Figure 59: Asia Pacific Digital Diagnostics Industry Revenue (Million), by Diagnosis Type 2024 & 2032
- Figure 60: Asia Pacific Digital Diagnostics Industry Volume (K Unit), by Diagnosis Type 2024 & 2032
- Figure 61: Asia Pacific Digital Diagnostics Industry Revenue Share (%), by Diagnosis Type 2024 & 2032
- Figure 62: Asia Pacific Digital Diagnostics Industry Volume Share (%), by Diagnosis Type 2024 & 2032
- Figure 63: Asia Pacific Digital Diagnostics Industry Revenue (Million), by End User 2024 & 2032
- Figure 64: Asia Pacific Digital Diagnostics Industry Volume (K Unit), by End User 2024 & 2032
- Figure 65: Asia Pacific Digital Diagnostics Industry Revenue Share (%), by End User 2024 & 2032
- Figure 66: Asia Pacific Digital Diagnostics Industry Volume Share (%), by End User 2024 & 2032
- Figure 67: Asia Pacific Digital Diagnostics Industry Revenue (Million), by Country 2024 & 2032
- Figure 68: Asia Pacific Digital Diagnostics Industry Volume (K Unit), by Country 2024 & 2032
- Figure 69: Asia Pacific Digital Diagnostics Industry Revenue Share (%), by Country 2024 & 2032
- Figure 70: Asia Pacific Digital Diagnostics Industry Volume Share (%), by Country 2024 & 2032
- Figure 71: Middle East and Africa Digital Diagnostics Industry Revenue (Million), by Product 2024 & 2032
- Figure 72: Middle East and Africa Digital Diagnostics Industry Volume (K Unit), by Product 2024 & 2032
- Figure 73: Middle East and Africa Digital Diagnostics Industry Revenue Share (%), by Product 2024 & 2032
- Figure 74: Middle East and Africa Digital Diagnostics Industry Volume Share (%), by Product 2024 & 2032
- Figure 75: Middle East and Africa Digital Diagnostics Industry Revenue (Million), by Diagnosis Type 2024 & 2032
- Figure 76: Middle East and Africa Digital Diagnostics Industry Volume (K Unit), by Diagnosis Type 2024 & 2032
- Figure 77: Middle East and Africa Digital Diagnostics Industry Revenue Share (%), by Diagnosis Type 2024 & 2032
- Figure 78: Middle East and Africa Digital Diagnostics Industry Volume Share (%), by Diagnosis Type 2024 & 2032
- Figure 79: Middle East and Africa Digital Diagnostics Industry Revenue (Million), by End User 2024 & 2032
- Figure 80: Middle East and Africa Digital Diagnostics Industry Volume (K Unit), by End User 2024 & 2032
- Figure 81: Middle East and Africa Digital Diagnostics Industry Revenue Share (%), by End User 2024 & 2032
- Figure 82: Middle East and Africa Digital Diagnostics Industry Volume Share (%), by End User 2024 & 2032
- Figure 83: Middle East and Africa Digital Diagnostics Industry Revenue (Million), by Country 2024 & 2032
- Figure 84: Middle East and Africa Digital Diagnostics Industry Volume (K Unit), by Country 2024 & 2032
- Figure 85: Middle East and Africa Digital Diagnostics Industry Revenue Share (%), by Country 2024 & 2032
- Figure 86: Middle East and Africa Digital Diagnostics Industry Volume Share (%), by Country 2024 & 2032
- Figure 87: South America Digital Diagnostics Industry Revenue (Million), by Product 2024 & 2032
- Figure 88: South America Digital Diagnostics Industry Volume (K Unit), by Product 2024 & 2032
- Figure 89: South America Digital Diagnostics Industry Revenue Share (%), by Product 2024 & 2032
- Figure 90: South America Digital Diagnostics Industry Volume Share (%), by Product 2024 & 2032
- Figure 91: South America Digital Diagnostics Industry Revenue (Million), by Diagnosis Type 2024 & 2032
- Figure 92: South America Digital Diagnostics Industry Volume (K Unit), by Diagnosis Type 2024 & 2032
- Figure 93: South America Digital Diagnostics Industry Revenue Share (%), by Diagnosis Type 2024 & 2032
- Figure 94: South America Digital Diagnostics Industry Volume Share (%), by Diagnosis Type 2024 & 2032
- Figure 95: South America Digital Diagnostics Industry Revenue (Million), by End User 2024 & 2032
- Figure 96: South America Digital Diagnostics Industry Volume (K Unit), by End User 2024 & 2032
- Figure 97: South America Digital Diagnostics Industry Revenue Share (%), by End User 2024 & 2032
- Figure 98: South America Digital Diagnostics Industry Volume Share (%), by End User 2024 & 2032
- Figure 99: South America Digital Diagnostics Industry Revenue (Million), by Country 2024 & 2032
- Figure 100: South America Digital Diagnostics Industry Volume (K Unit), by Country 2024 & 2032
- Figure 101: South America Digital Diagnostics Industry Revenue Share (%), by Country 2024 & 2032
- Figure 102: South America Digital Diagnostics Industry Volume Share (%), by Country 2024 & 2032
List of Tables
- Table 1: Global Digital Diagnostics Industry Revenue Million Forecast, by Region 2019 & 2032
- Table 2: Global Digital Diagnostics Industry Volume K Unit Forecast, by Region 2019 & 2032
- Table 3: Global Digital Diagnostics Industry Revenue Million Forecast, by Product 2019 & 2032
- Table 4: Global Digital Diagnostics Industry Volume K Unit Forecast, by Product 2019 & 2032
- Table 5: Global Digital Diagnostics Industry Revenue Million Forecast, by Diagnosis Type 2019 & 2032
- Table 6: Global Digital Diagnostics Industry Volume K Unit Forecast, by Diagnosis Type 2019 & 2032
- Table 7: Global Digital Diagnostics Industry Revenue Million Forecast, by End User 2019 & 2032
- Table 8: Global Digital Diagnostics Industry Volume K Unit Forecast, by End User 2019 & 2032
- Table 9: Global Digital Diagnostics Industry Revenue Million Forecast, by Region 2019 & 2032
- Table 10: Global Digital Diagnostics Industry Volume K Unit Forecast, by Region 2019 & 2032
- Table 11: Global Digital Diagnostics Industry Revenue Million Forecast, by Country 2019 & 2032
- Table 12: Global Digital Diagnostics Industry Volume K Unit Forecast, by Country 2019 & 2032
- Table 13: United States Digital Diagnostics Industry Revenue (Million) Forecast, by Application 2019 & 2032
- Table 14: United States Digital Diagnostics Industry Volume (K Unit) Forecast, by Application 2019 & 2032
- Table 15: Canada Digital Diagnostics Industry Revenue (Million) Forecast, by Application 2019 & 2032
- Table 16: Canada Digital Diagnostics Industry Volume (K Unit) Forecast, by Application 2019 & 2032
- Table 17: Mexico Digital Diagnostics Industry Revenue (Million) Forecast, by Application 2019 & 2032
- Table 18: Mexico Digital Diagnostics Industry Volume (K Unit) Forecast, by Application 2019 & 2032
- Table 19: Global Digital Diagnostics Industry Revenue Million Forecast, by Country 2019 & 2032
- Table 20: Global Digital Diagnostics Industry Volume K Unit Forecast, by Country 2019 & 2032
- Table 21: Germany Digital Diagnostics Industry Revenue (Million) Forecast, by Application 2019 & 2032
- Table 22: Germany Digital Diagnostics Industry Volume (K Unit) Forecast, by Application 2019 & 2032
- Table 23: United Kingdom Digital Diagnostics Industry Revenue (Million) Forecast, by Application 2019 & 2032
- Table 24: United Kingdom Digital Diagnostics Industry Volume (K Unit) Forecast, by Application 2019 & 2032
- Table 25: France Digital Diagnostics Industry Revenue (Million) Forecast, by Application 2019 & 2032
- Table 26: France Digital Diagnostics Industry Volume (K Unit) Forecast, by Application 2019 & 2032
- Table 27: Italy Digital Diagnostics Industry Revenue (Million) Forecast, by Application 2019 & 2032
- Table 28: Italy Digital Diagnostics Industry Volume (K Unit) Forecast, by Application 2019 & 2032
- Table 29: Spain Digital Diagnostics Industry Revenue (Million) Forecast, by Application 2019 & 2032
- Table 30: Spain Digital Diagnostics Industry Volume (K Unit) Forecast, by Application 2019 & 2032
- Table 31: Rest of Europe Digital Diagnostics Industry Revenue (Million) Forecast, by Application 2019 & 2032
- Table 32: Rest of Europe Digital Diagnostics Industry Volume (K Unit) Forecast, by Application 2019 & 2032
- Table 33: Global Digital Diagnostics Industry Revenue Million Forecast, by Country 2019 & 2032
- Table 34: Global Digital Diagnostics Industry Volume K Unit Forecast, by Country 2019 & 2032
- Table 35: China Digital Diagnostics Industry Revenue (Million) Forecast, by Application 2019 & 2032
- Table 36: China Digital Diagnostics Industry Volume (K Unit) Forecast, by Application 2019 & 2032
- Table 37: Japan Digital Diagnostics Industry Revenue (Million) Forecast, by Application 2019 & 2032
- Table 38: Japan Digital Diagnostics Industry Volume (K Unit) Forecast, by Application 2019 & 2032
- Table 39: India Digital Diagnostics Industry Revenue (Million) Forecast, by Application 2019 & 2032
- Table 40: India Digital Diagnostics Industry Volume (K Unit) Forecast, by Application 2019 & 2032
- Table 41: Australia Digital Diagnostics Industry Revenue (Million) Forecast, by Application 2019 & 2032
- Table 42: Australia Digital Diagnostics Industry Volume (K Unit) Forecast, by Application 2019 & 2032
- Table 43: South Korea Digital Diagnostics Industry Revenue (Million) Forecast, by Application 2019 & 2032
- Table 44: South Korea Digital Diagnostics Industry Volume (K Unit) Forecast, by Application 2019 & 2032
- Table 45: Rest of Asia Pacific Digital Diagnostics Industry Revenue (Million) Forecast, by Application 2019 & 2032
- Table 46: Rest of Asia Pacific Digital Diagnostics Industry Volume (K Unit) Forecast, by Application 2019 & 2032
- Table 47: Global Digital Diagnostics Industry Revenue Million Forecast, by Country 2019 & 2032
- Table 48: Global Digital Diagnostics Industry Volume K Unit Forecast, by Country 2019 & 2032
- Table 49: GCC Digital Diagnostics Industry Revenue (Million) Forecast, by Application 2019 & 2032
- Table 50: GCC Digital Diagnostics Industry Volume (K Unit) Forecast, by Application 2019 & 2032
- Table 51: South Africa Digital Diagnostics Industry Revenue (Million) Forecast, by Application 2019 & 2032
- Table 52: South Africa Digital Diagnostics Industry Volume (K Unit) Forecast, by Application 2019 & 2032
- Table 53: Rest of Middle East and Africa Digital Diagnostics Industry Revenue (Million) Forecast, by Application 2019 & 2032
- Table 54: Rest of Middle East and Africa Digital Diagnostics Industry Volume (K Unit) Forecast, by Application 2019 & 2032
- Table 55: Global Digital Diagnostics Industry Revenue Million Forecast, by Country 2019 & 2032
- Table 56: Global Digital Diagnostics Industry Volume K Unit Forecast, by Country 2019 & 2032
- Table 57: Brazil Digital Diagnostics Industry Revenue (Million) Forecast, by Application 2019 & 2032
- Table 58: Brazil Digital Diagnostics Industry Volume (K Unit) Forecast, by Application 2019 & 2032
- Table 59: Argentina Digital Diagnostics Industry Revenue (Million) Forecast, by Application 2019 & 2032
- Table 60: Argentina Digital Diagnostics Industry Volume (K Unit) Forecast, by Application 2019 & 2032
- Table 61: Rest of South America Digital Diagnostics Industry Revenue (Million) Forecast, by Application 2019 & 2032
- Table 62: Rest of South America Digital Diagnostics Industry Volume (K Unit) Forecast, by Application 2019 & 2032
- Table 63: Global Digital Diagnostics Industry Revenue Million Forecast, by Product 2019 & 2032
- Table 64: Global Digital Diagnostics Industry Volume K Unit Forecast, by Product 2019 & 2032
- Table 65: Global Digital Diagnostics Industry Revenue Million Forecast, by Diagnosis Type 2019 & 2032
- Table 66: Global Digital Diagnostics Industry Volume K Unit Forecast, by Diagnosis Type 2019 & 2032
- Table 67: Global Digital Diagnostics Industry Revenue Million Forecast, by End User 2019 & 2032
- Table 68: Global Digital Diagnostics Industry Volume K Unit Forecast, by End User 2019 & 2032
- Table 69: Global Digital Diagnostics Industry Revenue Million Forecast, by Country 2019 & 2032
- Table 70: Global Digital Diagnostics Industry Volume K Unit Forecast, by Country 2019 & 2032
- Table 71: United States Digital Diagnostics Industry Revenue (Million) Forecast, by Application 2019 & 2032
- Table 72: United States Digital Diagnostics Industry Volume (K Unit) Forecast, by Application 2019 & 2032
- Table 73: Canada Digital Diagnostics Industry Revenue (Million) Forecast, by Application 2019 & 2032
- Table 74: Canada Digital Diagnostics Industry Volume (K Unit) Forecast, by Application 2019 & 2032
- Table 75: Mexico Digital Diagnostics Industry Revenue (Million) Forecast, by Application 2019 & 2032
- Table 76: Mexico Digital Diagnostics Industry Volume (K Unit) Forecast, by Application 2019 & 2032
- Table 77: Global Digital Diagnostics Industry Revenue Million Forecast, by Product 2019 & 2032
- Table 78: Global Digital Diagnostics Industry Volume K Unit Forecast, by Product 2019 & 2032
- Table 79: Global Digital Diagnostics Industry Revenue Million Forecast, by Diagnosis Type 2019 & 2032
- Table 80: Global Digital Diagnostics Industry Volume K Unit Forecast, by Diagnosis Type 2019 & 2032
- Table 81: Global Digital Diagnostics Industry Revenue Million Forecast, by End User 2019 & 2032
- Table 82: Global Digital Diagnostics Industry Volume K Unit Forecast, by End User 2019 & 2032
- Table 83: Global Digital Diagnostics Industry Revenue Million Forecast, by Country 2019 & 2032
- Table 84: Global Digital Diagnostics Industry Volume K Unit Forecast, by Country 2019 & 2032
- Table 85: Germany Digital Diagnostics Industry Revenue (Million) Forecast, by Application 2019 & 2032
- Table 86: Germany Digital Diagnostics Industry Volume (K Unit) Forecast, by Application 2019 & 2032
- Table 87: United Kingdom Digital Diagnostics Industry Revenue (Million) Forecast, by Application 2019 & 2032
- Table 88: United Kingdom Digital Diagnostics Industry Volume (K Unit) Forecast, by Application 2019 & 2032
- Table 89: France Digital Diagnostics Industry Revenue (Million) Forecast, by Application 2019 & 2032
- Table 90: France Digital Diagnostics Industry Volume (K Unit) Forecast, by Application 2019 & 2032
- Table 91: Italy Digital Diagnostics Industry Revenue (Million) Forecast, by Application 2019 & 2032
- Table 92: Italy Digital Diagnostics Industry Volume (K Unit) Forecast, by Application 2019 & 2032
- Table 93: Spain Digital Diagnostics Industry Revenue (Million) Forecast, by Application 2019 & 2032
- Table 94: Spain Digital Diagnostics Industry Volume (K Unit) Forecast, by Application 2019 & 2032
- Table 95: Rest of Europe Digital Diagnostics Industry Revenue (Million) Forecast, by Application 2019 & 2032
- Table 96: Rest of Europe Digital Diagnostics Industry Volume (K Unit) Forecast, by Application 2019 & 2032
- Table 97: Global Digital Diagnostics Industry Revenue Million Forecast, by Product 2019 & 2032
- Table 98: Global Digital Diagnostics Industry Volume K Unit Forecast, by Product 2019 & 2032
- Table 99: Global Digital Diagnostics Industry Revenue Million Forecast, by Diagnosis Type 2019 & 2032
- Table 100: Global Digital Diagnostics Industry Volume K Unit Forecast, by Diagnosis Type 2019 & 2032
- Table 101: Global Digital Diagnostics Industry Revenue Million Forecast, by End User 2019 & 2032
- Table 102: Global Digital Diagnostics Industry Volume K Unit Forecast, by End User 2019 & 2032
- Table 103: Global Digital Diagnostics Industry Revenue Million Forecast, by Country 2019 & 2032
- Table 104: Global Digital Diagnostics Industry Volume K Unit Forecast, by Country 2019 & 2032
- Table 105: China Digital Diagnostics Industry Revenue (Million) Forecast, by Application 2019 & 2032
- Table 106: China Digital Diagnostics Industry Volume (K Unit) Forecast, by Application 2019 & 2032
- Table 107: Japan Digital Diagnostics Industry Revenue (Million) Forecast, by Application 2019 & 2032
- Table 108: Japan Digital Diagnostics Industry Volume (K Unit) Forecast, by Application 2019 & 2032
- Table 109: India Digital Diagnostics Industry Revenue (Million) Forecast, by Application 2019 & 2032
- Table 110: India Digital Diagnostics Industry Volume (K Unit) Forecast, by Application 2019 & 2032
- Table 111: Australia Digital Diagnostics Industry Revenue (Million) Forecast, by Application 2019 & 2032
- Table 112: Australia Digital Diagnostics Industry Volume (K Unit) Forecast, by Application 2019 & 2032
- Table 113: South Korea Digital Diagnostics Industry Revenue (Million) Forecast, by Application 2019 & 2032
- Table 114: South Korea Digital Diagnostics Industry Volume (K Unit) Forecast, by Application 2019 & 2032
- Table 115: Rest of Asia Pacific Digital Diagnostics Industry Revenue (Million) Forecast, by Application 2019 & 2032
- Table 116: Rest of Asia Pacific Digital Diagnostics Industry Volume (K Unit) Forecast, by Application 2019 & 2032
- Table 117: Global Digital Diagnostics Industry Revenue Million Forecast, by Product 2019 & 2032
- Table 118: Global Digital Diagnostics Industry Volume K Unit Forecast, by Product 2019 & 2032
- Table 119: Global Digital Diagnostics Industry Revenue Million Forecast, by Diagnosis Type 2019 & 2032
- Table 120: Global Digital Diagnostics Industry Volume K Unit Forecast, by Diagnosis Type 2019 & 2032
- Table 121: Global Digital Diagnostics Industry Revenue Million Forecast, by End User 2019 & 2032
- Table 122: Global Digital Diagnostics Industry Volume K Unit Forecast, by End User 2019 & 2032
- Table 123: Global Digital Diagnostics Industry Revenue Million Forecast, by Country 2019 & 2032
- Table 124: Global Digital Diagnostics Industry Volume K Unit Forecast, by Country 2019 & 2032
- Table 125: GCC Digital Diagnostics Industry Revenue (Million) Forecast, by Application 2019 & 2032
- Table 126: GCC Digital Diagnostics Industry Volume (K Unit) Forecast, by Application 2019 & 2032
- Table 127: South Africa Digital Diagnostics Industry Revenue (Million) Forecast, by Application 2019 & 2032
- Table 128: South Africa Digital Diagnostics Industry Volume (K Unit) Forecast, by Application 2019 & 2032
- Table 129: Rest of Middle East and Africa Digital Diagnostics Industry Revenue (Million) Forecast, by Application 2019 & 2032
- Table 130: Rest of Middle East and Africa Digital Diagnostics Industry Volume (K Unit) Forecast, by Application 2019 & 2032
- Table 131: Global Digital Diagnostics Industry Revenue Million Forecast, by Product 2019 & 2032
- Table 132: Global Digital Diagnostics Industry Volume K Unit Forecast, by Product 2019 & 2032
- Table 133: Global Digital Diagnostics Industry Revenue Million Forecast, by Diagnosis Type 2019 & 2032
- Table 134: Global Digital Diagnostics Industry Volume K Unit Forecast, by Diagnosis Type 2019 & 2032
- Table 135: Global Digital Diagnostics Industry Revenue Million Forecast, by End User 2019 & 2032
- Table 136: Global Digital Diagnostics Industry Volume K Unit Forecast, by End User 2019 & 2032
- Table 137: Global Digital Diagnostics Industry Revenue Million Forecast, by Country 2019 & 2032
- Table 138: Global Digital Diagnostics Industry Volume K Unit Forecast, by Country 2019 & 2032
- Table 139: Brazil Digital Diagnostics Industry Revenue (Million) Forecast, by Application 2019 & 2032
- Table 140: Brazil Digital Diagnostics Industry Volume (K Unit) Forecast, by Application 2019 & 2032
- Table 141: Argentina Digital Diagnostics Industry Revenue (Million) Forecast, by Application 2019 & 2032
- Table 142: Argentina Digital Diagnostics Industry Volume (K Unit) Forecast, by Application 2019 & 2032
- Table 143: Rest of South America Digital Diagnostics Industry Revenue (Million) Forecast, by Application 2019 & 2032
- Table 144: Rest of South America Digital Diagnostics Industry Volume (K Unit) Forecast, by Application 2019 & 2032
Frequently Asked Questions
1. What is the projected Compound Annual Growth Rate (CAGR) of the Digital Diagnostics Industry?
The projected CAGR is approximately 17.23%.
2. Which companies are prominent players in the Digital Diagnostics Industry?
Key companies in the market include Siemens Healthcare GmbH, Laboratory Corporation of America Holdings, Cerora, Digital Diagnostics Inc, F Hoffmann-La Roche Ltd, GE Healthcare, Vuno Inc , Midmark Corporation, Nanox Imaging Ltd, Novasignal Corporation, Riverain Technologies, ThermoFisher Scientific Inc.
3. What are the main segments of the Digital Diagnostics Industry?
The market segments include Product, Diagnosis Type, End User.
4. Can you provide details about the market size?
The market size is estimated to be USD XX Million as of 2022.
5. What are some drivers contributing to market growth?
Rising Adoption of Digitalization in Chronic Disease Management; Increasing Burden of Chronic Diseases.
6. What are the notable trends driving market growth?
Oncology Segment is Expected to Account for the Large Market Share During the Forecast Period.
7. Are there any restraints impacting market growth?
High Cost of Instruments.
8. Can you provide examples of recent developments in the market?
In May 2022, TestCard, a MedTech company, received USD 10 million in its latest round of fundraising, which will be used primarily to further commercialize its existing product suite whilst also launching new products such as diabetes, pregnancy, CKD, and flu testing.
9. What pricing options are available for accessing the report?
Pricing options include single-user, multi-user, and enterprise licenses priced at USD 4750, USD 5250, and USD 8750 respectively.
10. Is the market size provided in terms of value or volume?
The market size is provided in terms of value, measured in Million and volume, measured in K Unit.
11. Are there any specific market keywords associated with the report?
Yes, the market keyword associated with the report is "Digital Diagnostics Industry," which aids in identifying and referencing the specific market segment covered.
12. How do I determine which pricing option suits my needs best?
The pricing options vary based on user requirements and access needs. Individual users may opt for single-user licenses, while businesses requiring broader access may choose multi-user or enterprise licenses for cost-effective access to the report.
13. Are there any additional resources or data provided in the Digital Diagnostics Industry report?
While the report offers comprehensive insights, it's advisable to review the specific contents or supplementary materials provided to ascertain if additional resources or data are available.
14. How can I stay updated on further developments or reports in the Digital Diagnostics Industry?
To stay informed about further developments, trends, and reports in the Digital Diagnostics Industry, consider subscribing to industry newsletters, following relevant companies and organizations, or regularly checking reputable industry news sources and publications.
Methodology
Step 1 - Identification of Relevant Samples Size from Population Database


Step 2 - Approaches for Defining Global Market Size (Value, Volume* & Price*)

Note*: In applicable scenarios
Step 3 - Data Sources
Primary Research
- Web Analytics
- Survey Reports
- Research Institute
- Latest Research Reports
- Opinion Leaders
Secondary Research
- Annual Reports
- White Paper
- Latest Press Release
- Industry Association
- Paid Database
- Investor Presentations

Step 4 - Data Triangulation
Involves using different sources of information in order to increase the validity of a study
These sources are likely to be stakeholders in a program - participants, other researchers, program staff, other community members, and so on.
Then we put all data in single framework & apply various statistical tools to find out the dynamic on the market.
During the analysis stage, feedback from the stakeholder groups would be compared to determine areas of agreement as well as areas of divergence
